
Abstract
The North Alpine Foreland Basin in SE Germany is Germany’s most active deep geothermal province. However, in its southern and eastern part the basin is considerably overpressured, which is a significant challenge for drilling deep geothermal wells. In this study, we combine drilling data and velocity-based pore pressure analyses with 3D basin modeling to assess the predictability and controlling factors of overpressure in the sub-regional context (area of 80 km × 50 km) around the Geretsried GEN-1 well, a deep geothermal exploration well in the southern part of the North Alpine Foreland Basin in SE Germany. Drilling data and velocity-based pore pressure analyses indicate overpressure maxima in the Lower Oligocene (Rupelian and Schoeneck Formation) and up to mild overpressure in the Upper Oligocene (Chattian) and Upper Cretaceous, except for the hydrostatically pressured northwestern part of the study area. 3D basin modeling calibrated to four hydrocarbon wells surrounding the Geretsried GEN-1 well demonstrates the dominating role of disequilibrium compaction and low permeability units related to overpressure generation in the North Alpine Foreland Basin. However, secondary overpressure generation mechanisms are likely contributing. Also, the impact of Upper Cretaceous shales, which are eroded in the northwestern part of the study area, on overpressure maintenance is investigated. The calibrated basin model is tested against the drilling history and velocity (VSP) data-based pore pressure estimate of the Geretsried GEN-1 well and reveals that pore pressure prediction is generally possible using 3D basin modeling in the North Alpine Foreland Basin, but should be improved with more detailed analysis of lateral drainage systems and facies variations in the future. The results of the study are of relevance to future well planning and drilling as well as to geomechanical modeling of subsurface stresses and deep geothermal production in the North Alpine Foreland Basin.
Introduction
Within any deep geothermal project, drilling is associated with the highest risk, both economically and safety-wise (e.g., Stober and Bucher 2013). This especially applies to deep geothermal projects in basins with very deep target sections and with only a few wells being drilled per year, such as the North Alpine Foreland Basin in SE Germany. Quite often the effective implementation and continuation of a deep geothermal project depend on the success of the first well drilled. Therefore, most deep geothermal projects are similar to classical wild cat exploration situations. Unexpected changes in pore pressure and subsurface stresses can lead to severe drilling problems such as influxes, kicks, blow-outs, drilling fluid losses, differential sticking, over-pulls, etc., which in the best case only delay drilling and cause economic damage, but in the worst case endanger the continuation of the project or even pose a significant safety risk (Mouchet and Mitchell 1989). Therefore, careful well planning and adequate prediction of subsurface stresses and pressures are crucial for a successful completion of deep geothermal projects and deep drilling in general. This is particularly valid in overpressured basins (Mouchet and Mitchell 1989).
Overpressure is defined as the excess pressure above hydrostatic pore pressure given by a vertical depth, the formation water’s density and the Earth’s gravitational acceleration. Overpressure or pore pressure in general can be estimated from data sources such as geophysical well logs (Bowers 1995; Eaton 1975, 1972), seismic velocities derived from vertical seismic profiles, seismic surveys or sonic logs (Bowers 1995; Eaton 1975, 1972), drilling parameters (Mouchet and Mitchell 1989) and basin modeling (Bjørlykke et al. 2010; Darby et al. 1998; Karlsen and Skeie 2006; Mosca et al. 2018; Mudford et al. 1991; Peters et al. 2017; Satti et al. 2015). Origins of overpressure include disequilibrium compaction through retarded dewatering of pore fluids due to low permeability barriers in the context of high sedimentation rates (Osborne and Swarbrick 1997; Swarbrick and Osborne 1998) and volume changes due to diagenesis and/or fluid expansion at higher temperatures (Osborne and Swarbrick 1997; Sargent et al. 2015; Swarbrick and Osborne 1998). Additional overpressure can be induced in extensive, laterally amalgamated and dipping permeable sediments through lateral pressure transfer (Lupa et al. 2002; Yardley and Swarbrick 2000).
Within the North Alpine Foreland Basin in SE Germany overpressure is known to generally increase with burial depth from north to south and towards the Alps (Drews et al. 2018; Müller et al. 1988). Particularly to the south and east of Munich, overpressure can reach significant pressure gradients that translate to equivalent drilling fluid densities (mud weight) in excess of 1.8 g/cm3 (Drews et al. 2018; Müller et al. 1988). Overpressure in the North Alpine Foreland Basin in SE Germany has been previously studied by Rizzi (1973), who demonstrated with two examples, that overpressure can be estimated from geophysical well logs such as electrical resistivity and acoustic transit time (sonic log). Müller et al. (1988) and Müller and Nieberding (1996) were the first to study the regional distribution of maximum overpressure and its origin, based on a combination of maximum drilling mud weights and the structural interpretation of 2D seismic cross-sections. They presented a regional map of maximum pore pressure gradients inferred from maximum drilling mud weights. Based on analysis of drilling data and velocity data, Drews et al. (2018) demonstrated that overpressure can be estimated with reasonable accuracy from seismic velocities of sonic logs and vertical seismic profiles. Drews et al. (2018) also provided pore pressure gradient maps for all overpressured stratigraphic units present in the North Alpine Foreland Basin in SE Germany. However, previous work by Müller et al. (1988), Müller and Nieberding (1996) and Drews et al. (2018) were either based on drilling mud weight data and/or 1D velocity data of hydrocarbon wells, but did not incorporate 3D geologic models. Furthermore, these studies did not include any more recent deep geothermal wells from the North Alpine Foreland Basin in SE Germany, despite several deep geothermal wells have been drilled in the overpressured part of the basin during the past two decades—in some cases with significant overpressure-related drilling problems (Lackner et al. 2018).
A recent example of a deep geothermal exploration well in the overpressured section of the North Alpine Foreland Basin in SE Germany is given by the Geretsried Deep Geothermal Project, approximately 30 km SSE of Munich. In this study, the predictability and controlling factors of overpressure in the greater Geretsried area will be analyzed, combining drilling- and velocity data-based well analyses and pore pressure–centric 3D basin modeling. The results will be compared with pore pressure indicators from drilling data and a pore pressure estimate from vertical seismic profile (VSP) data of the Geretsried GEN-1 well. The integration of these methods is the first of its kind in the North Alpine Foreland Basin in SE Germany, especially in the context of deep geothermal projects in South Germany. The results of this study are of relevance to planning and drilling of future deep geothermal wells in the North Alpine Foreland Basin in SE Germany. Quantification of overpressure is also of significance to geomechanical studies in the North Alpine Foreland Basin in SE Germany, e.g., considering the prediction of induced microseismicity caused by geothermal exploitation. In addition, the presented methodology and results will be a valuable reference case for other pore pressure studies to investigate overpressure distributions and mechanisms in sedimentary basins with a combination of different methods and from limited data sources.
Geological setting
The North Alpine Foreland Basin is a classical peripheral foreland basin. Its part in SE Germany stretches from Lake Constance in the west to the Austrian border in the east (Fig. 1). To the north, the extent of the North Alpine Foreland Basin in SE Germany is roughly outlined by the Danube River, and towards the south it is bounded by the thrust-front of the Subalpine Molasse (also called Folded Molasse; Fig. 1). The wedge-shaped North Alpine Foreland Basin in SE Germany is filled with Cenozoic sediments (Late Eocene to Late Miocene age), which overlie Mesozoic pre-Molasse strata (Janssen et al. 2018; Kuhlemann and Kempf 2002) (Fig. 2). The target for the geothermal utilization are the carbonates of the Upper Jurassic, which are generally under- to normally pressured (Lemcke 1976).

Map of the North Alpine Foreland Basin in SE Germany [after (Drews et al. 2018; Reinecker et al. 2010)]. The inset illustrates the location of the North Alpine Foreland Basin in SE Germany. The grey area marks the outline of the North Alpine Foreland Basin in Germany and Western Switzerland. The study area is indicated by the red-dashed rectangle. The approximate location of the Geretsried GEN-1 well is highlighted with a white star

Chronostratigraphic chart for the North Alpine Foreland Basin in SE Germany with nomenclature and geologic ages [after (Drews et al. 2018; Kuhlemann and Kempf 2002)]. Geologic ages for Late Miocene–Rupelian, Schoeneck–Eocene and Mesozoic from Kuhlemann and Kempf (2002), Zweigel (1998) and Cohen et al. (2013), respectively. The term Lattorf/Sannoisian is outdated and replaced in this study by the Schoeneck Formation (c.f. Janssen et al. 2018). However, the term is generally used in well tops of the used oil and gas wells and therefore also displayed in this figure for reference
The presence of overpressure in the North Alpine Foreland Basin in SE Germany has been attributed to disequilibrium compaction due to sedimentation rates exceeding dewatering rates of the buried fine-grained sediments (Drews et al. 2018; Müller et al. 1988). According to previous studies (Allen and Allen 2013; Zweigel 1998), peak sedimentation rates around 300 m/Ma occurred during Chattian and Aquitanian times. During the Cenozoic, fine-grained sediments forming shales and marls were primarily deposited during the high-stand phases in the Oligocene (Rupelian and Chattian) and Lower Miocene (Aquitanian) (Fig. 2) (Kuhlemann and Kempf 2002). Overpressure in the Cenozoic section is usually found in Oligocene strata, in particular in the Lower Oligocene (Rupelian including the Schoeneck Formation) (Drews et al. 2018; Müller et al. 1988). In addition, Drews et al. (2018) interpreted the development of overpressure in Cenozoic sediments to be controlled by the presence of Upper Cretaceous shales retarding dewatering into the under- to normally pressured Upper Jurassic carbonates. Upper Cretaceous shales can also be significantly overpressured (Drews et al. 2018; Müller et al. 1988). However, Upper Cretaceous strata are not present in the west and northwest of the North Alpine Foreland Basin in SE Germany due to Paleocene/Eocene erosion (Bachmann et al. 1987) (Fig. 2).
Although the stress regime of the North Alpine Foreland Basin in SE Germany is controversially discussed (Drews and Stollhofen 2019; Drews et al. 2018, 2019; Greiner and Lohr 1980; Lohr 1978; Megies and Wassermann 2014; Müller and Nieberding 1996; Müller et al. 1988; Reinecker et al. 2010; Seithel et al. 2015, 2019; Ziegler et al. 2016), Drews et al. (2018) showed that disequilibrium compaction with the assumption of vertical stress as a proxy for mean stress is a valid model to estimate pore pressure and overpressure from shale velocities in the North Alpine Foreland Basin in SE Germany. This is also supported by the interpretation of leak-off tests and formation integrity tests in shale packages in the greater Munich area, which suggest the presence of a normal faulting or trans-tensional stress regime in the Cenozoic basin fill of the North Alpine Foreland Basin in the greater Munich area (Drews et al. 2019).
Data and methods
The aim of this study is to (a) investigate how a combination of velocity-based pore pressure analyses, drilling data and basin modeling can be used to predict pore pressure in the North Alpine Foreland Basin in SE Germany and (b) what are the controlling geological factors on overpressure presence and generation in the greater area around the Geretsried GEN-1 well location. To do so, the 3D basin model is calibrated to velocity and drilling data-derived pore pressure profiles of four wells in the greater Geretsried area. The basin model also serves the purpose of investigating the controlling factors of overpressure presence. The Geretsried GEN-1 well is not part of the calibration, but acts as a blind test. To do so, a 1D pore pressure extraction from the calibrated 3D basin model at the Geretsried GEN-1 well location is compared to the drilling history, drilling-related pore pressure indicators and a pore pressure estimate from the vertical seismic profile data of the Geretsried GEN-1 well.
Drilling history and pore pressure indicators of the Geretsried GEN-1 well
The deep geothermal project “Geretsried Nord” was initiated by Enex Power Germany GmbH on the Wolfratshausen concession in September 2004. The Geretsried GEN-1 well was planned as a producer and was drilled approximately 5 km northwest of the city of Geretsried from mid-January 2013 to mid-July 2013. The well reached a total vertical depth of 4852 m (6036 m in measured depth). Despite excellent temperature conditions with a bottom-hole temperature of about 160 °C the project was halted due to a lack of productivity in the targeted Upper Jurassic (Malm) carbonate aquifer. In 2017, a scientific sidetrack was drilled into a nearby fault zone in hope of increased permeability, but it did not yield a sufficient increase in productivity. In true vertical depth (TVD), the Geretsried GEN-1 well penetrated approximately 70 m of Quaternary sediments, 4162 m of Cenozoic deposits, 105 m of Cretaceous stratigraphy and 515 m of Upper Jurassic carbonates (Malm). The Geretsried GEN-1 well was drilled in five sections. Figure 3 is a graphical representation of the following description of the drilling history and pressure indicators of the Geretsried GEN-1 well.

Graphical representation of the drilling history and drilling-related pressure indicators of the Geretsried GEN-1 well. a Pressure in equivalent mud weight (EMW) in g/cm3 vs. true vertical depth (TVD) with drilling mud weight MW (brown line), hydrostatic pressure Hyd (blue dotted line), influx events (red dots and annotations), other overpressure indications (purple annotations) and stratigraphic tops. b Total gas readings while drilling on a logarithmic scale in percent (red lines and dots) and casing shoe points (black triangles). c Simplified lithological profile based on cutting descriptions from the geological well report (legend on the bottom provides key for lithotypes)
In the first two sections (down to 2922 m) low gas readings and a drilling mud weight of less than 1.2 g/cm3 generally indicate balanced to overbalanced drilling and likely hydrostatic pressure conditions (Fig. 3a, b). However, within lower Aquitanian and Chattian shale sequences (Fig. 3c) increased cavings, over-pulls and tight-hole sections were recorded (Fig. 3a), which might indicate underbalanced drilling and slightly elevated pore pressures. Accordingly, maximum total gas readings of 7.1% were detected in the sands of the Lower Chattian (Fig. 3b).
During drilling of the third section the drilling mud weight was increased from 1.16 to 1.25 g/cm3 followed by a water influx within Chattian/Rupelian sands of the so called Baustein Beds at 3285 m (Fig. 3a). Recorded shut-in pressures of 17.13 MPa and a drilling mud weight of 1.25 g/cm3 indicate a formation pressure of 57.41 MPa or an equivalent mud weight of 1.78 g/cm3. The drilling mud weight was therefore increased to 1.86 g/cm3 until high total gas readings of up to 49% within the lower Oligocene and possibly Eocene required a further mud weight increase to 1.94 g/cm3, which finally stopped the increased gas readings (Fig. 3a, b). A formation pressure between 1.86 and 1.94 g/cm3 around 4115 m vertical depth is therefore likely. Consequently, the section was cased with a 9 5/8″ string down to 4123 m vertical depth.
The next section (2922–4122 m) experienced high total gas readings and a small gas kick (Fig. 3a, b). Measured shut-in pressures within the Eocene Lithothamnium Limestone yielded formation pressures of 51.02 MPa or 1.26 g/cm3 in equivalent mud weight. As a result, the drilling mud weight was increased from 1.24 to 1.31 g/cm3, which stopped the gas influx.
The last section was drilled entirely within the Upper Jurassic carbonate aquifer (Malm) to a TVD of 4852 m (6036 m measured depth) with a maximum drilling mud weight of 1.07 g/cm3 (Fig. 3a). However, high gas readings within the Upper Jurassic of up to 73% indicate underbalanced drilling and likely an Upper Jurassic aquifer (Fig. 3b), which is slightly overpressured and eventually not as hydraulically active as described in other parts of the North Alpine Foreland Basin in SE Germany (c.f. Lemcke 1976). These observations fit with the low productivity rates found in the Geretsried GEN-1 well.
Study area and well data
The study area extends over 80 × 50 km and is roughly centered by the Geretsried GEN-1 drill site approximately 30 km south of Munich (Fig. 4). The study area includes closer studied wells in the north (Well A), west (Well B), east (Well C) and northeast (Well D) of the Geretsried GEN-1 drill site (Fig. 4). Velocity and drilling data of these four wells have been studied in more detail to provide pressure calibration points for the 3D basin model. An additional set of 14 wells plus one well approximately 7 km WNW outside of the study area were used to constrain extent and thickness of the stratigraphic units included in the 3D basin model (Fig. 4). The available data of all wells are summarized in Table 1.

Study area and extent of 3D basin model with used wells. The Geretsried GEN-1 drill site is marked with a grey star, the calibration wells a–d are marked with black crosses, while black dots indicate additional wells (B1–B15) used to constrain the 3D basin model. One well is outside of the map area and was used to constrain the extent of the Schoeneck Formation. The map coincides with the extent of the full basin model, which has been reduced to an area of interest (AOI, marked by the black lined polygon) after simulation
Vertical seismic profile (VSP) data of the Geretsried GEN-1 well
The near-offset VSP (i.e., source was located at 81 m offset from the wellhead) was measured by DMT/Weatherford in the deviated Geretsried GEN-1 well in 2016 (Bello 2016). Two primary objectives were pursued: (a) gaining the velocity control through the well and (b) establishing the tie between seismic events and formation tops. The VSP acquisition was performed at the depth interval of 1880 m to 4265 m MD below ground level with a vertical spacing of c. 15 m between successive geophones. The depth interval of 465 m to 1880 m MD below ground level was covered by a check-shot survey, where time-to-depth measurements were taken at 7 irregularly spaced geophone locations. Consequently, the combined check-shot-VSP survey covers the entire stratigraphic profile between top Burdigalian and base Eocene (compare Fig. 2). Measured depths and times were corrected with respect to the wellbore deviation and then referenced to the Seismic Reference Datum (SRD) of 450 m above mean sea level, using a correction velocity of 3000 m/s. Interval velocities were subsequently calculated based on the corrected depth and time measurements.
Velocity-based pore pressure analysis
For the velocity-based pore pressure analysis of the four calibration wells Well A, Well B, Well C and Well D, available sonic log and VSP data were used to estimate shale pore pressure. Thereby, the workflow strictly followed the methodology and normal compaction trend developed by Drews et al. (2018), who used a combination of an Athy-porosity law (Athy 1930) modified for effective stress (c.f. Heppard et al. 1998; Hubbert and Rubey 1959; Scott and Thomsen 1993) and a porosity–velocity transform for shales (Issler 1992; Raiga-Clemenceau et al. 1988) to constrain a normal compaction trend for shale velocity from 44 wells with normally pressured shale sections in the North Alpine Foreland Basin in SE Germany. In combination with the Eaton pressure transform for seismic velocity (Eaton 1975, 1972), the normal compaction trend can be used to estimate shale pore pressure in the North Alpine Foreland Basin in SE Germany.
The described method requires an estimate of the vertical stress σv. Sufficient density data were neither available for the calibration wells, nor for the Geretsried GEN-1 well. Thus, the velocity–density transform of Gardner et al. (1974) was applied in those cases in which vertical seismic profile data were available. Otherwise an Athy-type effective stress–porosity relationship with the parameters defined by Drews et al. (2018) was used. In this study, pore pressures and subsurface stresses are usually presented as pressure/stress gradients in equivalent mud weight (EMW) with the density unit g/cm3, which is calculated as follows:
where PP is the pore pressure in kPa, g is the Earth’s gravitational acceleration at 9.81 m/s2 and TVD is the true vertical depth in m, referenced to the ground level of the drill site. In Eq. 1, PP can also be substituted by any stress parameter to represent stress in equivalent mud weight.
3D basin modeling
3D modeling in this study has been performed using the PetroMod© Modelling Software 2016.2. Temperature and pressure evolution through time has been simulated using the PetroMod© Simulation Software 2016.2 without considering hydrocarbon generation and migration (c.f. Hantschel and Kauerauf 2009). The simulation only accounts for vertical loading driven overpressure generation (disequilibrium compaction) and lateral and vertical fluid flow.
Geological and geometric constraints
Modeling is performed on the basis of stratigraphic well tops from geological well reports of 20 wells (c.f. Table 1 and Fig. 4). Structural elements such as faults are not included in the model. Individual horizons are generated on the basis of interpolation of thicknesses of the respective stratigraphic units. Facies variations within individual stratigraphic units have not been included in the basin model to keep the degrees of freedom to a minimum. Therefore, the model results represent general pore pressure trends and cannot reflect pressure perturbations due to structural or facies-related heterogeneities.
For the sake of comparability, the geologic ages have been assigned according to previous studies, which specifically addressed stratigraphy, sedimentation and subsidence of the North Alpine Foreland Basin in SE Germany (c.f. Fig. 2): for the Cenozoic section ages have been assigned according to Kuhlemann and Kempf (2002), except for the geological ages of the Schoeneck Formation and the Eocene, which have been derived from Zweigel (1998). Since the Cenozoic basin subsidence put the underlying Mesozoic strata most likely to their maximum burial depth, Paleocene and Eocene erosion events have only been modeled as stratigraphic pinch-outs of the eroded strata. Accordingly, geologic ages for the underlying Mesozoic strata were simply derived from the International Chronostratigraphic Chart (Cohen et al. 2013). Thus, the Mesozoic section of the 3D basin model of this study should be seen as a pre-existing basement section, while the actual basin modeling process starts with the Cenozoic basin fill.
Lithological and petrophysical constraints
Facies variations are not included in this study and therefore only three basic lithologies are used: sandstone (typical and clay-rich after Hantschel and Kauerauf 2009), limestone (ooid grainstone and typical chalk after Hantschel and Kauerauf 2009) and shale. Porosity and permeability of sandstones and limestones have been modeled using Athy’s depth–porosity relationship (Athy 1930; c.f. Fig. 5a) and a three-point porosity–permeability relationship (Fig. 5b), respectively, with parameters for both porosity and permeability relationships provided by Hantschel and Kauerauf (2009). Shale compaction (porosity as a function of effective stress) has been modeled with the same porosity trend as used for constraining the normal compaction trend of the velocity-based analysis (c.f. Drews et al. 2018; Fig. 5a).

Compaction and permeability relationships used in this study. a Porosity vs. true vertical depth (TVD). Relationships for sandstone (typical), sandstone (clay rich), limestone (ooid grainstone) and limestone (chalk, typical) are modeled with Athy’s porosity–depth function (Athy 1930) and input parameters provided by Hantschel and Kauerauf (2009). Shale compaction has been modeled with Athy’s relationship modified for effective stress (for this plot hydrostatic pressure is assumed) and input parameters after Drews et al. (2018). b Vertical permeability as a function of porosity. Relationships for sandstone (typical), sandstone (clay rich), limestone (ooid grainstone) and limestone (chalk, typical) are modeled using three-point relationships after Hantschel and Kauerauf (2009). Shale permeability has been modeled with the empirical relationship after Yang and Aplin (2010) displayed for clay contents of 50% (light grey line), 70% (dark grey line) and 90% (black line). The dashed grey and black lines represent the 2-phase correction from Busch and Amann-Hildenbrand (2013) applied to shale permeabilities derived from the relationship from Yang and Aplin (2010) displayed for clay contents of 50% (light grey dashed line), 70% (dark grey dashed line) and 90% (black dashed line)
Shales play a significant role in overpressure generation due to their low permeability (Osborne and Swarbrick 1997) and most likely are the main driver for overpressure generation in the North Alpine Foreland Basin (Drews et al. 2018). Shale permeability has been modeled with the clay content-dependent porosity–permeability developed by Yang and Aplin (2010), which covers a permeability range between 10−18 and 10−21 m2 for clay contents between 50% and 90% (Fig. 5b). However, both the relatively thin Schoeneck Formation and Upper Cretaceous shales are known to comprise significant overpressure in the North Alpine Foreland Basin in SE Germany (Drews et al. 2018), suggesting even lower permeability might be required to build up and maintain significant overpressure. Since at least the Schoeneck Formation is known to be organic-rich (Bachmann et al. 1987), two-phase permeability reduction offers a possible explanation for shale permeabilities below 10−21 m2. Laboratory studies demonstrated that two-phase permeability of mudrocks can be reduced by > 2 orders of magnitudes compared to single-phase permeabilities (Busch and Amann-Hildenbrand 2013). For a 2-phase system between methane and water, the following empirical relationship has been found by Busch and Amann-Hildenbrand (2013):
where K2-phase is the reduced 2-phase shale permeability and KSingle is the actual single-phase shale permeability. Figure 5 summarizes all compaction and permeability relationships used in this study.
Boundary conditions
The Upper Jurassic carbonates are known to be at sub-hydrostatic to hydrostatic pressure conditions (Drews et al. 2018; Lemcke 1976). Therefore, a permanent hydrostatic pressure boundary condition (referenced to sea level) has been set for the Jurassic. For the modeled geologic history of the study area (200 Ma to present day), a constant surface temperature of 10 °C has been applied. The basal heat flux (BHF) has been set to 53 mW/m2, which is in concordance with previous studies in the North Alpine Foreland Basin (Gusterhuber et al. 2014). Since only very little information is known about absolute paleo-sea level values and since water depth changes have no impact on effective stress and thus present day pore pressure, paleo-water depths were not included (zero water depth assumed for all modeled stratigraphic events).
Results and discussion
3D basin model
A 3D basin has been set up to investigate (a) the sub-regional pore pressure distribution; (b) the impact of presence and distribution of stratigraphic units and their permeability and (c) the predictability of overpressure in the North Alpine Foreland Basin in SE Germany, using the Geretsried GEN-1 well as a blind test. The basin model has been constrained to stratigraphic tops of 20 wells with a minimum distance of ~ 3 km between two wells (c.f. Fig. 4). A horizontal cell size of 1 km × 1 km was used for the basin model. The basin model comprises 11 layers (Fig. 6 ) and the number of sublayers has been set such that the vertical cell size does not exceed 500 m, yielding a total of 22 layers. The extent of the basin model is identical to the map of Fig. 4, resulting in an 80 km × 50 km grid. The model has been cropped to an area of interest (AOI) after simulation (c.f. Fig. 4). Within the AOI, the resulting maximum difference between actual present day well tops and modeled stratigraphic tops at the individual well locations does not exceed 70 m for the base of the Chattian (c.f. Fig. 6), which is the thickest stratigraphic unit (average thickness of 1200 m in the AOI, Fig. 7) and therefore associated with the highest potential deviation. All layers fully cover the AOI, except for the Schoeneck Formation, Eocene and Upper Cretaceous, which are missing in the northwest due to erosion or non-deposition. Erosion of these units has been implemented as stratigraphic pinch-outs (Fig. 7). Dividing thickness (Fig. 7) by respective age intervals of the layers provides a first order estimate of subsidence rates of > 400 m/Ma during the Chattian. Since the basin model only accounts for fluid flow and disequilibrium compaction to produce overpressure, the thickness of low permeability units (mostly Chattian and Rupelian) should also be an indicator of where higher overpressure is more likely to build up. Thereby, the Chattian and Rupelian sum up to approximately 900 m, 1900 m, 2200, 1650 m and 2100 m at the locations of Well A, Well B, Well C, Well D and the Geretsried GEN-1 well.

Arbitrary cross-section through the 3D basin model and locations of Well A, Well B, Geretsried GEN-1, Well C and Well D. The black dashes at the well locations represent the respective well tops from geological well reports. The inset map shows the transect of the cross-section (red line). The cross-section is vertically exaggerated by a factor of 10

Isopach maps of each layer of the 3D basin model, except for the Quaternary (thickness generally < 100 m) and Jurassic, which has been modeled with a constant thickness of 600 m
Pore pressure calibration of the 3D basin model
Drilling data and velocity-based pore pressure estimates
The basin model has been calibrated to drilling data and velocity-based pore pressure estimates of Well A, Well B, Well C and Well D (Fig. 8a–d). In summary, all wells have pore pressure maxima at the base Rupelian and top Schoeneck Formation (Fig. 8a–d). Except for Well A, all wells comprise overpressured sections in the Rupelian and Schoeneck Formation, while Chattian and Upper Cretaceous shales are only overpressured at Well C:

Pore pressure overview and velocity data of the calibration wells. Depth in true vertical depth (TVD) from ground level, pressure and stress in equivalent mud weight (EMW) in g/cm3. a–d also show casing shoe depths (black triangles), drilling mud weight MW (brown line), hydrostatic pressure Hyd (dashed light-blue line), estimated pore pressure from VSP or sonic data (PPseis, blue line), estimated pore pressure from the 3D basin model (C19 = dashed dark blue line, C21 = dotted dark blue line, Sch2 = dotted black line, LC3 = dotted brown line, Eo1 = dotted cyan line), vertical stress σv (solid black line), total gas readings TG (red annotations) and stratigraphic tops (black annotations). a Overview of Well A. Total gas data were not available. b Overview of Well B. The green dots represent drill stem test pressure data (DST). c Overview of Well C. d Overview of Well D. Pressure cavings are annotated in purple
Well A is located to the northwest of the Geretsried GEN-1 well (c.f. Fig. 4). The top of the Upper Jurassic is at ~ 2600 m. Upper Cretaceous is missing (c.f. Fig. 7). Well A generally shows no signs of overpressure and has been drilled with a maximum drilling mud weight of 1.1 g/cm3 (Fig. 8a). Only at the transition between Rupelian and Schoeneck Formation velocity data indicates maximum pore pressures of 1.09 g/cm3 EMW at 2554 m (Fig. 8a).
Well B is located to the west of the Geretsried GEN-1 well (c.f. Fig. 4). Velocity data indicate an overpressured zone is present between 3500 m (top Rupelian) and 4100 m (base Schoeneck Formation) with a maximum of 1.65 g/cm3 EMW at 4035 m (Fig. 8b). This is also supported by a drill stem test, drilling mud weights of 1.62 g/cm3 and high gas readings in the section that drilled through the overpressured zone (Fig. 8b). However, the shut-in pressures of the DSTs have not been corrected to full build up and therefore only provide minimum pore pressures. A shallower top of overpressure at ~ 3200 m, where velocity data indicates very mild overpressure is also possible (Fig. 8b). Below the Schoeneck Formation, pore pressures are quickly receding to normal pressures < 1.2 g/cm3 (Fig. 8b).
Well C is located to the east of the Geretsried GEN-1 well (c.f. Fig. 4). Drilling mud weights, shale sonic log data and gas readings indicate a top of mild overpressure at the top of the Chattian increasing to very high overpressure at the base Rupelian and within the Schoeneck Formation (Fig. 8c). Maximum shale pore pressures based on velocity data reach 1.89 g/cm3 EMW at 4278 m (Fig. 8c). The well just tapped the Upper Cretaceous, but velocities are indicating mild to medium overpressure (~ 1.3–1.4 g/cm3) might be present (Fig. 8c).
Well D is located to the northeast of the Geretsried GEN-1 well (c.f. Fig. 4). Drilling mud weights, high gas, pressure cavings and VSP velocities suggest an overpressured zone between the top of the Rupelian and base of the Schoeneck Formation (maximum pore pressure of 1.76 g/cm3 EMW at 3633 m, Fig. 8d). Velocity data indicates hydrostatic pressure conditions in the Upper Cretaceous (Fig. 8d).
Compaction and permeability relationships of Quaternary, Upper Freshwater Molasse (OSM), Burdigalian, Aquitanian, Eocene, Lower Cretaceous and Jurassic layers have not been altered for the pore pressure calibration procedure. The Quaternary has been modeled as permeable siliciclastic sandstone (typical sandstone after Hantschel and Kauerauf 2009; c.f. Fig. 5). OSM, Burdigalian and Aquitanian are represented by a clay-rich sandstone [after Hantschel and Kauerauf (2009); c.f. Fig. 5] and Lower Cretaceous and Upper Jurassic have been modeled as a nearly uncompressible limestone (ooid grainstone after Hantschel and Kauerauf 2009; c.f. Fig. 5) to mimic the comparably high permeability present in these carbonates even at depths > 4000 m (Przybycin et al. 2017). The Eocene Lithothamnium Limestone has been modeled with chalk properties (typical chalk after Hantschel and Kauerauf 2009; c.f. Fig. 5) to represent a fast compacting limestone. Relationships defining compaction and permeability of the shale-rich units (Chattian, Rupelian, Schoeneck Formation and Upper Cretaceous) have been varied using the permeability–porosity relationship of Yang and Aplin (2010) with clay contents between 50 and 90% (c.f. Fig. 5). In order to also account for possibly lower permeabilities the 2-phase permeability correction of Busch and Amann-Hildenbrand (2013) has been applied to the relationship of Yang and Aplin (2010) with clay contents between 50% and 90% (c.f. Eq. 2 and Fig. 5).
From litho-stratigraphic analysis (Kuhlemann and Kempf 2002) and known overpressure magnitudes (Drews et al. 2018) it follows that the Rupelian, Schoeneck Formation and Upper Cretaceous must comprise higher clay and/or organic content and therefore lower permeabilities than the shales of the Chattian. Sachsenhofer et al. (2018) report maximum total organic carbon contents in excess of 10% (average 5.5%) for the shales of the Schoeneck Formation in the Austrian part of the North Alpine Foreland Basin. From cutting descriptions, available in the geological well reports, also follows that the Chattian generally comprises less clay-rich units than the Rupelian, and therefore has probably higher permeability. Incorporating these relationships by the following rule allows for significant reduction of possible permeability model combinations:
where KCh, KRu, KSch, KUC are the permeabilities at a given depth of the shales of the Chattian, Rupelian, Schoeneck Formation and Upper Cretaceous, respectively. The resulting models are then tested against the deviation from the maximum recorded pore pressure gradients in EMW at the calibration wells A–D. Hereby, ± 70 m of depth variation are allowed, which corresponds to the maximum vertical geometry error of the basin model. Also, we define ± 0.15 g/cm3 as an acceptable range of pore pressure deviation in terms of equivalent mud weight (EMW), which matches the uncertainty range of velocity-based pore pressure estimates (Drews et al. 2018) and still allows for quick well control intervention in case of drilling problems. In addition, we add the deviation of the maximum modeled pore pressure from the maximum measured/estimated pore pressure, independent of depth, as a criterion (Table 2).
Testing equal permeability models for all four varied layers indicates, that the permeability structure has to vary: using the permeability model of Yang and Aplin (2010) with clay contents of 50%, 70% and 90% for all four layers either results in pore pressures that are generally too low (50% and 70%) or result in a mismatch, with too high pore pressure in the Chattian and too low pore pressures in the Rupelian and Schoeneck Formation (models C1–3; Table 2). Therefore, permeabilities of the Rupelian and Chattian have been tested next, with the Schoeneck Formation and Upper Cretaceous set to the lowest permeabilities (90% clay content, corrected for 2-phase permeability).
From application of the models yielding the lowest permeabilities, 2-phase model after Busch and Amann-Hildenbrand (2013) applied to 90% clay content model of Yang and Aplin (2010), to the Schoeneck Formation and Upper Cretaceous, quickly follows, that too much overpressure builds up within the Chattian layer at Well A, if a clay content of ≥ 70% is applied to the Chattian permeability model (models C24–26; Table 2). Vice versa, sufficient overpressure in the Rupelian and Schoeneck Formation only builds up if a clay content of ≥ 90% or 2-phase permeability-corrected model with 70% clay content is applied to the permeability of the Rupelian layer (models C14, C15, C17–19, C21–23; Table 2). Also, very low permeabilities as provided by the model based on 90% clay content for the relationship of Yang and Aplin (2010) corrected by the 2-phase model of Busch and Amann-Hildenbrand (2013) have to be applied to either the Schoeneck Formation or Upper Cretaceous to build up overpressure to observed magnitudes at Well B, Well C and Well D. Otherwise, overpressure will be too low at the overpressured well locations (models C10, C13, C16, C20, C24; Table 2). The best fit model (model C19, Table 2 and Fig. 8A–D) is achieved by application of 60% clay content to the permeability model [after Yang and Aplin (2010)] of the Chattian layer and 90% clay content to the permeability models [after Yang and Aplin (2010)] of the Rupelian, Schoeneck Formation and Upper Cretaceous. Thereby, the permeabilities of the Schoeneck Formation and Upper Cretaceous have been further reduced by applying the 2-phase permeability correction (Eq. 2, Busch and Amann-Hildenbrand 2013). Substituting, the permeability of the Rupelian with a 70% clay content porosity–permeability relationship (Yang and Aplin 2010) corrected for 2-phase permeability (Busch and Amann-Hildenbrand 2013) also gives a good fit (model C21, Table 2 and Fig. 8a–d).
Impact of permeability of the Schoeneck Formation and the Eocene
The best fit model (model C19, Table 2) has been used to test the impact of the permeability of the Schoeneck Formation. First, the permeability model of the Schoeneck Formation has been replaced with 50% clay content applied to the porosity–permeability relationship of Yang and Aplin (2010). Second, the compaction and permeability model of the Schoeneck Formation has been replaced with the limestone model applied to the Upper Jurassic and Lower Cretaceous [ooid grain stone; c.f. Hantschel and Kauerauf (2009)], yielding very high and almost constant permeabilities (c.f. Fig. 5). While the impact is very low and still yields simulated pore pressures within acceptable ranges at all four calibration wells in the first case (model Sch1, Table 2), the high permeability limestone case results in too low pore pressures at all overpressured wells (model Sch2, Table 2 and Fig. 8a–d). This is likely due to bypassing the shales of the Upper Cretaceous: the Schoeneck Formation is almost present in the entire northwest of the AOI, but the Upper Cretaceous is missing, which might allow fluid migration along a hypothetical high permeability Schoeneck Formation from the overpressured Rupelian to the normally pressured Upper Jurassic. Although this effect is not realistic for the Schoeneck Formation, it might be a mechanism, which is eventually associated with the Eocene Lithothamnium Limestone.
The permeability of the Eocene Lithothamnium Limestone has been modeled with a fast compacting limestone, yielding permeabilities in the order of 1–100 * 10−21 m2 (c.f. Fig. 5), which are comparable to typical shale permeabilities (c.f. Yang and Aplin 2010). However, the flow properties of the Lithothamnium Limestone are highly uncertain, and higher permeabilities are also possible. Therefore, an additional model with the setup of the best fit model (model C19, Table 2), but with a permeable and incompressible Eocene layer has been run (model Eo1, Table 2). The Eocene has been set to the same lithology model as the Lower Cretaceous and Jurassic in this study [ooid grainstone, c.f. Hantschel and Kauerauf (2009)]. The resulting pore pressures yield significant lower pore pressures at all overpressured well locations and throughout the model domain (model Eo1, Table 2 and Fig. 8a–d). This might be due to two factors:
-
1.
The higher permeability reduces the overall effective permeability, and thus sealing capacity, of the package between hydrostatic Lower Cretaceous and overpressured Rupelian
-
2.
The Eocene extends further to the northwest than Upper Cretaceous shales, and, if permeable, has the potential of acting as lateral drainage system between overpressured Oligocene and (sub-)hydrostatically pressured Lower Cretaceous and Upper Jurassic carbonates (Fig. 9).
Fig. 9 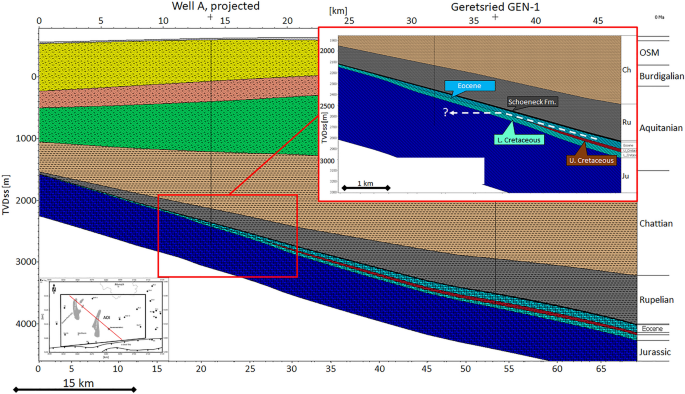
Cross-section showing the possible drainage function of a permeable Eocene formation

A higher permeability than modeled in the best fit model (model C19, Table 2) also requires even lower permeabilities or a secondary overpressure generation mechanism to be present in the Schoeneck Formation to build up observed overpressures. Since permeabilities below 10−25 m2 appear to be unrealistic, a secondary overpressure generation mechanism, such as fluid expansion due to hydrocarbon generation and/or clay diagenesis, seems to be more likely.
Impact of permeability and spatial distribution of the Upper Cretaceous
Similar to the Schoeneck Formation and Eocene, the impact of the permeability of Upper Cretaceous shales has been tested: substitution of the Upper Cretaceous with 50% clay content applied to the porosity–permeability relationship of Yang and Aplin (2010) in a first model (model LC1, Table 2) and replacement of the compaction and permeability model of the Upper Cretaceous with the limestone model applied to the Upper Jurassic and Lower Cretaceous [ooid grain stone; c.f. Hantschel and Kauerauf (2009)], again yielding very high and almost constant permeabilities, in a second model (model LC2, Table 2).
Both models yield too low pore pressures at Well C and Well D (models LC1 and LC2, Table 2), suggesting that the presence of low permeability shales in the Upper Cretaceous is important to maintain overpressure at high magnitudes in the Rupelian and Schoeneck Formation (c.f. Drews et al. 2018). A third model (model LC3; Table 2), where presence of low permeability Upper Cretaceous shales is mimicked by substituting the high permeability limestone model of the Lower Cretaceous by the low permeability model of the Upper Cretaceous has also been run to further validate the impact of the Upper Cretaceous on overpressure maintenance. In contrast to the Upper Cretaceous, Lower Cretaceous is present in the entire AOI (c.f. Fig. 7). The resulting pore pressure distribution shows significant overpressure (> 1.8 g/cm3) would also build up at Well A (model LC3; Table 2 and Fig. 8a), if Upper Cretaceous shales were present in the northwest of the study area, while simulated pore pressures are still in acceptable ranges at all other calibration well locations (model LC3; Table 2 and Fig. 8c, d).
Pore pressure predictability: blind test at the Geretsried GEN-1 well location
The 1D extraction from the best fit basin model (model C19, Table 2) at the Geretsried GEN-1 well location has been compared to the drilling history and a VSP-based pore pressure estimate. Figure 10 shows the pore pressure data in EMW (Fig. 10a), total gas readings (Fig. 10b), simplified lithological profile (Fig. 10c) and the VSP data of the Geretsried GEN-1 well (Fig. 10d). The 1D extraction from the best fit basin model matches maximum pore pressure magnitudes in EMW within the overpressured sections of the Chattian, Rupelian and Schoeneck Formation (Fig. 10a–d). A similar prediction prior to drilling would have likely avoided the severe kick at 3285 m and other drilling problems in the high pressure zone between 3250 and 4200 m.

Pore pressure overview of the Geretsried GEN-1 well. a Pore pressure gradient estimate. TVD, true vertical depth; EMW, equivalent mud weight; PPvsp, pore pressure from vertical seismic profile (dark blue dotted line); C19, pore pressure from best fit 3D basin model (dark blue dashed line); Hyd, hydrostatic/normal pressure (dashed light-blue line); MW, drilling mud weight (brown line); Kicks/Influx, pore pressure estimates from influxes (red dots); PPBSB, water pore pressure gradient (dotted light-blue line) tied to the kick pressure in the Baustein Beds at 3285 m; σv, vertical stress (black line). b Total gas readings while drilling on a logarithmic scale in percent (red line and red dots) and casing points (black triangles). c Simplified lithological column. d Interval velocities from vertical seismic profile (blue line) and normal compaction trend to estimate pore pressure (black dashed line)
Within the Chattian some elevated gas readings suggest slight underbalanced drilling and accordingly, the basin model predicts mild overpressure (Fig. 10a). Nevertheless, the variable VSP data (Fig. 10d) shows that the Chattian is fairly heterogeneous. Such small-scale vertical facies variations are not captured by the basin model.
The basin model fails to match the severe water kick at 3285 m in the Baustein Beds, which is neither met by the VSP data-based pore pressure estimate (Fig. 10a, d). This could be due to the large thickness of the sands of the Baustein Beds—the velocity-based pore pressure estimation only functions in shales. Assuming a hydrostatic pressure gradient tied to the water kick pressure of 1.78 g/cm3 in EMW then demonstrates, that shale pressures can indeed be lower below the Baustein Beds, while still belonging to the same pressure regime (Fig. 10a). Still, the velocity-based pore pressure profile in the Rupelian at the Geretsried GEN-1 well location is different than the profiles of the calibration wells Well B, Well C and Well D: Instead of a pore pressure maximum at the transition between Rupelian and Schoeneck Formation (c.f. Fig. 8b–d), pore pressure in EMW appears to decline within the Rupelian based on VSP data. One explanation might be a different mineralogical composition of the Rupelian shales in the Geretsried area, leading to a faster velocity signal (e.g., by increased carbonate content, lower clay content and higher contents of coarser grained material or advanced smectite to illite transformation). A second explanation can be given by vertical pressure transfer within the thick Baustein Beds, or even through lateral pressure transfer in the Baustein Beds or a nearby fault zone in the Chattian/Rupelian transition, which indeed has been indicated by the mud log. Pressure transfer would also explain the sudden pressure increase in the Baustein Beds. A water gradient shifted to the overpressure of the Baustein Beds supports this hypothesis, since it extends to the estimated and lower shale pressures in the upper Rupelian (PPBSB, Fig. 10a). A third alternative scenario could be given by an early onset of the pressure regression towards the hydrostatically pressured Upper Jurassic. The variability of the VSP within the Rupelian suggests lithological heterogeneity, which would be supportive of the latter scenario, since even small-scale heterogeneities in shales can significantly increase effective permeabilities (c.f. Drews et al. 2013). As a fourth scenario, the VSP data-based pressure regression could also be an effect of increased lateral stresses, which would result in underestimation of pore pressure by velocity-based methods, when assuming vertical effective stress as a good proxy for compaction and mean stress (Couzens-Schultz and Azbel 2014; Drews and Stollhofen 2019; Obradors-Prats et al. 2017). However, the Geretsried GEN-1 well is at a similar distance to the North Alpine Thrust Front as Well B and Well C (c.f. Fig. 4). It should be noted, that all four scenarios do not contradict each other and a combination is also possible.
In the Upper Cretaceous, pressures are finally decreasing to the slightly above hydrostatic conditions in the carbonates of the Lower Cretaceous and Jurassic. This decline is also represented in the 1D extraction of the base case basin model (Fig. 10a). The VSP data acquisition stopped in the Eocene and does not extend into the Cretaceous and deeper (Fig. 10d).
Secondary overpressure mechanisms
Since the here used basin model only incorporates fluid flow and mechanical compaction and associated permeability reduction, it can be deduced, that, on a sub-regional to regional scale, overpressure in the study area and likely the entire North Alpine Foreland Basin in SE Germany can be sufficiently simulated and explained with disequilibrium compaction as overpressure generation mechanism. First order estimates of sedimentation rates (thickness divided by age interval) in excess of 400 m/Ma at overpressured locations (Well B, Well C, Well D) vs. lower rates (~ 200 m/Ma) at normally pressured locations (Well A) support this hypothesis (c.f. Fig. 7). These sedimentation rates are higher than previously reported sedimentation for the North Alpine Foreland Basin (Allen and Allen 2013; Zweigel 1998). However, it has to be noted, that litho-stratigraphic units with very low permeability units are required—in some cases less than 10−23 m2. Although such low permeabilities have been measured and observed before (Busch and Amann-Hildenbrand 2013; Hildenbrand et al. 2002; Kwon et al. 2001; Lee and Deming 2002; Luffel et al. 1993; Yang and Aplin 2007, 2010), the presence of secondary overpressure mechanisms offers a more plausible explanation. Especially, for the Schoeneck Formation, which is rich in organic matter (Bachmann et al. 1987; Sachsenhofer et al. 2018) and within the oil window in most parts of the study area, fluid expansion due to hydrocarbon generation would be a good candidate as an additional source of overpressure. This might even be enhanced by capillary sealing of the pores against the water phase due to primary hydrocarbon migration, which has been partly covered in this study using the 2-phase permeability reduction model of Busch and Amann-Hildenbrand (2013). In addition, clay diagenesis might be another secondary overpressure generation mechanism. Onset of clay diagenesis has been previously reported around 2000–2500 m TVD in the Austrian Part of the North Alpine Foreland Basin and Vienna Basin (Gier 1998, 2000; Gier et al. 2018). Moreover, the role of lateral stresses is not resolved, yet. The study area is only a few kilometers away from the first thrust front of the Eastern Alps and might therefore be influenced by increased lateral stresses, which would influence velocity-based and basin modeling-based pore pressure estimates (Gao et al. 2018; Obradors-Prats et al. 2016, 2017). Also, lateral pressure transfer (Lupa et al. 2002; Yardley and Swarbrick 2000) could be a mechanism yielding either additional overpressure or even pressure regressions. However, significant lateral continuity of permeable units are still to be proven in the Cenozoic basin fill of the North Alpine Foreland Basin in SE Germany, since the current understanding assumes more isolated lenticular sand bodies (Müller and Nieberding 1996). In summary, the true impact of secondary overpressure generation mechanisms still has to be investigated and cannot be fully resolved by this study.
Facies distribution and fault zones
The basin model used in this study does neither incorporate lateral nor vertical facies variations in individual layers, representing stratigraphic units. Although a general change from more terrestrial deposits in the WNW towards a pure marine setting in the ESE of the North Alpine Foreland Basin in SE Germany has been described for the Chattian and Rupelian (Kuhlemann and Kempf 2002), significant changes of depositional environment of the Chattian, Rupelian, and Schoeneck Formation within the study area have not been reported by respective studies (Kuhlemann and Kempf 2002). However, lateral and vertical facies variations within the Rupelian appear to impact overpressure estimation from velocity data and simulation using basin modeling. Careful mapping and incorporation of facies variations within the Rupelian might therefore increase the accuracy of pore pressure predictions in the studied part of the North Alpine Foreland Basin in SE Germany. Also, local sub-aquatic erosion of the Schoeneck Formation, as reported for the Austrian part of the North Alpine Foreland Basin (Sachsenhofer and Schulz 2006), might impact local pore pressure magnitudes and could also be an explanation for the different pressure profile at the Geretsried GEN-1 well location.
The 3D basin model applied in this study does not consider any structural elements, which are abundantly present as normal faults in the entire North Alpine Foreland Basin in SE Germany. However, most of these normal faults only comprise throws on the order of 10–100 m (c.f. von Hartmann et al. 2016). Pore pressure perturbations due to hydrocarbon accumulation against these faults would therefore be very small and well within the range of uncertainty defined in this study (± 0.15 g/cm3). Otherwise, faults generating local pressure compartments in the Upper Jurassic carbonates might have an impact on overpressure preservation, if these faults prevented the Jurassic from hydraulic drainage.
Conclusions
Drilling data and velocity-based pore pressure analyses have been combined with 3D basin modeling to test the predictability and controlling factors of overpressure in the area of the Geretsried GEN-1 deep geothermal well, located in the North Alpine Foreland Basin in SE Germany. Thereby, the following concluding remarks can be drawn:
-
High overpressure is present within the sediments of the Rupelian and Schoeneck Formation at the Geretsried GEN-1 well location and to the west, south and east of it. However, unusually high pressures are present in the Baustein Beds at the Geretsried GEN-1 well location, which might be explained through vertical pressure transfer.
-
Mild overpressure is present in sediments of the Chattian and Upper Cretaceous at the Geretsried GEN-1 well location and to the east of it.
-
Disequilibrium compaction is likely the primary source of overpressure. This is supported by 3D basin modeling, high sedimentation rates and presence of thick shales at overpressured locations. However, very low permeabilities are required if disequilibrium compaction was the sole mechanism. Thus, secondary mechanisms are likely contributing. In particular, in the organic-rich Schoeneck Formation fluid expansion could be a viable mechanism.
-
Presence of Upper Cretaceous shales are controlling overpressure maintenance. In the northwestern part, where Upper Cretaceous shales are not present, overpressure cannot be maintained against the hydraulic pull of the hydrostatically pressured Upper Jurassic carbonates. Otherwise, significant overpressure magnitudes would have built up also in this part of the North Alpine Foreland Basin.
-
The 3D basin modeling calibrated to drilling data and velocity-based pore pressure estimates at surrounding wells provides a viable tool to predict pore pressure pre-drill in the North Alpine Foreland Basin, which has been demonstrated with a blind test at the Geretsried GEN-1 well location. Knowledge of pore pressure presence and magnitudes pre-drill is key to design the drilling mud weight program and select appropriate casing points and to ensure safe and economic drilling. However, pre-drill pore pressure prediction could be further improved by incorporating lateral and vertical facies distributions and mapping of permeable units using 3D seismic data.
Availability of data and materials
The data that support the findings of this study are available from Leibniz Institute for Applied Geophysics (LIAG), Enex Power Germany GmbH, ENGIE Deutschland AG, ExxonMobil Production Deutschland GmbH and Wintershall Dea Deutschland GmbH, but restrictions apply to the availability of these data, which were used under license for the current study, and so are not publicly available. Data are, however, available from the authors upon reasonable request and with permission of Leibniz Institute for Applied Geophysics (LIAG), Enex Power Germany GmbH, ENGIE Deutschland AG, ExxonMobil Production Deutschland GmbH and Wintershall Dea Deutschland GmbH.
References
Allen PA, Allen JR. Basin analysis: principles and application to petroleum play assessment. 3rd ed. Hoboken: Wiley-Blackwell; 2013.
Athy LF. Density, porosity and compaction of sedimentary rocks. AAPG Bull. 1930;14:1–24.
Bachmann GH, Müller M, Weggen K. Evolution of the molasse basin (Germany, Switzerland). Tectonophysics. 1987;137(1–4):77–92. https://doi.org/10.1016/0040-1951(87)90315-5.
Bello L. Borehole seismic processing report of the GEN-1 well. Technical Report. DMT GmbH; 2016.
Bjørlykke K, Jahren J, Aagaard P, Fisher Q. Role of effective permeability distribution in estimating overpressure using basin modelling. Mar Pet Geol. 2010;27(8):1684–91. https://doi.org/10.1016/j.marpetgeo.2010.05.003.
Bowers GL. Pore pressure estimation from velocity data: accounting for overpressure mechanisms besides undercompaction. SPE Drill Complet. 1995;10(2):89–95.
Busch A, Amann-Hildenbrand A. Predicting capillarity of mudrocks. Mar Pet Geol. 2013;45:208–23. https://doi.org/10.1016/j.marpetgeo.2013.05.005.
Cohen KM, Finney SC, Gibbard PL, Fan J-X. The ICS international chronostratigraphic chart. Episodes. 2013;36:199–204.
Couzens-Schultz BA, Azbel K. Predicting pore pressure in active fold-thrust systems: an empirical model for the deepwater Sabah foldbelt. J Struct Geol. 2014;69(1):465–80. https://doi.org/10.1016/j.jsg.2014.07.013.
Darby D, Haszeldine RS, Couples GD. Central North Sea overpressures: insights into fluid flow from one- and two-dimensional basin modelling. Geol Soc Spec Pub. 1998. https://doi.org/10.1144/GSL.SP.1998.141.01.06.
Drews M, Stollhofen H. PPFG prediction in complex tectonic settings: the North Alpine thrust front and foreland basin, SE Germany. In: Paper presented at the second EAGE workshop on pore pressure prediction amsterdam, 19 May 2019; 2019.
Drews M, Kurtev K, Ma J, Boeker U, Boeker U, Aplin A. Influence of shale and mudstone heterogeneity on permeability-driven fluid flow—sample to geophysical well log scale. In: 75th European association of geoscientists and engineers conference and exhibition 2013 incorporating SPE EUROPEC 2013: changing frontiers; 2013. p. 5213–17.
Drews MC, Bauer W, Caracciolo L, Stollhofen H. Disequilibrium compaction overpressure in shales of the Bavarian Foreland Molasse Basin: results and geographical distribution from velocity-based analyses. Mar Pet Geol. 2018;92:37–50.
Drews MC, Seithel R, Savvatis A, Kohl T, Stollhofen H. A normal-faulting stress regime in the Bavarian Foreland Molasse Basin? New evidence from detailed analysis of leak-off and formation integrity tests in the greater Munich area, SE-Germany. Tectonophysics. 2019;755:1–9. https://doi.org/10.1016/j.tecto.2019.02.011.
Eaton BA. The effect of overburden stress on geopressure prediction from well logs. J Petrol Technol. 1972;24:929–34. https://doi.org/10.2118/3719-PA.
Eaton BA. The equation for geopressure prediction from well logs. In: Paper presented at the fall meeting of the SPE of American Institute of Mining, metallurgical, and petroleum engineers, Dallas, Texas, September 28–October 1; 1975.
Gao B, Flemings PB, Nikolinakou MA, Saffer DM, Heidari M. Mechanics of fold-and-thrust belts based on geomechanical modeling. J Geophys Res Solid Earth. 2018;123(5):4454–74. https://doi.org/10.1029/2018JB015434.
Gardner GHF, Gardner LW, Gregory AR. Formation velocity and density—the diagnostic basics for stratigraphic traps. Geophysics. 1974;39(6):770–80.
Gier S. Burial diagenetic processes and clay mineral formation in the Molasse zone of Upper Austria. Clays Clay Miner. 1998;46(6):658–69. https://doi.org/10.1346/CCMN.1998.0460606.
Gier S. Clay mineral and organic diagenesis of the Lower Oligocene Schoneck Fishshale, western Austrian Molasse Basin. Clay Miner. 2000;35(4):709–17. https://doi.org/10.1180/000985500547151.
Gier S, Worden RH, Krois P. Comparing clay mineral diagenesis in interbedded sandstones and mudstones, Vienna Basin, Austria. Geol Soc Special Publ. 2018. https://doi.org/10.1144/SP435.9.
Greiner G, Lohr J. Tectonic stresses in the Northern Foreland of the Alpine system measurements and interpretation. In: Scheidegger AE, editor. Tectonic stresses in the alpine-mediterranean region rock mechanics/Felsmechanik/Mécanique des Roches, vol. 9. Vienna: Springer; 1980. p. 5–15.
Gusterhuber J, Hinsch R, Sachsenhofer RF. Evaluation of hydrocarbon generation and migration in the Molasse fold and thrust belt (Central Eastern Alps, Austria) using structural and thermal basin models. AAPG Bull. 2014;98(2):253–77. https://doi.org/10.1306/06061312206.
Hantschel T, Kauerauf A. Fundamentals of basin and petroleum systems modeling. Berlin: Springer; 2009.
Heppard PD, Cander HS, Eggertson EB. Abnormal pressure and the occurrence of hydrocarbons in offshore eastern Trinidad, West Indies. AAPG Memoir. 1998;70:215–46.
Hildenbrand A, Schlömer S, Krooss BM. Gas breakthrough experiments on fine-grained sedimentary rocks. Geofluids. 2002;2:3–23.
Hubbert MK, Rubey WW. Role of fluid pressure in mechanics of overthrust faulting. Bull Geol Soc Am. 1959;70:115–66.
Issler DR. A new approach to shale compaction and stratigraphic restoration, Beaufort-Mackenzie Basin and Mackenzie Corridor, northern Canada. AAPG Bull. 1992;76(8):1170–89.
Janssen R, Doppler G, Grimm K, Grimm M, Haas U, Hiss M, Köthe A, Radtke G, Reichenbacher B, Salamon M, Standke G, Teipel U, Thomas M, Uffenorde H, Wielandt-Schuster U. The tertiary in the stratigraphic table of Germany 2016 (STG 2016). Z Dt Ges Geowiss (German J Geol). 2018;169(2):267–94.
Karlsen DA, Skeie JE. Petroleum migration, faults and overpressure, part I: calibrating basin modelling using petroleum in traps—a review. J Pet Geol. 2006;29(3):227–56. https://doi.org/10.1111/j.1747-5457.2006.00227.x.
Kuhlemann J, Kempf O. Post-eocene evolution of the North Alpine Foreland Basin and its response to Alpine tectonics. Sed Geol. 2002;152(1–2):45–78. https://doi.org/10.1016/S0037-0738(01)00285-8.
Kwon O, Kronenberg AK, Gangi AF, Johnson B. Permeability of Wilcox shale and its effective pressure law. J Geophys Res Solid Earth. 2001;106(B9):19339–53.
Lackner D, Lentsch D, Dorsch K Germany`s deepest hydro-geothermal doublet, drilling challenges and conclusions for the design of future wells. In: Transactions—Geothermal Resources Council; 2018. p. 349–59.
Lee Y, Deming D. Overpressures in the Anadarko basin, southwestern Oklahoma: static or dynamic? AAPG Bull. 2002;86(1):145–60.
Lemcke K. Übertiefe Grundwässer im süddeutschen Alpenvorland. Bulletin der Vereinigung Schweiz Petroleum-Geologen und -Ingenieure. 1976;42(103):9–18.
Lohr J. Alpine stress documented by anomalous seismic velocities in the Molasse trough. Inter-Union Com On Geodynamics, Sc Rep. 1978;38:69–71.
Luffel DL, Hopkins CW, Schettler Jr PD Matrix permeability measurement of gas productive shales. In: Proceedings—SPE annual technical conference and exhibition; 1993. p. 261–70.
Lupa J, Flemings P, Tennant S. Pressure and trap integrity in the deepwater Gulf of Mexico. Lead Edge. 2002;21(2):184–7. https://doi.org/10.1190/1.1452610.
Megies T, Wassermann J. Microseismicity observed at a non-pressure-stimulated geothermal power plant. Geothermics. 2014;52:36–49. https://doi.org/10.1016/j.geothermics.2014.01.002.
Mosca F, Djordjevic O, Hantschel T, McCarthy J, Krueger A, Phelps D, Akintokunbo T, Joppen T, Koster K, Schupbach M, Hampshire K, MacGregor A. Pore pressure prediction while drilling: three-dimensional earth model in the Gulf of Mexico. AAPG Bull. 2018;102(4):545–7. https://doi.org/10.1306/0605171619617050.
Mouchet J-P, Mitchell A. Abnormal pressures while drilling: Origins, predictions, detection evaluation. Paris: Editions Technip; 1989.
Mudford BS, Gradstein FM, Katsube TJ, Best ME. Modelling 1D compaction-driven flow in sedimentary basins: a comparison of the Scotian Shelf, North Sea and Gulf Coast. Geol Soc Spec Pub. 1991. https://doi.org/10.1144/GSL.SP.1991.059.01.05.
Müller M, Nieberding F. Principles of abnormal pressures related to tectonic developments and their implication for drilling activities (Bavarian Alps, Germany). In: Wessely G, Liebl W, editors. Oil and gas in Alpidic Thrusbelts and Basins of Central and Eastern Europe, vol. 5. London: EAGE Spec. Pub.; 1996. p. 119–26.
Müller M, Nieberding F, Wanninger A. Tectonic style and pressure distribution at the northern margin of the Alps between Lake Constance and the River Inn. Geol Rundsch. 1988;77(3):787–96.
Obradors-Prats J, Rouainia M, Aplin AC, Crook AJL. Stresses, porosity and overpressure modelling in tectonic regimes. In: 5th EAGE Shale workshop: quantifying risks and potential; 2016. p. 104–8.
Obradors-Prats J, Rouainia M, Aplin AC, Crook AJL. Hydromechanical modeling of stress, pore pressure, and porosity evolution in fold-and-thrust belt systems. J Geophys Res Solid Earth. 2017;122(11):9383–403. https://doi.org/10.1002/2017JB014074.
Osborne MJ, Swarbrick RE. Mechanisms for generating overpressure in sedimentary basins: a reevaluation. AAPG Bull. 1997;81(6):1023–41.
Peters KE, Schenk O, Hosford Schelrer A, Wygrala BP, Hantschel T. Basin and petroleum systems modeling. In: Hsu CS, Robinsom PR, editors. Springer handbook of petroleum technology. 2nd ed. New York: Springer International Publishing; 2017. p. 1238. https://doi.org/10.1007/978-3-319-49347-3.
Przybycin AM, Scheck-Wenderoth M, Schneider M. The origin of deep geothermal anomalies in the German Molasse Basin: results from 3D numerical models of coupled fluid flow and heat transport. Geotherm Energy. 2017. https://doi.org/10.1186/s40517-016-0059-3.
Raiga-Clemenceau J, Martin JP, Nicoletis S. The concept of acoustic formation factor for more accurate porosity determination from sonic transit time data. Log Analyst. 1988;29(1):54–60.
Reinecker J, Tingay M, Müller B, Heidbach O. Present-day stress orientation in the Molasse Basin. Tectonophysics. 2010;482(1–4):129–38. https://doi.org/10.1016/j.tecto.2009.07.021.
Rizzi PW. Hochdruckzonenfrüherkennung in Mitteleuropa. Erdoel-Erdgas-Zeitschrift. 1973;89:249–56.
Sachsenhofer RF, Schulz H-M. Architecture of Lower Oligocene source rocks in the Alpine Foreland Basin: a model for syn- and postdepositional source rock features in the Paratethyan Realm. Petrol Geosci. 2006;12:363–77.
Sachsenhofer RF, Popov SV, Bechtel A, Coric S, Francu J, Gratzer R, Grunert P, Kotarba M, Mayer J, Pupp M, Rupprecht BJ, Vincent SJ. Oligocene and lower miocene source rocks in the paratethys: palaeogeographical and stratigraphic controls. Geol Soc Spec Pub. 2018. https://doi.org/10.1144/SP464.1.
Sargent C, Goulty NR, Cicchino AMP, Ramdhan AM. Budge-fudge method of pore-pressure estimation from wireline logs with application to cretaceous mudstones at haltenbanken. Petrol Geosci. 2015;21(4):219–32. https://doi.org/10.1144/petgeo2014-088.
Satti IA, Ghosh D, Yusoff WIW. 3D predrill pore pressure prediction using basin modeling approach in a field of Malay Basin. Asian J Earth Sci. 2015;8(1):24–31. https://doi.org/10.3923/ajes.2015.24.31.
Scott DR, Thomsen LA. A global algorithm for pore pressure prediction. In: 8th SPE Middle East oil show and conference, Manama, Bahrain, April 3–6; 1993. p. 645–54.
Seithel R, Steiner U, Müller B, Hecht C, Kohl T. Local stress anomaly in the Bavarian Molasse Basin. Geotherm Energy. 2015. https://doi.org/10.1186/s40517-014-0023-z.
Seithel R, Gaucher E, Mueller B, Steiner U, Kohl T. Probability of fault reactivation in the Bavarian Molasse Basin. Geothermics. 2019;82:81–90. https://doi.org/10.1016/j.geothermics.2019.06.004.
Stober I, Bucher K. Geothermal energy: from theoretical models to exploration and development, vol 9783642133527. Geothermal energy: from theoretical models to exploration and development; 2013. https://doi.org/10.1007/978-3-642-13352-7.
Swarbrick RE, Osborne MJ. Mechanisms that generate abnormal pressures: an overview. AAPG Memoir. 1998;70:13–34.
von Hartmann H, Tanner DC, Schumacher S. Initiation and development of normal faults within the German alpine foreland basin: the inconspicuous role of basement structures. Tectonics. 2016;35(6):1560–74. https://doi.org/10.1002/2016TC004176.
Yang Y, Aplin AC. Permeability and petrophysical properties of 30 natural mudstones. J Geophys Res Solid Earth. 2007. https://doi.org/10.1029/2005jb004243.
Yang Y, Aplin AC. A permeability-porosity relationship for mudstones. Mar Pet Geol. 2010;27(8):1692–7. https://doi.org/10.1016/j.marpetgeo.2009.07.001.
Yardley GS, Swarbrick RE. Lateral transfer: a source of additional overpressure? Mar Pet Geol. 2000;17(4):523–37. https://doi.org/10.1016/S0264-8172(00)00007-6.
Ziegler MO, Heidbach O, Reinecker J, Przybycin AM, Scheck-Wenderoth M. A multi-stage 3-D stress field modelling approach exemplified in the Bavarian Molasse Basin. Solid Earth. 2016;7(5):1365–82. https://doi.org/10.5194/se-7-1365-2016.
Zweigel J. Eustatic versus tectonic control on foreland basin fill: Sequence stratigraphy, subsidence analysis, stratigraphic modelling, and reservoir modelling applied to the German Molasse basin. Contributions to sedimentary geology 20:X-140; 1998.
Acknowledgements
First thanks go to Andreas Gahr and Robert Straubinger (Enex Power Germany GmbH) as well as Leibniz Institute for Applied Geophysics (LIAG) for approval to publish data from the Geretsried GEN-1 well. The authors would also like to thank the data owners of all other wells used in this study ENGIE Deutschland AG, ExxonMobil Production Deutschland GmbH, Wintershall Dea Deutschland GmbH, represented by the Bundesverband Erdgas, Erdöl und Geoenergie e.V. (BVEG). In addition, the authors would like to thank Schlumberger for providing an academic license for the PetroMod© Modelling and Simulation software, Dr. Oliver Schenk for valuable advice in the topic of basin modeling and three anonymous reviewers who have greatly helped to improve the structure of the manuscript.
Funding
This work was funded by the Bavarian State Ministry for Education, Culture, Science and Arts within the framework of the “Geothermal Alliance Bavaria (GAB)” and the German Federal Ministry for Economic Affairs and Energy through the project “Dolomitkluft” (Grant Number 0324004).
Author information
Authors and Affiliations
Contributions
MCD designed the study, conducted the data analysis, interpretation and 3D basin modeling and wrote the manuscript. PH significantly participated in analyzing the well data and in drafting the manuscript. VS contributed to the interpretation and quality control of the VSP data-related results. KZ initiated the study and together with HS participated in the writing process of the manuscript. All authors read and approved the final manuscript.
Corresponding author
Ethics declarations
Ethics and consent to participate
This research does not involve any human subjects, human material, or human data.
Competing interests
The authors declare that they have no competing interests.
Additional information
Publisher's Note
Springer Nature remains neutral with regard to jurisdictional claims in published maps and institutional affiliations.
Rights and permissions
Open Access This article is licensed under a Creative Commons Attribution 4.0 International License, which permits use, sharing, adaptation, distribution and reproduction in any medium or format, as long as you give appropriate credit to the original author(s) and the source, provide a link to the Creative Commons licence, and indicate if changes were made. The images or other third party material in this article are included in the article's Creative Commons licence, unless indicated otherwise in a credit line to the material. If material is not included in the article's Creative Commons licence and your intended use is not permitted by statutory regulation or exceeds the permitted use, you will need to obtain permission directly from the copyright holder. To view a copy of this licence, visit http://creativecommons.org/licenses/by/4.0/.
About this article

Cite this article
Drews, M.C., Hofstetter, P., Zosseder, K. et al. Predictability and controlling factors of overpressure in the North Alpine Foreland Basin, SE Germany: an interdisciplinary post-drill analysis of the Geretsried GEN-1 deep geothermal well. Geotherm Energy 8, 20 (2020). https://doi.org/10.1186/s40517-020-00175-8
Received:
Accepted:
Published:
DOI: https://doi.org/10.1186/s40517-020-00175-8