
Abstract
Background
While several studies show that examinees’ test motivation biases their results in low-stakes tests, studies that investigate the predictors of motivation when taking low-stakes tests are rare. Moreover, little evidence exists on whether test motivation represents a state-like or trait-like construct. Research into these matters needs statistical models that allow distinguishing inter-individual from intra-individual variability of motivation across a range of test situations. The present study is located in a vocational school setting and aims to explain variations in vocational students’ low-stakes test motivation. We draw on Urhahne’s (Psychologische Rundschau 59:150–166, 2008. https://doi.org/10.1026/0033-3042.59.3.150) synthesis of motivation theories in academic learning contexts to substantiate potential predictors. Since we concentrate on person-dependent characteristics, relevant predictors are types of self-determined/external behavioural regulation, achievement motivation, academic self-concept, and grit. In line with Eccles et al. (In: Spence JT (eds) Achievement and achievement motives: psychological and sociological approaches. Freeman, San Francisco, pp 109–132, 1983) and Sundre (The Student Opinion Scale (SOS). A measure of examinee motivation: test manual. https://www.researchgate.net/publication/238741273_The_Student_Opinion_Scale_SOS, 2007), we further discern value attributions to and invested effort in each test as two separate dimensions of test motivation.
Method
Empirical analyses utilize longitudinal questionnaire and test performance data of students (N = 852) from full time vocational schools, who participated repeatedly in a low-stakes accounting test at the end of each school year (5 years in total). Latent singletrait–multistate (STMS) models serve to disentangle trait-like and state-like components of students’ test motivation and their respective associations with trait- and state-components of the assumed predictor variables.
Results
Findings from STMS models indicate that approx. 30% of variation in students’ test motivation is stable over time, whereas approx. 25% is attributable to the test situation, leading to a high portion of 45% residual variance. Bivariate STMS analyses show that students’ achievement motivation and type of behavioural regulation predict the value dimension of their test motivation. This pattern appears for the trait-like components of investigated constructs (here: time-invariant, person-specific levels of predictors and criteria) as well as for the state-like components (here: intra-individual increases or declines in predictors and criteria). Regarding the effort dimension of test motivation, similar associations among the trait-like components appear. Students’ self-reported effort is positively predicted by type of behavioural regulation and achievement motivation. Moreover, and in contrast to the value dimension, students’ perseverance plays a crucial role when predicting test-taking effort. Finally, a multivariate intercept-only growth model was estimated to analyse the relative contributions of different psychological determinants of test motivation. It shows that (a) students’ introjected regulation predicts the value dimension and (b) students’ identified behavioural regulation and perseverance (as an essential aspect of grit) predict the effort dimension of test motivation.
Conclusions
Students’ motivation to master low-stakes tests represents an equally trait- and state-like construct—at least with respect to the investigated test format (paper–pencil), content (accounting) and examinee population (vocational students). Our finding that comparably stable motivational dispositions of students, namely person-specific types of behavioural regulation, achievement motivation, and grit, are highly predictive of their test motivation in multiple test situations implies that test motivation bias can be reduced substantially by controlling for general student motivation (in the relevant academic domain).
Introduction
Research on test motivation has repeatedly shown that test scores vary substantially by students’ motivation to master test situations. Even for intelligence tests, researchers found that test motivation can confound intelligence quotient scores and their statistical associations to outcome variables such as employment (Duckworth et al. 2011). However, motivation-dependent biases are particularly salient in low-stakes tests of students’ domain-specific knowledge and abilities, in which test performance does not yield serious consequences for their academic or vocational careers. Boe et al. (2002) demonstrated that more than 50% of the between-nation variation in math and science scores assessed in TIMSS (Trends in mathematics and science study) could be explained by students’ test-taking effort. This evidence impairs the interpretability of test scores as ‘true’ measures of students’ ability in the investigated subject matter. Today, it is an undisputed fact that test scores result from students’ skill and will (Finn 2015).
To ensure valid measures of students’ domain-specific knowledge and abilities, statistical approaches that control for variations in test motivation receive growing attention from educational researchers. This applies in particular to assessments of the knowledge and abilities that students have acquired in different domains of vocational education and training (e.g., Beck et al. 2016). Nevertheless, a recent literature review by Finn (2015, p 12) documents that “there is not extensive research on the link between personality measures and test-taking effort”. Closely related is a scarcity of studies that focus on the “circumstances under which motivation can be enhanced or diminished” (Finn 2015, p 1) such as test conditions (e.g., incentives) or student characteristics (e.g., persistence or gender). In a similar vein, Duckworth et al. (2011, p 7719) request investigations that “identify the traits that determine effort on low-stakes tests”, thereby considering a more comprehensive set of potential predictors in the form of each examinee’s psychological prerequisites. We follow this call by examining the predictive power of student characteristics for variations in test motivation. To this end, we re-analyse existing data from a longitudinal study on instruction and learning in commercial upper secondary schools (Helm 2016). Given the modest amount of previous studies on this issue, we consider a broader set of student characteristics, simultaneously. This approach is based on a heuristic model that integrates central concepts of established motivation theories in academic learning contexts (Urhahne 2008).
A heuristic model of student characteristics predicting test motivation
The basic expectancy-value model
Extant research usually relates to an expectancy-value model proposed by Eccles et al. (1983) when explaining test motivation. According to this model, motivational strength depends on a student’s expectancies for success and the value that he/she places on a task (Eccles and Wigfield 2002). While expectancies for success are defined as “individuals’ beliefs about how well they will do on upcoming tasks” (Eccles and Wigfield 2002, p 119), task value comprises four facets. These facets entail attainment value (“the personal importance of doing well on the task”), intrinsic value (“the enjoyment the individual gets from performing the activity”), utility value (“how well a task relates to current and future goals”), and cost (“negative aspects of engaging in the task” such as test anxiety, lost opportunities) (Eccles and Wigfield 2002, pp 119–120). Furthermore, the model identifies task-related beliefs such as individual perceptions of abilities and of task difficulty as well as domain-specific self-concept as proximal influencing factors of expectancies and value attributions. Thus far, the seminal work of Eccles and colleagues has inspired test motivation researchers to investigate motivational tendencies and related emotional experiences (such as boredom) as outcomes of an examinee’s cognitive evaluation of task characteristics and task-related ability (Asseburg and Frey 2013).
Widening the scope of potential determinants of test motivation
Urhahne’s (2008) synthesis of established motivation theories in academic contexts delineates additional determinants by describing their functions in a broader view on processes of individual learning activities within these contexts. We use his heuristic model (Fig. 1) to frame the selection of predictors used in the present study. With reference to expectancy-value theories (indicated with a capital A in Fig. 1), Urhahne’s model locates the concept of expectancies for success (A: efficacy expectations) in the relation between the person and the activity that should be performed. In an academic setting, it depicts the person’s belief to do well on a learning task or test. The four facets of task value represent evaluations relating to different elements of action (also indicated with a capital A in the figure). Attainment value links closely to the immediate result of an action in terms of task achievement or failure. Intrinsic value pertains to performing the action itself. Utility value and cost refer to subsequent, long-term consequences of the action.

Action model and key concepts of central motivational learning theories following Urhahne (2008)
However, the model also integrates explaining factors of a person’s motivation to execute a particular task or activity that are put forth by Self-determination theory (B), Achievement motivation theory (C), Attribution and Self-concept theory (D), as well as Volitional, i.e. Action control theory (E). In the following sections, we briefly outline the assumed links between these factors and students’ test motivation.
Self-determination theory—types of behavioural regulation in a given activity domain
Test motivation can be understood as a situational, state-like manifestation of a more trait-like, domain-specific motivation (Crombach et al. 2003; Penk et al. 2014). Self-determination theory posits four different types of self-determined behavioural regulation in a given domain, which reflect a person’s emotional experiences when engaging intentionally in domain-related activities and the perceived causalities of doing so (Deci and Ryan 1985). Table 1 gives a short definition of each of these regulation types, namely, intrinsic, identified, introjected and extrinsic. It further reveals considerable, albeit not complete conceptual overlap between these generic forms of motivated behaviour and the value a person might attribute to performing a specific task in an achievement situation according to Eccles and Wigfield’s (2002) expectancy-value model. In line with Pekrun (1993), we assume that the type of behavioural regulation a person possesses in a particular academic domain (such as accounting) essentially shapes the value facets of motivation when he/she works on specific tasks or test items that belong to this domain.
Achievement motivation—willingness to invest effort
In line with Penk et al. (2014, p 2), we further assume that “students have domain-specific achievement motivation (e.g., motivation to engage in mathematics) and situation-specific achievement motivation (e.g., motivation to work hard in a specific school-based assessment)”. Achievement motivation refers to the aspiration of reaching and maintaining high levels of performance in activity domains where a standard of excellence is considered binding, such as at school (Heckhausen 1965). Individuals who are motivated by achievement seek for situations in which they can compare their abilities with these standards. In these situations, they strive to improve their performance or to be better than others (Urhahne 2008). Measured against such aspirations and personally binding standards of achievement, an individual can succeed or fail in his/her behaviour. Atkinson (1957) differentiates between behaviour that is dominated by the motive of attaining success and behaviour that is dominated by avoiding failure. It therefore can be expected that when a person performs a specific task, the motive for success increases goal-oriented actions, whereas the motive for failure avoidance triggers attempts to evade the performance situation (Urhahne 2008).
Since a low-stakes test situation represents one of manifold possibilities to demonstrate high performance and to do better than others, we assume that students whose academic learning behaviour is dominated by the motive for success will put more effort in the test than students who fear failure. Although Covington and Omelich (1991) and Covington and Roberts (1994) have introduced an even more differentiated, quadripolar concept of achievement motivation, its predictive power for students’ test motivation was not corroborated empirically. It distinguishes between students high in success orientation and low in failure avoidance (high/low: HL), students low in success orientation and high in failure avoidance (LH), students high on both dimensions (HH), and students low on both dimensions (LL). Giermann (2012) had proposed that especially LL-students might lack test motivation. Their general indifference to achievement in academic learning contexts, together with lacking fear of failure should cause them to evaluate test situations as not being challenging and to avoid effort in test taking. However, contrary to expectations, the main finding of Giermann’s (2012) empirical analysis was a generally positive impact of success orientation on test motivation. For this reason, we keep with Atkinson’s bipolar concept of achievement motivation when examining influencing factors of test motivation. In accordance with Thelk et al. (2009), we expect that a student’s general ambition to reach high achievement standards in an academic domain such as mathematics predicts the effort invested in any domain-related test that gives this student an opportunity to demonstrate excellent performance or at least to outperform other students.
Self-concept theory and the relevance of self-evaluated ability levels
According to the expectancy-value model (Eccles et al. 1983), a student’s self-concept in task-related fields of activity influences his/her motivation to work on a given task in this area. Academic self-concept and expectations of success in tasks that belong to the academic learning context thus are related constructs but differ with regard to their temporal focus and scope of application. Whereas a student’s academic self-concept gives a sober assessment of his/her current ability level across a range of academic topics (Marsh 1990), success expectations reflect subjective prognoses on performance in specific tasks he/she has to cope with in the nearer or farer future (Wigfield and Eccles 2000). Thus, in general one would assume positive correlations between students’ academic self-concept and the expectancy-dimension of their test motivation. If students rate their current, general academic abilities as high, their confidence in mastering the specific tasks they encounter within an academic context rises and promotes their expectations to succeed when engaging in these tasks (Eccles et al. 1983; Giermann 2012; Pohlmann et al. 2005). We assume that these higher expectations in turn lead to higher efforts in order to minimize the risk of failure that might question one’s ability-related self-concept. Following Eccles and Wigfield’s line of reasoning, we additionally assume positive associations between academic self-concept and the value dimension of students’ motivation to work on a given task (Eccles and Wigfield 2002, p 121):
“First, through processes associated with classical conditioning, the positive effect one experiences when one does well should become attached to the successful activities (see Eccles et al. 1983). Second, lowering the value one attaches to difficult activities is likely to be an effective way to maintain a positive global sense of efficacy and self-esteem (see Eccles et al. 1998, Harter 1990). Thus, at some point competence-related beliefs and values should become positively related to one another; Wigfield et al. (1997) demonstrated this empirically.”
Conforming to this idea, Pohlmann et al. (2005) found that examinees’ intrinsic value attributed to physical education in school was strongly related to their self-concept regarding sports. Furthermore, Eklöf (2007) reports a correlation of r = 0.26 between math self-concept and test motivation in PISA (Programme for international student assessment) 2003. Interestingly, after controlling for math self-concept, test motivation did not predict math ability any longer.
Action control theory—grit as an important aspect of volition
Grit refers to a person’s perseverance and passion for long term goals (Duckworth et al. 2007). It often serves as a synonym for persistence and volition. Although a few studies consistently demonstrate associations between different indicators of test takers’ grit and their test effort and outcomes (Boe et al. 2002; Duckworth et al. 2011; Tucker-Drob et al. 2016), they hardly ever elaborate the underlying assumptions. Action control theory has the potential to explain the link between these constructs (Kuhl 1984). This theory implies that even if students have serious intentions to learn, not all of these intentions may be realised, due to students’ lack of volitional control over their actions. According to Kuhl (Boekaerts and Otten 1993; Kuhl 1984), action control consists of three dimensions: the ability to take initiative (initiation), the ability to maintain a particular action tendency and to shield it from competing, alternative action tendencies (persistence), and the ability to drop goals if they are not reachable (disengagement).
In the present study, we focus on the persistence dimension (grit) of action control. Since this dimension entails “maintaining effort and interest over years despite failure, adversity, and plateaus in progress” (Duckworth et al. 2007, p 1088), it seems plausible that students with high grit work more strenuously on test items than students with low grit. Boe et al. (2002) demonstrated that variations in TIMSS achievement scores can be explained substantially by the amount of questions completed in the background questionnaire (as a proxy of persistence).
State- and trait-components of investigated predictors and criteria from a conceptual and a methodological point of view
Following Eccles and Wigfield’s (2002) reasoning on students’ task engagement, test motivation stems from situational success expectations for and value attributions to solving the specific tasks presented in a test. In line with this theoretical rationale, the construct of test motivation is operationalized by task-related items (Crombach et al. 2003; Thelk et al. 2009). Thus, from a conceptual point of view, test motivation results from subjective assessments of situational demands and represents a state experience of a student. Contrarily, the student characteristics we have outlined above as potential predictors of test motivation describe trans-situational dispositions, evaluations and other trait-like characteristics of students. For instance, students’ academic self-concept is operationalized in a generic way, that is, independent of the specific measurement occasion. The wording of the items was not referring to a specific moment in time. As Duckworth et al. (2011) point out, experts in intelligence testing unanimously rate examinees’ trait-like characteristics among the most important predictors of their situational test motivation and attainment. From a conceptual point of view, such characteristics are not highly volatile but instead comparably stable and resistant to change (Hamaker et al. 2007). Nevertheless, changes may evolve incrementally over longer periods. They may thus be demonstrable through repeated measurements of trait constructs that are separated by long time distances (such as entire school years). Moreover, according to Geiser et al. (2013, p 480), numerous authors have stated that “measurement rarely takes place in a situational vacuum, and the assessment of most psychological constructs has to deal with (a) initial or global trait level, (b) trait change, and (c) state variability components (Hertzog and Nesselroade 1987; Tisak and Tisak 2000). This is true even when scales are constructed to reflect perfectly stable traits (Deinzer et al. 1995)”. They thus conclude, that “[i]gnoring state variability components […] is unsatisfactory both from a theoretical and a practical point of view” (ibid.).
In the same vein, Hamaker (2012) argues that observational and self-report data, measured at any particular point in time, always represent the sum of a within-person (i.e. state-like, situational) component and a between-person (i.e. trait-like, trans-situational) component. Therefore, a one-time, punctual score of a study participant on a scale intended to measure a (conceptually) trait-like characteristic is always slightly biased by situation-bound fluctuations of his/her answers and does not necessarily reveal the “true” score of the underlying trait-like characteristic of interest. Similarly, a one-time, punctual score of a study participant on a scale intended to measure a (conceptually) state experience always includes a certain amount of his/her dispositional or habitual modes of perceiving and evaluating himself/herself and his/her environment. In addition, it is plausible to assume that consecutive observations are not completely independent of each other (e.g., Hamaker 2012) and that previous experiences influence proceeding ones. While this assumption particularly applies to repeated measures in small time intervals, it certainly loses explanatory power with growing distance between measurement points. Nevertheless, fluctuations in a student’s self-reported academic self-concept may result from his/her evaluation and attribution of learning success/failure during current and past lessons on a particular subject. These methodological arguments underscore the need to specify different sources of variability in statistical models.
In order to quantify the amounts of within-person and between-person variability in collected data (e.g., item responses), it is necessary to perform longitudinal analyses with a state-trait approach of measurement (e.g., Geiser et al. 2015; Prenoveau 2016). We do so by using data that were collected on five subsequent occasions in which low-stakes tests of accounting ability were performed and accompanied by surveys on test-taker characteristics in a group of vocational students (see chapters below for more sample information). By means of latent singletrait–multistate (STMS) models, we decompose the variance components of all repeatedly measured constructs into one overall trait and multiple states. Hence, we are interested if and to what extent trait-like components of test motivation are related to trait-like components of the psychological predictors introduced in the section “A heuristic model of student characteristics predicting test motivation”. In addition, we investigate the same question with regard to the state-like components of test motivation and their state-like psychological predictors. In other words, we follow a multilevel approach that distinguishes associations among the variables on the between (inter-individual, trait) level and the within (intra-individual, state) level, simultaneously.
As displayed in Fig. 5, the present study design covers five consecutive school years (grade 9 to grade 13). Within these 5 years, on the one hand, three waves of low-stakes tests and corresponding test taking motivation scales (grade 11 to grade 13) were conducted. On the other hand, three timely preceding repeated measures of students’ psychological prerequisites for test taking such as achievement motivation (grade 9 to grade 11) were collected. STMS models allow for analyses of comparably stable, inter-individual (mean-level) differences regarding both psychological prerequisites and overall test motivation by controlling for situational ‘contamination’ in measures of conceptually trait-like prerequisites and identifying a person-dependent, trait-like share of motivation to engage over various test situations. These models further facilitate the detection of incremental, intra-individual changes in psychological prerequisites and their respective relations with intra-individual variations in test motivation that evolve in the course of several years.
Aims and hypothesis
Given the data set and analytical approach outlined above, we follow two objectives: First, we explore to which extent students’ test motivation in low-stakes accounting tests represents a more trait-like (mainly inter-individually differing) disposition or a more state-like (mainly intra-individually differing) response to perceived situational demands.
Second, we test the assumption that students’ reports of test motivation are positively predicted by various psychological prerequisites. The set of investigated psychological student characteristics includes domain-specific intrinsic, identified, introjected, and extrinsic behavioural regulation, domain-specific achievement motivation, academic self-concept, and grit.
Method
Statistical analysis and model evaluation
In order to investigate these topics, we took three steps: In a first step, we specified latent singletrait–multistate (STMS) models as introduced by Geiser et al. (2015) for each longitudinally assessed construct described in the section “A heuristic model of student characteristics predicting test motivation”—see Appendix C of Geiser et al. (2015) for the Mplus code that was used here. STMS represents a specific SEM (Structural equation modelling) approach to model longitudinal data. Under certain conditions, this SEM approach is equal to the traditional multilevel approach of modelling longitudinal data (Hox and Stoel 2005). However, we prefer STMS to classical multilevel regression analysis as it allows staying within the latent variable modelling approach. We also prefer STMS to latent growth modelling for two reasons: First, there are no theoretical established assumptions on how repeated measures of test motivation change as a function of time. Second, our data only comprises three repeated measurement occasions, which is regarded as too low for growth modelling (Preacher 2008). STMS models are less restrictive with regard to these requirements. The literature offers a variety of latent state-trait models (e.g., Geiser et al. 2015; Prenoveau 2016). All of them aim at partitioning the variance of focal constructs into time-varying state-like components, time-invariant trait-like components, and residuals. Thus, all of them would fit our present research goal. Among these models, the latent state-trait model with autoregression (LST-AR) represents a popular way of modelling traits and states. In contrast to STMS, LST-AR includes autoregressive paths between adjacent state factors in order to model the assumption that previous states affect subsequent ones. However, a model-comparison test indicated that our test motivation data do not support this assumption. In fact, models with autoregressive paths fixed to zero even fit the data significantly better than models with estimated autoregressive paths (VALUE: TRd = 5.91, ∆df = 1, p = 0.016; EFFOR: TRd = 17.39, ∆df = 1, p < 0.001). The most plausible reason for this finding is that, in the present study design, the time gaps between subsequent test situations and, thus, each of their respective experiential states (indicating motivation to solve the test-specific tasks) are very large (see also the section “State- and trait-components of investigated predictors and criteria from a conceptual and a methodological point of view”). Contrary to designs that assess situation-specific thoughts and feelings in rapid succession, such as in 10-min intervals, an entire school year lies between two measurement points for situational test motivation in the present study. In such a design, the priming effects of features that dominated the preceding situation (and its perceptive, affective and cognitive resonance within the investigated actors) should be markedly weaker than for experience samples drawn every minute, every hour or even every week. Instead, students’ thoughts and feelings during a test in situation t1 are superimposed by various occurrences and experiences of the following school year and, therefore, can hardly influence thoughts and feelings in t2. Thus, we primarily focus on STMS models in the paper and only refer to the diverging results from LST-AR models when presenting our findings.
As indicated in Fig. 2, the STMS was specified as follows: For each observed indicator, loadings on both a common latent trait factor and a situation-specific state factor (= latent state residual factor at time t) were estimated. Thereby, at each measurement occasion (t) the first item was fixed to one in order to identify the latent scale. Moreover, weak factorial metric and strong factorial scalar invariance over time were specified by constraining factor loadings (for both latent trait and latent state loadings) and intercepts to be invariant across time. Measurement invariance for the trait factor is an indicator of factor stability, whereas non-invariance indicates a trait-change that should be modelled differently (Geiser et al. 2015, n.p.). Additionally, measurement non-invariance for the state factors indicate a violation of the STMS assumption that the situations are exchangeable and that, again, STMS may not be the best model to use (ibid.). In order to test strong measurement invariance we also modelled the mean structure. To identify the mean structure, intercepts of the reference indicators were set to zero and the latent trait factor mean was freely estimated. Finally, all correlations between the latent trait and latent state factors were fixed to zero, as they are uncorrelated by definition. Departing from the model suggested by Geiser et al. (2015), we specified auto-correlated error terms for each observed indicator (correlated uniqueness approach). This is a common practice within latent state trait modelling and often implemented via method constructs (Prenoveau 2016, p 736). Predictors that were assessed only once (two facets of grit—passion for long-term goals and perseverance) are specified as latent trait constructs only.

STMS model (butterfly model) with test motivation and psychological predictors. VALUE = Subjective test value dimension of the test motivation construct. EFFOR = Effort dimension of the test motivation construct. 11, 12, 13 = grade 11, grade 12, grade 13. The state-like components overlap only at grade 11 and 12 with the test motivation’s state-like component. For this reason the association β_s13 (states at grade 13) is depicted as dashed line indicating that this association is not investigated in the present study. β_t (trait), β_s11 (states at grade 11), and β_s12 (states at grade 12) indicate the associations of interest. The correlated uniqueness approach (item/method-specific correlations over time) is indicated by vertical curved (unlabelled) arrows
In a second step, we specified a STMS butterfly model (also known as multiconstruct/duplicate bifactor approach, Koch et al. 2017), as depicted in Fig. 2, for each repeatedly measured predictor. The multiconstruct bifactor approach allows analysing the relations of the trait- and state-like components of students’ test motivation with the corresponding trait- and state-like components of the predictor of interest. Moreover, the multiconstruct bifactor approach helps to circumvent methodological challenges such as model misspecification and biased parameter estimates when relating predictor variables directly to general and specific factors (e.g., due to suppressor effects, Koch et al. 2017). In this case, the covariances between the trait and the state factors are no longer zero and thus violating a central property of the trait-state framework. For predictors that were assessed only once (two facets of grit), the residual approach (ibid.) was applied to circumvent these issues (see Figs. 3, 4). As the name suggests, within the residual approach the explanatory variable is first predicted by the state components of the dependent variable to obtain a residual component of the explanatory variable that allows an unbiased prediction of the trait component of the dependent variable (see Fig. 3). Vice versa, the explanatory variable is first predicted by the trait component of the dependent variable to obtain a residual component of the explanatory variable that allows an unbiased prediction of the state components of the dependent variable (see Fig. 4). Thus, the residual approach leads to two models for each explanatory variable: One for explaining the trait component and one for explaining the state components of the dependent variable.

Bifactor model using the residual approach to predict the trait factor. VALUE = Subjective test value dimension of the test motivation construct. EFFOR = Effort dimension of the test motivation construct. 11, 12, 13 = grade 11, grade 12, grade 13. The association β_s13 (states at grade 13) is depicted as dashed line indicating that this association is not investigated in the present study. β_t (trait) indicates the associations of interest. The correlated uniqueness approach (item/method-specific correlations over time) is indicated by vertical curved (unlabelled) arrows

Bifactor model using the residual approach to predict the state factors. VALUE = Subjective test value dimension of the test motivation construct. EFFOR = Effort dimension of the test motivation construct. 11, 12, 13 = grade 11, grade 12, grade 13. The association β_s13 (states at grade 13) is depicted as dashed line indicating that this association is not investigated in the present study. β_s11 (states at grade 11) and β_s12 (states at grade 12) indicate the associations of interest. The correlated uniqueness approach (item/method-specific correlations over time) is indicated by vertical curved (unlabelled) arrows
As students’ test motivation was assessed via two constructs (see the section “A heuristic model of student characteristics predicting test motivation”), the second step of our analytic strategy included a total of 20 models. More precisely, in order to conduct a series of bivariate analyses, we estimated 6 butterfly models/multiconstruct bifactor models and 4 bifactor models using the residual approach for each test motivation construct.
We then switched to a multivariate approach in a third step. The multivariate approach allows investigating the effects of each psychological predictor while controlling for the effects of all other predictors. However, to avoid too complex models we replaced the STMS approach by an intercept-only “growth” modelling (IGM) approach: “The most basic form of growth is a random intercept-only model; this implies that there is a stable overall level of the repeatedly measured construct over time and individuals vary randomly around this overall level at any given time point” (Curran et al. 2010, p 5). In contrast to STMS, in IGM only the trait-like component is specified by fixing all trait-indicatorFootnote 1 loadings to 1. Since the intercept and the trait-like component are equivalent in the present case, we refer to the IGM as intercept/trait-only “growth” model hereinafter. Following this approach, we assume no state-like components when examining multivariate relations.
Since we are interested in how far students’ response patterns vary primarily by persons or by situations, we calculated consistency and occasion-specificity values (Geiser et al. 2015) for each item. Consistency (CO) quantifies “the degree of stability across situations” (Geiser et al. 2015) and is calculated as follows:
\( {\lambda_{it}^{2} } \) = item loading on the latent trait factor, \( Var\left( \zeta \right) \) = variance of the latent trait factor, \( Var\left( {Y_{it} } \right) \) = variance of the item.
Occasion-specificity (OS) quantifies “the extent to which the longitudinal course of a construct is affected by a state variability process: The larger the OS coefficient, the stronger the situation-specific or person × situation interaction influence on the observed scores” (Geiser et al. 2015, n.p.). OS is calculated by using the formula
\( \delta_{it}^{2} \) = item loading on the latent state factor, \( Var\left( {\zeta_{t} } \right) \) = variance of the latent state factor at occasion t, \( Var\left( {Y_{it} } \right) \) = variance of the item.
For model evaluation, we stick to conventional indices. We assessed model fits based on Comparative Fit Index (CFI), Tucker Lewis Index (TLI), Root Mean Square Error of Approximation (RMSEA) and Standardized Root Mean Square Residual (SRMR). According to Hu and Bentler (1999) and Little (2013), values of CFI ≥ 0.95/0.90, TLI ≥ 0.95/0.90, RMSEA ≤ 0.05/0.08, and SRMR ≤ 0.05/0.10 indicate good/acceptable fit.
Technical notes
We used Mplus 8 (Muthén and Muthén 1998–2018) to estimate all models and R (R Development Core Team 2008) in combination with MplusAutomation (Hallquist and Wiley 2016) to support the analyses and the presentation of the results. The coefficients were obtained by means of maximum likelihood estimation with robust standard errors (MLR, i.e., standard errors are robust against violation of the normal distribution assumption). We used the Mplus command TYPE = COMPLEX in combination with CLUSTER = school classes to account for the nested structure of the data (student perception nested within school classes) when calculating standard errors.
Study design and sample
To estimate the butterfly models depicted in Fig. 2, we used longitudinal data that allow examining associations between trait- and state-like components of students’ test motivation and the corresponding trait-/state-components of psychological predictors. The participants in the study were students from fulltime vocational schools in Austria. They completed online questionnaires (to assess predictors) and paper–pencil ability tests at the beginning of grade 9 and at the end of grades 10, 11, 12, and 13, each of which lasted one teaching unit (50 min). Each ability test ended with a short paper–pencil-based test motivation questionnaire (see Table 7 of the Appendix).
Organisational aspects of the data collection process, which are not analysed in the main study of this paper, might affect students’ test motivation. To give at least a rough impression of these aspects, we describe central circumstances below and provide additional analyses in the “Discussion” section:
-
Both the low-stakes ability tests and the online questionnaires were administered during instruction time at school, using computer labs (for online questionnaires) and standard classrooms (for paper–pencil tests). However, in order to reduce disruptions of instruction time and to meet the needs of the schools, decisions on day and time of data collection were up to each school. Thus, the online questionnaires and the paper–pencil ability test were administered at different times of the day and at different days at the end of the school year.
-
For all but one measurement occasion (see Fig. 5), data collection occurred under the supervision of the first author of the present paper. One assessment wave was managed by a colleague of another department in the first author’s university. This ensured standardized test situations.
Fig. 5 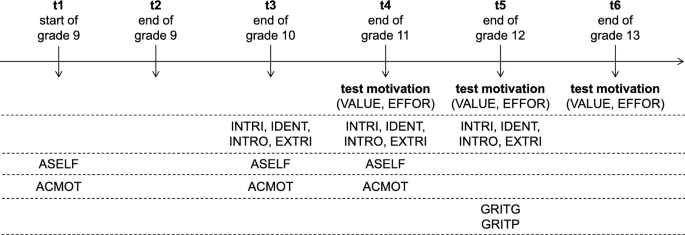
Overview of measures at different occasions in time. VALUE, Subjective test value; EFFOR, Effort; INTRI, Intrinsic regulation; IDENT, Identified regulation; INTRO, Introjected regulation; EXTRI, External regulation; ACMOT, Achievement motivation; ASELF, Academic self-concept; GRITG, Passion for long-term goals; GRITP, Perseverance
-
Participation was voluntary. All students who were present on the days of data collection agreed to take part in the study. On average, 10% of the students in the participating classes were absent.

Overall, 852 students (74% girls; Mage at t1 = 14.4 years, SDage at t1 = 0.74) from 24 classes took part in the longitudinal study. However, sample size varied over time due to students dropping out or repeating years. Moreover, the sample size rapidly decreased over the investigated years. Thus, some constructs that were assessed only in higher grades are based on fewer observations. Column 3 in Table 3 indicates the total N used in each model. To handle missing data, the full-information maximum likelihood estimation (FIML), implemented in Mplus, was applied. Note that the online questionnaire automatically pointed out omitted items to students.
Measures
Figure 5 presents an overview of the instruments used at different measurement occasions. Due to limited testing time, it was not possible to assess all the constructs in all assessment waves. Thus, the overlap of the occasions for test motivation and for predictors is not perfect in all waves. Table 8 in the Appendix summarises mean values, standard deviations, Cronbach’s alpha values, and bivariate correlations of the scales reported in Fig. 5.
Test motivation
Immediately after taking a test, students rated 16 items that assessed test motivation according to Giermann (2012). This instrument includes 2 items for each value facet (attainment, intrinsic, utility, cost) in line with expectancy value theory by Eccles and Wigfield (2002) in order to assess students’ subjective test value (VALUE) (e.g., “To do well in this test was important to me personally”). Students’ expectations for success were assessed with 1 item only and thus excluded from the following analyses. Instead, students’ effort (EFFOR) during test taking was assessed with another 8 items (e.g., “I invested high effort throughout the test.”). These items are in line with the Student Opinion Scale by Sundre (2007), which represents one of the most frequently used test motivation scales (Finn 2015). Although confirmatory factor analysis supported this factorial structure, STMS models only showed acceptable fit if items with low factor loadings were excluded from the two scales. Thus, we ended up with 4 (value) and 6 (effort) items, which still yield good internal consistency (α = 0.74–0.84). With regard to content validity, however, the value dimension now lacks items asking for the perception of the intrinsic value of the taken test.
Behavioural regulation
To measure this construct, the German version of the “Academic Self-regulation Questionnaire” (SRQ-A; Ryan and Connell 1989), validated by Müller et al. (2007), was used. It taps four generic types of behavioural regulation when dealing with contents from the domain of accounting (“I participate in and study accounting…”). These are intrinsic regulation (INTRI; e.g., “…because it is fun”), regulation through identification (IDENT; e.g., “…because it will give me more opportunities in my later career”), introjected regulation (INTRO; e.g., “… because I want the other students to think that I am excellent”) and external regulation (EXTRI; e.g., “…to avoid conflicts with my teacher”). Each scale consisted of four to five items, which were rated from 1 (strongly disagree) to 5 (strongly agree).
Academic achievement motivation
Students’ willingness to make an effort in school (ACMOT, e.g., “I strive for good performance even if I do not like the domain”) was measured using a four-item subscale of the LIILEST (Linzer Inventar zum Lern- und Studierverhalten/Linz Inventory for Assessing Study Behaviour; Sageder 1995). The scale contains a six-point response format ranging from 1 (never, very seldom) to 6 (very often, always).
Academic self-concept
Students’ academic self-concept (ASELF) was assessed with eleven items from the Austrian study on educational well-being (Eder 2007; e.g., “I learn things quickly”). The items were formulated in a general way, independent of subject matter. Students were asked to rate these items using a four-point response format ranging from 1 (strongly disagree) to 4 (strongly agree).
Grit
In order to measure students’ perseverance and passion for long-term goals, the BISS scale (Beharrlichkeit und beständiges Interesse Skala, Fleckenstein et al. 2014) was used. The German BISS scale is based on the original English version from Duckworth and colleagues (Duckworth et al. 2007) and was validated for German-speaking teacher students (Fleckenstein et al. 2014). The scale comprises 12 items. Six items reflect passion for long-term goals (GRITG, e.g., “New ideas and projects sometimes distract me from previous ones”). Some of them are inversely formulated and were recoded prior to statistical analyses. Another six items pertain to students’ perseverance (GRITP, e.g., “I am diligent”).
Results
Does test motivation represent a trait- or state-like construct?
The latent state-trait models for the two test motivation dimensions show a good model fit (VALUE: CFI 0.972, RMSEA 0.034, SRMR 0.058; EFFOR: CFI 0.946, RMSEA 0.044, SRMR 0.060).Footnote 2 For both constructs, consistency and occasion-specificity (see Table 2) indicate that about 30% (on average) of the observed variability in students’ response patterns represent inter-individual variation and thus are likely to be explained by trait-like personal dispositions. In contrast, about 23% (on average) represent intra-individual variation and thus are likely to be explained by state-like student × situation-interactions.
To which extent are trait- and state-like components of test motivation associated with students’ psychological characteristics?
Table 3 lists the results from bivariate analyses. The table as well as the following passages are subdivided by the two dimensions of test motivation, value and effort. For both dimensions, the models show a satisfying fit.Footnote 3
VALUE
As expected, substantial amounts of stable inter-individual differences in value attributions to test situations can be explained by students’ achievement motivation (ACMOT, β_t = 0.385, p = 0.001) and each of the self-determined types of behavioural regulation (INTRI, β_t = 0.370, p < 0.001; IDENT, β_t = 0.344, p < 0.005; INTRO, β_t = 0.334, p < 0.001). With regard to the state-like components, medium to large associations appear with self-determined types of behavioural regulation (INTRI, β_s11 = 0.195, p = 0.013; β_s12 = 0.297, p = 0.003; INTRO, β_s11 = 0.512, p < 0.001; β_s12 = 0.295, p = 0.017), academic self-concept (ASELF, β_s11 = 0.241, p = 0.046) as well as achievement motivation (ACMOT, β_s11 = 0.439, p < 0.001). Surprisingly, at grade 11, students’ passion for long term goals negatively predicts students’ state-like component of the value dimension of test motivation (GRITG, β_s11 = − 0.543, p = 0.025).
EFFOR
With regard to the trait-like components, the findings for students’ self-reported effort in the test situation (EFFOR) reveal a quite similar picture, which also conforms to our theoretical arguments. Students’ effort is significantly predicted by students’ self-determined behavioural regulation (INTRI, β_t = 0.296, p < 0.001; IDENT, β_t = 0.386, p = 0.001; INTRO, β_t = 0.342, p < 0.001) and their achievement motivation (ACMOT, β_t = 0.256, p = 0.025). Additionally and contrary to the value dimension, students’ perseverance also predicts the trait-like component of effort over test situations (GRITP, β_t = 0.481, p = 0.002). However, in contrast to the value dimension, no significant associations between the state-like components of EFFOR and the state-like components of the predictors appear.
Although the results from LST-AR models (see Table 4) indicate unsatisfactory model fit, they still yield similar findings. Again, trait-like components of test motivation are predicted by trait-like components of students’ intrinsic, identified and introjected regulation. In addition, grit functions as a predictor for the trait-like component of the value dimension of test motivation. Unexpectedly, passion for long-term goals is negatively related to students overall effort during low-stakes test situations. With regard to the state-like components, the results also differ only slightly from the STMS approach: With regard to the value dimension, intrinsic motivation and self-concept is no longer predictive in grade 11. In addition, the negative effect of passion vanishes. With regard to the effort dimension, students’ introjected regulation and achievement motivation are now significant and positive predictors at grade 11. Given the bad fit, these few deviations from the STMS models should not be overinterpreted. Rather, the many converging findings of the two different approaches should be considered as support for the overall conclusion that students’ generic motivational aspects are closely related to their test motivation.
Table 5 contains the results from two multivariate intercept/trait-only “growth” models. Each model regresses the trait-like component of a test motivation dimension on the trait-like components of all six longitudinally assessed predictors and on the latent factors of the two grit variables that were assessed only once. Model fit measures indicate acceptable fit (VALUE: CFI 0.907, RMSEA 0.041, SRMR 0.075; EFFOR: CFI 0.916, RMSEA 0.040, SRMR 0.074). Controlling for all other trait-like components of students’ characteristics, student’s trait-like introjected regulation positively predicts the trait-like component of the value dimension of the test motivation scale (INTRO, β_t = 0.290, p = 0.006). The effort dimension is significantly predicted by students’ trait in identified regulation as well as their perseverance (IDENT, β_t = 0.301, p = 0.048; GRITP, β_t = 0.309, p < 0.000). In total, 35% and 25% of variation in students’ stable test motivation (value, effort) in accounting are explained by student characteristics.
Effects of test administration
As mentioned in the section“Study design and sample”, organisational aspects of the data collection process might affect students test motivation and our study results. Thus, we did additional analyses on (1) the effects of the order of administering the two test parts (a. online questionnaire and b. the paper and pencil ability test). Furthermore, we investigated (2) the effect of the time lag between the two test parts and (3) the effect of the daytime the ability test was taken. We did so by using the time stamps of the online questionnaire and the paper and pencil test time recorded in the survey documentation. With regard to the first question, school classes were grouped into two subsamples: classes that completed the online questionnaire first (grade 11 = 58%; grade 12 = 47%) and classes that completed the paper and pencil test first (grade 11 = 42%, grade 12 = 53%). With regard to the second question, the absolute temporal distance between the two test parts was calculated. The three indicators were used as predictors of test motivation on class-level. Multilevel regressions (see Table 6) show that in both grades 11 and 12, test motivation is independent of the temporal distance between the two test parts. Additionally, for the value dimension of test motivation it does not matter whether the online questionnaire or the paper and pencil test had to be performed first. In contrast, the order of administering of the two test parts does matter for the EFFOR dimension. At both grades, school classes who worked first on the online questionnaire reported higher effort on average when taking the paper and pencil test. Finally, students who worked on the ability test later in the day reported lower ratings on the VALUE dimension of the test. However, the latter finding represents an artefact for two reasons: First, the VALUE dimension does not vary significantly at class-level (ICC(1) = 2% at both grades) and thus might possess a low class-level reliability that leads to overestimated effects (Lüdtke et al. 2002). Second, the standardization procedure used in Mplus leads to large effect sizes when intraclass correlation ICC(1) is low (Marsh et al. 2009).
Discussion
Skill and will are two central ingredients of students’ performance in low-stakes testing. Thus, the bias caused by a lack of test motivation has been subject to a wide range of studies. In contrast, limited evidence is available on the variability and the predictors of students’ test motivation—in particular, in vocational domains such as accounting. For this reason, the present study aimed at investigating to which extent student’s test motivation in low-stakes accounting tests represents a trait- and state-like construct. Moreover, we explored student characteristics that significantly predict the value students attribute to accounting tests and the effort they invest in working on these tests.
Drawing on Urhahne’s (2008) synthesis of motivation theories in academic learning contexts, we assumed that several student characteristics systematically relate to both trait- and state-like shares of test motivation. More precisely, we hypothesized that students’ reports of test motivation are significantly predicted by domain-specific intrinsic, identified, introjected, and extrinsic regulation, domain-specific achievement motivation, academic self-concept, and grit. The results of a wide range of longitudinal butterfly models largely confirm our assumptions.
First of all, consistency and occasion-specificity values (Geiser et al. 2015) indicate that students’ test motivation consists of almost equally large stable and situational components. More precisely, 30% (trait) and 23% (state) of the variation in students’ test motivation is stable over the years and situationally varying, respectively. This indicates that students’ test motivation in accounting is less situation-dependent as one might expect a priori. Whether students are willing to engage in a low-stakes test situation seems (slightly) more a question of students’ individual characteristics than of the test situation itself—at least in the present study. However, this conclusion should not be overestimated since the trait-like component only constitutes approx. one-third of the total motivation construct.
Student characteristics predicting stable inter-individual differences in test motivation
Conforming to theoretical reasoning, for both of the assessed dimensions of the test motivation construct—(a) the value students place on tasks in accounting tests and (b) the effort students invest in the test—students’ trait-like components of achievement motivation and self-determined types of behavioural regulation in school positively predict their overall level of test motivation at different occasions of low-stakes testing. In other words, students who report on average (in a longitudinal, trait-like sense) higher academic engagement and effort as well as higher autonomous, identified and introjected learning in accounting value low-stake accounting tests more strongly. They judge test-taking over various occasions of testing to be more joyful, important, useful and costly than students with lower levels of achievement motivation and self-determined behavioural regulation. Moreover, students who characterise their learning behaviour in accounting to be more autonomous and who report higher achievement motivation in general also report to invest more effort over various test situations over several years (again in a longitudinal, trait-like sense). With regard to the effort dimension, students’ perseverance as one main aspect of grit represents an additional predictor. That is, students who rate themselves as diligent and hardworking also rate their test-taking behaviour over various test situations as more tenacious than students who rate themselves as less diligent and hardworking. This finding is in line with the observation of Datu et al. (2016) who found that perseverance but not consistency (in the sense of a passion for long-term goals) predicts students’ behavioural engagement.
Against our expectations, the trait-like component of students’ academic self-concept does not systematically relate to the trait-like component of both test motivation subscales. One reason for these missing associations might be the suboptimal way in which academic self-concept was assessed. The items of the self-concept scale referred to learning in academic contexts in general, not specifically in the domain of accounting. The lack of domain-specificity of the self-concept scale might weaken its association to students’ test motivation in accounting (see Möller and Köller 2004). Another, more theoretical, reason might be that the relation between students’ academic self-concept and students’ willingness to work hard on low-stakes tests is mediated via students’ internal or external attributions of learning success. However, locus of control as a potential mediator was not assessed in the present study.
Intra-individual changes in test-motivation and their relation to intra-individual changes in predictor variables over several school years
With regard to the state-like components, the findings differed between the two dimensions of test motivation. While the value dimension is again predicted by students’ behavioural regulation, achievement motivation, but also academic self-concept, no predictors were identified for the state-like components of the effort dimension. The detected relations among the state-like components of the predictors and the dependent variables can be interpreted as follows: Given fixed traits, the (within-student) variability of test motivation is predicted by the (within-student) variability of more general motivational dispositions (behavioural regulation, self-concept, achievement motivation). This finding indicates that variations in a student’s test motivation (value dimension) over repeated occasions of test taking are substantially due to changes in his/her autonomous learning behaviour, achievement motivation, and self-concept. For example, when looking at grade 11, students who report higher achievement motivation are also more likely to value the corresponding test situation higher—controlling for the overall trait-like components of students’ test motivation and students’ achievement motivation. Thus, one way to increase/decrease students test motivation for a specific measurement wave is to increase/decrease their general learning motivation throughout the school year. Several instructional strategies are conceivable: (a) support of basic psychological needs, (b) fostering favourable attributions, (c) mastery and achievement goal orientations, and (d) learning environments (such as repeated homework) that provide opportunities for students to show persistence and diligence. Thereby teachers not only increase students’ trait-like components but most likely their state-like components of motivation, too.
However, this does not hold for the second dimension of test motivation, the effort scale. Obviously, this situation-specific variation in test motivation is due to other circumstances that were not assessed in the present study, such as the class climate during test taking, the value the class teacher places on external tests, the time of the day when the test was taken, etc. Therefore, we conducted further analyses in order to test for effects of the order of administering the two test parts (online questionnaire and ability test), the time lag between the two test parts and the daytime the ability test was taken (see the section “Limitations and research implications”).
Interestingly, students’ passion for long-term goals negatively predicts students’ state-like test motivation at grade 11. However, as this finding does not appear in the measures for grades 12 and 13, we refrain from (over-)interpreting it.
These bivariate findings are widely corroborated by additionally performed LST-AR models that include autoregressive paths among adjacent state-like components. The findings from LST-AR models mainly show a similar relational pattern among the investigated predictors and dependent variables. However, the findings also indicate significantly lower model fits, which may be due to the long time intervals between the subsequent measurement occasions of the present study.
Multivariate analyses
Furthermore, when examining the effects of all assessed psychological characteristics on test motivation simultaneously, many of the previously obtained bivariate effects vanish. This possibly owes to the conceptual overlap among the predictor variables. Trait-only “growth” models indicate that students’ perception of the value of accounting tests is only predicted by their introjected regulation. In contrast, their effort during accounting tests is predicted by their identified regulation and their perseverance. Nevertheless, these results underline that students who identify themselves with the domain of accounting, who learn because of internal feelings of pressure (a guilty conscience, the desire to please demands signalled by significant others), and who rate themselves as diligent and hardworking report the highest levels of test-taking motivation over various test situations.
Taken together, findings from bivariate and multivariate analyses support the presented holistic and theory-based approach. This is the first study to investigate a wide range of relevant psychological predictors of students test motivation. So far, evidence was provided for single predictors (Ackerman and Kanfer 2009; Asseburg and Frey 2013; Barry et al. 2010; Boe et al. 2002; Duckworth et al. 2011; Giermann 2012; Pekrun 1993; Pohlmann et al. 2005; Tucker-Drob et al. 2016; Yeo and Neal 2008). Moreover, to the best of our knowledge, this is the first study that assesses and analyses students’ test motivation in a longitudinal design (using latent singletrait–multistate models).
Limitations and research implications
Although the presented findings provide new insights into the longitudinal interplay of students’ psychological dispositions and test motivation, some limitations need to be considered when interpreting the results.
First, although students’ test motivation was assessed with a rather long scale (16 items), only students’ perception of test value and their self-reported effort were captured. The expectancy dimension as integral part of expectancy-value theory was omitted. This raises the question if and to what extent the investigated predictors are related to this neglected part of students’ test motivation.
Second, with regard to the present study design, it could be beneficial to look at students’ response time as an additional indicator of test motivation. Since the student questionnaire was administered online, it would be possible to identify those students who answered certain items unreasonably fast (below item reading time).
Third, as mentioned in the section “Study design and sample”, organisational aspects of the data collection process might affect students’ test motivation. These results of additional analyses indicate that there might be an item-order like effect for the effort-dimension of test motivation. One explanation might be that students who work on the questionnaire first obtain more information on the relevance of the study. Hence, they might be more intrinsically motivated to participate in the subsequent ability test. However, since the effort-dimension varies only weakly between school classes (ICC(1) = 10% at both grades), class-level effects may influence students’ engagement during the test only up to 10%. Moreover, in addition to the item-order like effect, there are many other possible effects, which may overrule (or at least substantially reduce) the item-order like effect, such as class-average of students’ motivation and cognitive ability. Hence, we are quite confident that this affect has no impact on our student-level results.
Finally, the analysed sample might lack representativeness. Although the investigated sample can be considered representative with regard to the age and gender distribution of commercial full time schools at upper secondary stage in Austria, only 7 schools were included. It stands to question if the sample is representative with regard to teacher and school characteristics such as the composition of the student body. Moreover, since vocational education systems differ largely between countries, it is questionable if the presented findings hold for a broader range of vocational education and training settings. Thus, longitudinal large-scale studies in vocational education are needed.
Conclusion
Given the demonstrably biasing effects of test motivation on performance in low-stakes tests (e.g., Wise and DeMars 2005) and a dearth of studies that elucidate the determinants of variations in test motivation (Finn 2015), which may occur between different examinees (trait-like) as well as between different test situations (state-like), our study contributes to scientific knowledge by focusing on potential psychological determinants underlying vocational students’ test motivation. This knowledge may aid in planning related studies and interventions.
Based on an integral framework of motivation theories in academic learning contexts (Urhahne 2008), empirical results obtained through singletrait–multistate models suggest that a substantial proportion of inter-individual differences in students’ motivation to engage in accounting tests owes to basic types of self-regulated learning behaviour and volitional endeavour in the academic domain of accounting. Students who have adopted introjected or identified modes of dealing with learning tasks in this domain and possess high levels of persistence are more likely to work hard on domain-specific test items in various test situations, even if these tests do not bear serious consequences for their professional careers (low-stakes condition). Our models also indicate that intra-individual changes in self-determined regulation of a student’s learning behaviour, which occur in the course of several school years, predict variations in the value he/she places on succeeding in different low-stakes tests over these years.
Our results thus imply that the biasing effects of test motivation can be reduced by controlling for constructs that characterize students’ learning behaviour in the academic domain that a test relates to, in particular self-determined types of learning and perseverance. Measuring these constructs may be a fruitful supplement to traditional test motivation scales. This is because contrary to traditional scales, these constructs provide insights into students’ more general motivation to learn and, consequently, reveal potential starting points for pedagogical interventions that may enhance students’ engagement both in class and in test situations.
Notes
Trait-indicators were built by simply averaging over the items of the construct at measurement occasion t.
Additionally, Table 9 of the Appendix presents the model fit indices of the STMS for the covariates. All indices indicate acceptable model fit. Table 10 of the Appendix contains information regarding longitudinal measurement invariance of the assessed constructs. Only for academic self-concept and the state factors of the effort dimension, the assumption of measurement invariance did not hold.
It should be noted that according to McNeish and Hancock (2018) these global fit indices simultaneously gauge data–model fit across the measurement and structural part of the model. Hence, it is unclear to which extent these indices indicate a satisfying fit of the structural models investigated.
Abbreviations
- ACMOT:
-
academic achievement motivation
- ASELF:
-
academic self-concept
- BISS:
-
perseverance and long-term interest
- CFI:
-
Comparative Fit Index
- CO:
-
consistency
- EFFOR:
-
effort dimension of test motivation
- EXTRI:
-
external regulation
- FIML:
-
full-information maximum likelihood estimation
- ICC:
-
intraclass correlation
- IDENT:
-
identified regulation
- IGM:
-
intercept-only “growth” modelling
- INTRI:
-
intrinsic regulation
- INTRO:
-
introjected regulation
- IQ:
-
Intelligence quotient
- L, H:
-
low, high
- LIILEST:
-
Linz Inventory for Assessing Study Behaviour
- LST-AR:
-
latent state-trait model with autoregression
- MLR:
-
maximum likelihood estimation with robust standard errors
- OS:
-
occasion-specificity
- PISA:
-
Programme for international student assessment
- RMSEA:
-
Root Mean Square Error of Approximation
- SEM:
-
structural equation modelling
- SRMR:
-
Standardized Root Mean Square Residual
- SRQ-A:
-
Academic Self-regulation Questionnaire
- STMS:
-
latent singletrait–multistate
- TIMSS:
-
trends in mathematics and science study
- TLI:
-
Tucker Lewis Index
- VALUE:
-
value dimension of test motivation
References
Ackerman PL, Kanfer R (2009) Test length and cognitive fatigue: an empirical examination of effects on performance and test-taker reactions. J Exp Psychol Appl 15:163–181. https://doi.org/10.1037/a0015719
Asseburg R, Frey A (2013) Too hard, too easy, or just right? The relationship between effort or boredom and ability-difficulty fit. Psychol Test Assess Model 55:92–104
Atkinson JW (1957) Motivational determinants of risk-taking behavior. Psychol Rev 64:359–372
Barry CL, Horst SJ, Finney SJ, Brown AR, Kopp JP (2010) Do examinees have similar test-taking effort? A high-stakes question for low-stakes testing. Int J Test 10:342–363. https://doi.org/10.1080/15305058.2010.508569
Beck K, Landenberger M, Oser F (eds) (2016) Technology-based assessment of skills and competencies in VET. Results from the support initiative ASCOT of BMBF. wbv, Bielefeld (in German)
Boe EE, May H, Boruch RF (2002) Student task persistence in the third international mathematics and science study: a major source of achievement differences at the national, classroom, and student levels. https://files.eric.ed.gov/fulltext/ED478493.pdf
Boekaerts M, Otten R (1993) Action control and learning-related effort in the classroom. Zeitschrift für Pädagogische Psychologie 7:109–116 (in German)
Chen FF (2007) Sensitivity of goodness of fit indexes to lack of measurement invariance. Struct Eq Model 14:464–504. https://doi.org/10.1080/10705510701301834
Covington MV, Omelich CL (1991) Need achievement revisited: verification of Atkinson’s original 2 × 2 model. Stress Emotion 14:85–105
Covington MV, Roberts BW (1994) Self-worth and college achievement: motivational and personality correlates. In: Pintrich PR, Brown DR, Weinstein CE (eds) Student motivation, cognition, and learning. Erlbaum, Hillsdale, pp 157–188
Crombach MJ, Boekaerts M, Voeten MJM (2003) Online measurement of appraisals of students faced with curricular tasks. Educ Psychol Measur 63:96–111. https://doi.org/10.1177/0013164402239319
Curran PJ, Obeidat K, Losardo D (2010) Twelve frequently asked questions about growth curve modeling. J Cogn Dev 11:121–136. https://doi.org/10.1080/15248371003699969
Datu JAD, Valdez JPM, King RB (2016) Perseverance counts but consistency does not! Validating the short grit scale in a collectivist setting. Curr Psychol 35:121–130. https://doi.org/10.1007/s12144-015-9374-2
Deci EL, Ryan RM (1985) Intrinsic motivation and self-determination in human behavior. Perspectives insocial psychology. Plenum Press, New York, NY, USA
Deinzer R, Steyer R, Eid M, Notz P, Schwenkmezger P, Ostendorf F, Neubauer A (1995) Situational effects in trait assessment: The FPI, NEOFFI, and EPI questionnaires. Eur J Pers 9:1–23. https://doi.org/10.1002/per.2410090102
Duckworth AL, Peterson C, Matthews MD, Kelly DR (2007) Grit: perseverance and passion for long-term goals. J Pers Soc Psychol 92:1087–1101. https://doi.org/10.1037/0022-3514.92.6.1087
Duckworth AL, Quinn PD, Lynam DR, Loeber R, Stouthamer-Loeber M (2011) Role of test motivation in intelligence testing. Proc Natl Acad Sci USA 108:7716–7720. https://doi.org/10.1073/pnas.1018601108
Eccles JS, Wigfield A (2002) Motivational beliefs, values, and goals. Annu Rev Psychol 53:109–132
Eccles J, Adler TF, Futterman R, Goff SB, Kaczala CM, Meece J, Midgley C (1983) Expectancies, values and academic behaviors. In: Spence JT (ed) Achievement and achievement motives: psychological and sociological approaches. Freeman, San Francisco, pp 109–132
Eccles JS, Wigfield A, Schiefele U (1998) Motivation to succeed. In: Eisenberg N (ed) Handbook of child psychology. Social, emotional, and personality development, vol 3, 5th edn. Wiley, New York, pp 1017–1095
Eder F (2007) The well-being of children and adolescents in Austrian schools. Bildungsforschung des Bundesministeriums für Bildung, Wissenschaft und Kultur, vol 20. Studienverl., Innsbruck (in German)
Eklöf H (2007) Test-taking motivation and mathematics performance in TIMSS 2003. Int J Test 7:311–326. https://doi.org/10.1080/15305050701438074
Finn B (2015) Measuring motivation in low-stakes assessments. ETS Res Rep Ser 2015:1–17. https://doi.org/10.1002/ets2.12067
Fleckenstein J, Schmidt FTC, Möller J (2014) Who possesses stamina? Perseverance and enduring interest of prospective teachers. A German adaptation of the 12-item Grit Scale. Psychologie in Erziehung und Unterricht 61:281. https://doi.org/10.2378/peu2014.art22d (in German)
Geiser C, Keller B, Lockhart G (2013) First versus second order latent growth curve models: some insights from latent state-trait theory. Struct Equ Model. https://doi.org/10.1080/10705511.2013.797832
Geiser C, Keller BT, Lockhart G, Eid M, Cole DA, Koch T (2015) Distinguishing state variability from trait change in longitudinal data: the role of measurement (non)invariance in latent state-trait analyses. Behav Res Methods 47:172–203. https://doi.org/10.3758/s13428-014-0457-z
Giermann I (2012) The influence of test motivation on performance in a performance test. AV Akademikerverlag, Saarbrücken (in German)
Hallquist M, Wiley J (2016) MplusAutomation: Automating Mplus Model estimation and interpretation. R package version 0.6-4. https://CRAN.R-project.org/package=MplusAutomation
Hamaker EL (2012) Why researchers should think “within-person”: a paradigmatic rationale. In: Mehl MR, Conner TS (eds) Handbook of research methods for studying daily life, Paperback edn. Guilford Press, New York, pp 43–61
Hamaker EL, Nesselroade JR, Molenaar PCM (2007) The integrated trait–state model. J Res Pers 41:295–315. https://doi.org/10.1016/j.jrp.2006.04.003
Harter S (1990) Causes, correlates and the functional role of global self-worth: a life-span perspective. In: Kolligian J, Sternberg R (eds) Perceptions of competence and incompetence across the life-span. Yale Univ. Press, New Haven, CT, pp 67–98
Heckhausen H (1965) Achievement motivation. In: Thomae H (ed) Handbuch der Psychologie. Hogrefe, Göttingen, pp 602–702 (in German)
Helm C (2016) Learning in open and traditional instructional settings. Waxmann, Münster (in German)
Hertzog C, Nesselroade JR (1987) Beyond autoregressive models: some implications of the trait-state distinction for the structural modeling of developmental change. Child Dev 58:93. https://doi.org/10.2307/1130294
Hox J, Stoel RD (2005) Multilevel and SEM approaches to growth curve modeling. In: Everitt B, Howell DC (eds) Encyclopedia of statistics in behavioral science. Wiley, Hoboken, pp 1–10
Hu L-t, Bentler PM (1999) Cutoff criteria for fit indexes in covariance structure analysis: conventional criteria versus new alternatives. Structural Equation Modeling 6
Koch T, Holtmann J, Bohn J, Eid M (2017) Explaining general and specific factors in longitudinal, multimethod, and bifactor models: some caveats and recommendations. Psychol Methods. https://doi.org/10.1037/met0000146
Kuhl J (1984) Volitional aspects of achievement motivation and learned helplessness: toward a comprehensive theory of action control. Prog Exp Pers Res 13:99–171
Little TD (2013) Longitudinal structural equation modeling. Methodology in the social sciences. Guilford Press, New York
Lüdtke O, Robitzsch A, Köller O (2002) Statistical artifacts in educational studies on context effects. Zeitschrift für Pädagogische Psychologie 16:217–231. https://doi.org/10.1024//1010-0652.16.34.217
Marsh HW (1990) The structure of academic self-concept: the Marsh/Shavelson model. J Educ Psychol 82:623–636. https://doi.org/10.1037//0022-0663.82.4.623
Marsh HW, Lüdtke O, Robitzsch A, Trautwein U, Asparouhov T, Muthén B, Nagengast B (2009) Doubly-latent models of school contextual effects: integrating multilevel and structural equation approaches to control measurement and sampling error. Multivar Behav Res 44(6):764–802
McNeish D, Hancock GR (2018) The effect of measurement quality on targeted structural model fit indices: a comment on Lance, Beck, Fan, and Carter (2016). Psychol Methods 23:184–190. https://doi.org/10.1037/met0000157
Möller J, Köller O (2004) On the development of academic self-concepts: the impact of social and dimensional comparisons. Psychologische Rundschau 55:19–27 (in German)
Müller FH, Hanfstingl B, Andreitz I (2007) Scales on motivational regulation of student learning: adapted and extended version of the Academic Self-Regulation Questionnaire (SRQ-A) from Ryan & Cornell. Wissenschaftliche Beiträge Nr. 1, Alpen-Adria-Universität (in German)
Muthén LK, Muthén BO (1998–2018) Mplus User’s Guide. 8 Edn. Muthén & Muthén, Los Angeles
Pekrun R (1993) Development of academic task motivation in secondary school: an expectancy-value approach. Zeitschrift für Pädagogische Psychologie 7:87–97 (in German)
Penk C, Pöhlmann C, Roppelt A (2014) The role of test-taking motivation for students’ performance in low-stakes assessments: an investigation of school-track-specific differences. Large Scale Assess Educ 2:5
Pohlmann B, Möller J, Streblow L (2005) Factors affecting achievement behavior in physical education. Zeitschrift für Sportpsychologie 12:127–134. https://doi.org/10.1026/1612-5010.12.4.127 (in German)
Preacher KJ (2008) Latent growth curve modeling. Quantitative applications in the social sciences, vol 157. Sage Publ, Los Angeles
Prenoveau JM (2016) Specifying and interpreting latent state-trait models with autoregression: an illustration. Struct Equ Model 23:731–749. https://doi.org/10.1080/10705511.2016.1186550
R Development Core Team (2008) R: a language and environment for statistical computing. R Foundation for Statistical Computing, Vienna, Austria. http://www.R-project.org
Ryan RM, Connell JP (1989) Perceived locus of causality and internalization: examining reasons for acting in two domains. J Pers Soc Psychol 57:749–761
Sageder J (1995) Research report on the development of an questionnaire to assess students study and learning behaviour. Department for Education and Educational Psychology, Johannes Kepler University Linz (in German)
Sundre DL (2007) The Student Opinion Scale (SOS). A measure of examinee motivation. Test manual. https://www.researchgate.net/publication/238741273_The_Student_Opinion_Scale_SOS
Thelk AD, Sundre DL, Horst SJ, Finney SJ (2009) Motivation matters: using the student opinion scale to make valid inferences about student performance. J Gen Educ 58:129–151. https://doi.org/10.1353/jge.0.0047
Tisak J, Tisak MS (2000) Permanency and ephemerality of psychological measures with application to organizational commitment. Psychol Methods 5:175–198. https://doi.org/10.1037/1082-989X.5.2.175
Tucker-Drob EM, Briley DA, Engelhardt LE, Mann FD, Harden KP (2016) Genetically-mediated associations between measures of childhood character and academic achievement. J Pers Soc Psychol 111:790–815. https://doi.org/10.1037/pspp0000098
Urhahne D (2008) Seven kinds of learning motivation. An overview of central concept of research. Psychologische Rundschau 59:150–166. https://doi.org/10.1026/0033-3042.59.3.150 (in German)
Wigfield A, Eccles JS (2000) expectancy-value theory of achievement motivation. Contemp Educ Psychol 25:68–81
Wigfield A, Eccles JS, Yoon KS, Harold RD, Arbreton A et al (1997) Changes in children’s competence beliefs and subjective task values across the elementary school years: a three-year study. J Educ Psychol 89:451–69
Wise SL, DeMars CE (2005) Low examinee effort in low-stakes assessment: problems and potential solutions. Educ Assess 10:1–17. https://doi.org/10.1207/s15326977ea1001_1
Yeo G, Neal A (2008) Subjective cognitive effort: a model of states, traits, and time. J Appl Psychol 93:617–631. https://doi.org/10.1037/0021-9010.93.3.617
Authors’ contributions
Both authors contributed substantially to this work. CH designed the study and handled the data collection. CH and JW developed the theoretical framework in consultation together. CH ran statistical analyses in consultation with JW. Both authors structured, wrote and revised the manuscript at all stages. Both authors read and approved the final manuscript.
Acknowledgements
Not applicable.
Competing interests
The authors declare that they have no competing interests.
Availability of data and materials
Please contact the first author for further details on the data set.
Consent for publication
The authors agree to publish the manuscript in case of acceptance.
Ethics approval and consent to participate
The study and data collection was carried out in accordance with the ethical guidelines of Johannes Kepler University of Linz. Participation was voluntarily.
Funding
Not applicable.
Publisher’s Note
Springer Nature remains neutral with regard to jurisdictional claims in published maps and institutional affiliations.
Author information
Authors and Affiliations
Corresponding author
Appendix
Appendix
Rights and permissions
Open Access This article is distributed under the terms of the Creative Commons Attribution 4.0 International License (http://creativecommons.org/licenses/by/4.0/), which permits unrestricted use, distribution, and reproduction in any medium, provided you give appropriate credit to the original author(s) and the source, provide a link to the Creative Commons license, and indicate if changes were made.
About this article

Cite this article
Helm, C., Warwas, J. Psychological determinants of test motivation in low-stakes test situations: A longitudinal study of singletrait–multistate models in accounting. Empirical Res Voc Ed Train 10, 13 (2018). https://doi.org/10.1186/s40461-018-0074-7
Received:
Accepted:
Published:
DOI: https://doi.org/10.1186/s40461-018-0074-7