
Abstract
Clustering, a traditional machine learning method, plays a significant role in data analysis. Most clustering algorithms depend on a predetermined exact number of clusters, whereas, in practice, clusters are usually unpredictable. Although the Elbow method is one of the most commonly used methods to discriminate the optimal cluster number, the discriminant of the number of clusters depends on the manual identification of the elbow points on the visualization curve. Thus, experienced analysts cannot clearly identify the elbow point from the plotted curve when the plotted curve is fairly smooth. To solve this problem, a new elbow point discriminant method is proposed to yield a statistical metric that estimates an optimal cluster number when clustering on a dataset. First, the average degree of distortion obtained by the Elbow method is normalized to the range of 0 to 10. Second, the normalized results are used to calculate the cosine of intersection angles between elbow points. Third, this calculated cosine of intersection angles and the arccosine theorem are used to compute the intersection angles between elbow points. Finally, the index of the above-computed minimal intersection angles between elbow points is used as the estimated potential optimal cluster number. The experimental results based on simulated datasets and a well-known public dataset (Iris Dataset) demonstrated that the estimated optimal cluster number obtained by our newly proposed method is better than the widely used Silhouette method.
1 Introduction
In terms of machine learning, clustering, as a common technique for statistical data analysis, has been widely used in a large number of fields and holds an important status in unsupervised learning. Data analysts can use clustering to exploit the potential optimal cluster number for the analyzed dataset containing similar characteristics. The area of clustering has produced various implementations over the last decade. An exhaustive list refers to [1]. However, determining the optimal cluster number is always a difficult part, especially for a dataset with little prior knowledge. A fair percentage of the partitional clustering algorithm (e.g., K-means [2], K-medoids [3], and PAM [4]) need to specify the cluster number as the input parameter in advance of training. Hierarchical clustering (e.g., BIRCH [5], CURE [6], and ROCK [7]) and clustering algorithms based on fuzzy theory (e.g., FCM [8], FCS [9], and MM [10]) also have disadvantages in the number of clusters that need to be preset.
In addition, estimating the potential optimal cluster number for the analyzed dataset is a fundamental issue in clustering algorithms. With little prior information on the properties of a dataset, there are still a few methods to evaluate the potential optimal cluster number. As the oldest visual method for estimating the potential optimal cluster number for the analyzed dataset, the Elbow method [11, 12] usually needs to perform the K-means on the same dataset with a contiguous cluster number range: [1, L] (L is an integer greater than 1). Then, compute the sum of squared errors (SSE) for each user-specified cluster number k, plotting a curve of the SSE against each cluster number k. Finally, the experienced analysts estimate the optimum elbow point by analyzing the above-mentioned curve, that is, the optimum elbow point corresponds to the estimated potential optimal cluster number with high probability. However, when the relationship curve of the SSE against each value of k is a fairly smooth curve, the experienced analysts cannot clearly identify the ‘elbow’ from the plotted curve. That is, the Elbow method does not always work well to determine the optimal cluster number [13]. The cluster number obtained by using the Elbow method is a subjective result because it is a visual method [14], and does not provide a measurement metric to show which elbow point is explicitly the optimum. To overcome these shortcomings of the Elbow method, a quantitative discriminant method is proposed to work out a straightforward value as the estimated potential optimal cluster number for the analyzed dataset. Our newly proposed method is based on the Elbow method [15], K-means++ [16], MinMaxScaler [17] for normalization, and cosine of interaction angle of elbow as criteria.
In the rest of the sections, a brief overview of the related work and our proposed method are introduced in Sect. 2. In Sect. 3, the simulated datasets and a common benchmark dataset are used to test and verify the validity of our newly proposed method. Finally, the conclusions are provided in Sect. 4.
2 Methods
2.1 Related work
A major challenge is how to obtain the optimal cluster number in cluster analysis. The potential optimal cluster number needs to be provided in advance for the partitioning clustering algorithms, which is an important input parameter. In some cases, there is sufficient priori information about the dataset, so that the potential appropriate cluster number can be intuitively assigned to these partitioning clustering algorithms. However, in general, there is not enough priori information to determine an appropriate cluster number that can be specified in advance for the value of an important input parameter of these partitioning clustering algorithms. Therefore, it is necessary to estimate a potential optimal cluster number for the dataset to be analyzed. In the case of an unknown number of clusters, the first step is usually to specify a potential estimated range for the optimal cluster number in almost all methods to distinguish the optimal cluster number.
Many methods have been used to determine the cluster number of the analyzed dataset [18]. The Elbow and Silhouette methods are the two state-of-the-art methods used to identify the correct cluster number in the dataset [19]. The Elbow method [13] is the oldest method to distinguish the potential optimal cluster number for the analyzed dataset, whose basic idea is to specify K = 2 as the initial optimal cluster number K, and then keeps increasing K by step 1 to the maximal specified for the estimated potential optimal cluster number, and finally distinguish the potential optimal cluster number K corresponding to the plateau. The optimal cluster number K is distinguished by the fact that before reaching K, the cost rapidly decreases to the called cost peak value, and after exceeding K, it continues to increase with the called cost peak value almost unchanged, as shown in Fig. 1a with an explicit elbow point. Meanwhile, the optimal cluster number corresponding to the elbow point depends on the manmade selection. There is, however, a problem with the Elbow method in that the elbow point cannot be unambiguously distinguished by the experienced analysts when the plotted curve is fairly smooth, as shown in Fig. 1b, with an ambiguous elbow point.

a A visual curve with an explicit elbow point. b A visual curve being fairly smooth with an ambiguous elbow point
The Silhouette method [20, 21] is another well-known method with decent performance to estimate the potential optimal cluster number, which uses the average distance between one data point and others in the same cluster and the average distance among different clusters to score the clustering result. The metric of scoring of this method is named the silhouette coefficient (S), and S is defined as \(\frac{{\left( {b - a} \right)}}{{\max \left( {a,b} \right)}}\), where a and b represent the mean intra-cluster distance and the mean nearest-cluster distance, respectively. The interval of the S values was \(- 1 \le S \le 1\). A value of S closer to 1 indicates that a sample is better clustered, and if it is closer to − 1, the sample should be categorized into another cluster. This method is preferable for estimating the potential optimal cluster number. Meanwhile, the silhouette index can evaluate the best number of clusters in most cases for many distinct scenarios [22].
Meanwhile, the gap statistic methods can be used to identify the optimal cluster number in the analyzed dataset. The gap statistic method [23, 24] obtains the potential optimal cluster number through the following steps: It obtains the output of K-means, compares the change in intra-cluster dispersion, and obtains the appropriate cluster number. Hierarchical agglomerative clustering (HAC [25]) usually performs the K-means N times, obtains the dendrogram, and obtains the potential optimal cluster number [26]. The v-fold cross-validation method [27] is an approach to estimate the most appropriate cluster number depending on the K-means [28] clustering algorithm or expectation maximum (EM). At the same time, there are some methods based on information criteria, which can also be used to score the most appropriate cluster number [29]. For example, the Akaike information criterion (AIC) or Bayesian information criterion (BIC) is used in the X-means clustering to discriminate the potential optimal cluster number for the analyzed dataset [30]. Rate distortion theory can be used to estimate the cluster number for a wide range of simulated and actual datasets, and the underlying structure can be identified, which is given a theoretical justification [4]. Smyth [31] presented a cross-validation approach to score the potential optimal cluster number depending on the cluster stability. This approach tends to repeatedly generate similar clusters for the dataset originating from the same data source. That is, this approach is stable for input randomization [14].
However, as mentioned above, when the elbow point is ambiguous, the Elbow method will become unreliable. To overcome the shortcomings of the Elbow method, we present a new method to calculate a clear metric to indicate the elbow point for the potential optimal cluster number.
2.2 Proposed method
2.2.1 Principle
Given a dataset X with N points and K clusters, we define \(X = \left\{ {x_{1} ,x_{2} , \ldots ,x_{N} } \right\}\) and, \({\mathbb{C}} = \left\{ {C_{1} ,C_{2} , \ldots ,C_{K} } \right\}\), where \(C_{i}\) represents the ith individual cluster and \(K \le N\). The centroids of K-clustering of X are defined as, \(\left\{ {\mu_{1} ,\mu_{2} , \ldots ,\mu_{K} } \right\}\), where \(\mu_{k} = \frac{1}{{\left| {C_{k} } \right|}}\sum\nolimits_{{x_{i} \in C_{k} }} {x_{i} }\), \(\mu_{k}\) is the centroids corresponding to the cluster \(C_{k}\), \(k \in \left[ {1,2, \ldots ,K} \right]\), and \(\left| {C_{k} } \right|\) represents the number of entries of the cluster \(C_{k}\).
Theoretically, data points in the same cluster should have maximum similarity, while data points in different clusters should have very different properties and/or features. Meanwhile, the similarity between different data objects is measured by the distance between them. In addition, the sum of the squared Euclidean distances (SSE) is one of the most widely used cluster distance criteria to measure the sum of the square distance between each data point belonging to the same cluster and its cluster centroid \(\left\{ {\mu_{1} ,\mu_{2} , \ldots ,\mu_{K} } \right\}\):
The result of SSE divided by N is called the mean distortion (MD) of the dataset X of N points, given by
Note that MDi represents the mean distortion of the dataset X of N points, which has i as the cluster number for the analyzed dataset X. Meanwhile, the clustering error is usually quantified using SSE. In addition, we transform each MD using the MinMaxScaler and scale each transformed value N(md) to a given range [0-10], which is an empirical value. We consider the complete normalized SSE data space,\(N = \left[ {n_{1} ,n_{2} , \ldots ,n_{k} } \right]\), where \(n_{i}\) has the definition:
For two given adjacent two-dimensional data points i and j, where \(i,j \in \left[ {1,2, \ldots ,K} \right]\); n and k represent the first dimension and the second dimension of the two-dimensional data point, respectively, and we can use formula (4) to calculate the Euclidean distance between them.
Let us assume that the three adjacent two-dimensional data points \(i,j,k \in \left[ {1,2, \ldots ,K} \right]\) create an angle \(\angle \alpha_{j}\), and we can obtain the value of the angle \(\angle \alpha_{j}\) using formula (5).
In the space of \(\alpha \in \left[ {\alpha_{1} ,\alpha_{2} , \ldots ,\alpha_{k - 2} } \right]\), we use the smallest \(\alpha\), indicating the optimum elbow point corresponding to the estimated potential optimal cluster number with high probability, and call the index of minimal \(\alpha\) as, Kopt which is considered as the estimated optimal cluster number for the analyzed dataset.
2.2.2 Implementation
For a given dataset X with N points, the estimated optimal cluster number is defined as Kopt. The first step is to initialize an estimated range of Kopt as \(\left[ {K_{\min } ,K_{\max } } \right]\). Note that the values of Kmin and Kmax are 1 and, \({\text{int}} \left( {\sqrt n } \right) + 1\), respectively (\({\text{int}} \left( \right)\) means taking the integer portion). The second step is to compute the sum of squared errors (SSE) with formula (1), mean distortion by formula (2), and normalized value with formula (3), for each value of \(k \in \left[ {K_{{{\text{min}}}} ,K_{{{\text{max}}}} } \right]\). The procedure is described in Algorithm 1.
We make additional comments about algorithm 1 as follows:
-
Line 3: We take k as the input parameters, fit the dataset X to K-means + + , and start training.
-
Lines 4–5: After training, we assign the centroids and the related sub-clusters to \(\mu\) and \({\mathbb{C}}\).
-
Lines 6–8: This is the computation of normalized mean distortion value for each value of k and appending to N(md).

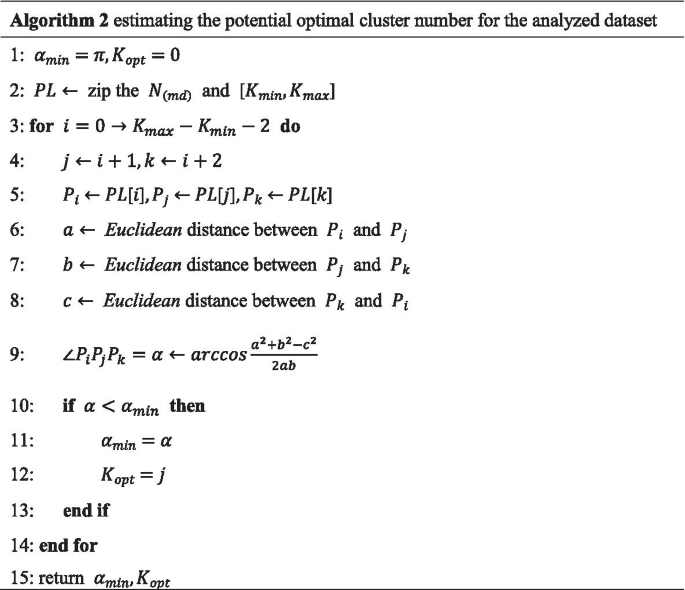
Then, we can use formula (4) to calculate the Euclidean distance between two adjacent points and find Kopt with formula (5). The algorithm of our method is described in detail in Algorithm 2.
The following additional comments can be made about algorithm 2:
-
Line 2: For convenience of calculations, we zip \(N_{{\left( {{\text{md}}} \right)}}\) and \(\left[ {K_{{{\text{min}}}} ,K_{{{\text{max}}}} } \right]\) and form a list of two-dimensional data point pairs, PL, that is,\({\text{PL}} = \left\{ {N_{{\left( {{\text{md}}} \right)0}} ,K_{{{\text{min}}}} ,N_{{\left( {{\text{md}}} \right)1}} ,K_{{{\text{min}}}} + 1, \ldots } \right\}.\)
-
Lines 4–5: Considered that the three adjacent points, where the point \(P_{i}\) is \(N_{{\left( {{\text{md}}} \right)i}} ,K_{i}\), \(P_{j}\) is \(N_{{\left( {{\text{md}}} \right)j}} ,K_{j}\), and \(P_{k}\) is \(N_{{\left( {{\text{md}}} \right)k}} ,K_{k}\).
-
Lines 6–8: Compute the Euclidean distance between, \(P_{i}\), \(P_{j}\) and \(P_{k}\) and represented by a, b, and c.
-
Line 9: Compute the angle formed by every three adjacent two-dimensional data point pairs in PL using formula (5).
-
Lines 10–13: Find the minimal angle (\(\alpha_{{{\text{min}}}}\)), and the index of optimal cluster number as Kopt.
3 Results and discussion
Four experiments were conducted to test and verify the validity of our proposed method on the test datasets, including two kinds of datasets: the simulated dataset and a public benchmark dataset with Iris dataset. Experimental results based on these datasets are plotted in a figure with three subplots, namely Scatter, Silhouette, and Proposed. Scatter is the scatter plot of the experimental dataset; Silhouette is the plot of the silhouette coefficient score and the corresponding cluster number. The Proposed is a plot of the cluster number and the corresponding \(\alpha\) produced by our proposed method.
The above-mentioned experiments were tested on a server with 12 Xeon CPUs E5-2620 v2 @ 2.10 GHz cores, 32 GB memory, 2 TB hard disk, and 1 GeForce GTX TITAN X (rev a1). It ran the CentOS version 7.3.1611 (core) with the Python version 2.7.12, Anaconda version 4.2.0 (64 bits), and the sklearn [32] version 0.16.0.
3.1 Simulated datasets
The three simulated datasets followed a uniform distribution, the multivariate normal distribution, and mixed the uniform distribution and multivariate normal distribution.
The uniformly distributed dataset (Dataset1) has 2000 two-dimensional points attributed to four clusters. It is straightforward to exploit the function of Numpy, numpy.random.uniform(low, high, size). Table 1 lists the parameters used by the uniform function.
The multivariate normal dataset (Dataset2) also includes 2000 two-dimensional points and four clusters, which are generated by the function of numpy.random.multivariate_normal(mean,cov,size). The parameters used are listed in Table 2.
Dataset (Dataset3) mixed uniformly distributed and multivariate normal also includes 2000 two-dimensional points and four clusters (two clusters obeyed uniform distribution and two clusters obeyed uniform distribution and two multivariate distributions), which are generated by the function of numpy.random.uniform and numpy.random.multivariate_normal. The parameters of the two clusters obeyed uniform distribution are listed in Table 2 as Cluster Nos. 3 and 4. The parameters of the two multivariate distributions are listed in Table 2 as Cluster Nos. 1 and 2.
Because there are only four clusters in the aforementioned simulated datasets, we specify the estimated range of Kopt as [1, 10]. The execution times of the two methods based on Dataset1, Dataset2, and Dataset2 are listed in Table 3.
The experimental results of the simulated dataset that followed a uniform distribution are plotted in Fig. 2. From the subplot of Silhouette in Fig. 2, we know that the estimated potential optimal cluster number obtained by the Silhouette method is four, which is consistent with the real cluster number and corresponds to the maximum of the silhouette score. In addition, as is evident from the subplot of the Proposed in Fig. 2, the obtained optimal cluster number corresponding to the minimum of the angle is four, which is also consistent with the real cluster number. Therefore, for a uniform distribution, the proposed method and Silhouette method can both obtain the optimal cluster number that is consistent with the real cluster number.

Experimental results of the simulated Dataset1 obeyed uniform distribution with four clusters
With respect to the multivariate normal distribution, the proposed method yields the same optimal cluster number. However, Silhouette method does not give the correct cluster number, as shown in Fig. 3. In addition, for the dataset with mixed uniform distribution and multivariate normal distribution, the proposed method yields the same optimal cluster number. However, Silhouette method does not give the correct cluster number for this case, as shown in Fig. 4.

Experimental results of the simulated Dataset2 obeyed multivariate normal distribution with four clusters

Experimental results of the simulated Dataset3 obeyed uniform and multivariate normal distribution with four clusters
3.2 Common benchmark datasets
For the field of machine learning, Iris Dataset is perhaps the best known dataset as a common benchmark dataset. It is a multivariate dataset containing 150 instances with four features (sepal length, sepal width, petal length, and petal width) and three species (Iris Setosa, Iris Versicolor, and Iris Virginia). In this evaluation, we split the Iris dataset into two datasets, namely the sepal and petal datasets. The sepal dataset (Dataset4) is comprised of sepal length and sepal width, and the petal dataset (Dataset5) is comprised of petal length and petal width. There are only three clusters in Iris. Therefore, we initialize the search range of Kopt as [1, 10].
On the two subsets of Iris, as shown in Figs. 5 and 6, Silhouette method does not outline the maximal silhouette coefficient score indicating the optimal cluster number. Rather, the proposed method shows a clear minimum of the angle at index 3, which is consistent with the real cluster number in Iris. The execution times of the two methods based on Dataset4 and Dataset5 are listed in Table 3.

Experimental results on three Iris species only with sepal length and sepal width

Experimental results on three Iris species only with petal length and petal width
Therefore, as shown in the above case, the optimal cluster number obtained by the proposed method is consistent with the real cluster number contained in the dataset and shows better performance than the Silhouette method.
From Table 3, we know that the execution time of the proposed method is faster than the Silhouette method for the experimental dataset. Meanwhile, for the figures based on the experimental results, we know that the optimal cluster number obtained by the proposed method is more consistent with the real cluster number contained in the dataset than the Silhouette method.
4 Conclusions
The Elbow method can be one of the oldest methods to distinguish the potential optimal cluster number for the dataset to be analyzed, which is a visual method. Using the Elbow method, the estimated potential optimal cluster number for the analyzed dataset is somewhat subjective. This is because if there is a clear elbow in the line chart, then the elbow point corresponds to the estimated optimal cluster number with high probability, whereas if there is no clear elbow in the line chart, then the Elbow method does not work well.
A new method for distinguishing the potential optimal or most appropriate cluster number used in the clustering algorithm is proposed in this paper. We exploited the interaction angle of the adjacent elbow point as a criterion to work out a discriminant elbow point. Experimental results demonstrate that the estimated potential optimal cluster number output by our newly proposed method is consistent with the real cluster number and better than the Silhouette method on the same experimental datasets.
The proposed method depends on the estimated range of the cluster number. For each estimated number of clusters, the entire dataset needs to be trained, which increases the computational cost. The clustering algorithm used in this study is K-means++, which is a centroid-based clustering algorithm. What seems certain is that our method can also be applied to other centroid-based clustering algorithms, such as K-means and K-medoids. However, for non-centroid-based clustering algorithms, this may not be the case. The focus of our future work will be to improve the performance and suitability of the proposed method to estimate the potential optimal cluster number.
Availability of data and materials
The two simulated datasets followed a uniform distribution and the multivariate normal distribution. The simulated dataset that followed a uniform distribution was generated by the function of Numpy, numpy.random.uniform(low, high, size) with parameters as listed in Table 1. The simulated dataset that followed a multivariate normal distribution was generated by the function of numpy.random.multivariate_normal(mean,cov,size) with parameters as listed in Table 2. The common benchmark dataset (Iris Dataset) is available at https://archive.ics.uci.edu/ml/machine-learning-databases/iris/.
Abbreviations
- PAM:
-
Partitioning around medoids
- BIRCH:
-
Balanced iterative reducing and clustering using hierarchies
- CURE:
-
Clustering Using REpresentatives
- ROCK:
-
Robust clustering algorithm for categorical attributes
- FCM:
-
Fuzzy C-means clustering algorithm
- FCS:
-
Fuzzy c-shells
- MM:
-
Mountain method
- SSE:
-
Sum of squared errors
- HAC:
-
Hierarchical agglomerative clustering
- EM:
-
Expectation maximum
- AIC:
-
Akaike information criterion
- BIC:
-
Bayesian information criterion
- MD:
-
Mean distortion
References
D. Xu, Y. Tian, A comprehensive survey of clustering algorithms. Ann. Data Sci. 2(2), 165–193 (2015). https://doi.org/10.1007/s40745-015-0040-1
A.K. Jain, Data clustering: 50 years beyond K-means. Pattern Recognit. Lett. 31(8), 651–666 (2010). https://doi.org/10.1016/j.patrec.2009.09.011
H.-S. Park, C.-H. Jun, A simple and fast algorithm for K-medoids clustering. Expert Syst. Appl. 36(2), 3336–3341 (2009). https://doi.org/10.1016/j.eswa.2008.01.039
C.A. Sugar, G.M. James, Finding the number of clusters in a dataset. J. Am. Stat. Assoc. 98(463), 750–763 (2003). https://doi.org/10.1198/016214503000000666
T. Zhang, R. Ramakrishnan, M. Livny, BIRCH: an efficient data clustering method for very large databases. ACM SIGMOD Record. 25(2), 103–114 (1996). https://doi.org/10.1145/235968.233324
S. Guha, R. Rastogi, K. Shim, Cure: an efficient clustering algorithm for large databases. Inf. Syst. 26(1), 35–58 (2001). https://doi.org/10.1016/S0306-4379(01)00008-4
S. Guha, R. Rastogi, K. Shim, Rock: a robust clustering algorithm for categorical attributes. Inf. Syst. 25(5), 345–366 (2000). https://doi.org/10.1016/S0306-4379(00)00022-3
J.C. Bezdek, R. Ehrlich, W. Full, FCM: the fuzzy c-means clustering algorithm. Comput. Geosci. 10(2–3), 191–203 (1984). https://doi.org/10.1016/0098-3004(84)90020-7
R.N. Dave, K. Bhaswan, Adaptive fuzzy c-shells clustering and detection of ellipses. IEEE Trans. Neural Netw. 3(5), 643–662 (1992). https://doi.org/10.1109/72.159055
R.R. Yager, D.P. Filev, Approximate clustering via the mountain method. IEEE Trans. Syst. Man Cybern. 24(8), 1279–1284 (1994). https://doi.org/10.1109/21.299710
R.L. Thorndike, Who belongs in the family? Psychometrika 18(4), 267–276 (1953). https://doi.org/10.1007/BF02289263
M.A. Syakur, B.K. Khotimah, E.M.S. Rochman, B.D. Satoto, Integration K-means clustering method and elbow method for identification of the best customer profile cluster. IOP Conf. Ser. Mater. Sci. Eng. 335, 012017 (2018). https://doi.org/10.1088/1757-899X/336/1/012017
D.J. Ketchen, C.L. Shook, The application of cluster analysis in strategic management research: an analysis and critique. Strateg. Manag. J. 17(6), 441–458 (1996). https://doi.org/10.1002/(SICI)1097-0266(199606)17:6%3c441::AID-SMJ819%3e3.0.CO;2-G
R. Nainggolan, R. Perangin-angin, E. Simarmata, A. Tarigan, Improved the performance of the K-means cluster using the sum of squared error (SSE) optimized by using the Elbow method. J. Phys: Conf. Ser. 1361, 012015 (2019). https://doi.org/10.1088/1742-6596/1361/1/012015
F. Liu, Y. Deng, Determine the number of unknown targets in open World based on Elbow method. IEEE Trans. Fuzzy Syst. (2020). https://doi.org/10.1109/TFUZZ.2020.2966182
J. Yoder, C. Priebe, Semi-supervised k-means++. J. Stat. Comput. Simul. 87(13), 2597–2608 (2017). https://doi.org/10.1080/00949655.2017.1327588
A. Jain, K. Nandakumar, A. Rose, Score normalization in multimodal biometric systems. Patten Recognit. 38(12), 2270–2285 (2005). https://doi.org/10.1016/j.patcog.2005.01.012
E. Hancer, D. Karaboga, A comprehensive survey of traditional, merge-split and evolutionary approaches proposed for determination of cluster number. Swarm Evol. Comput. 32, 49–67 (2017). https://doi.org/10.1016/j.swevo.2016.06.004
M.A. Masud, J.Z. Huang, C. Wei, J. Wang, I. Khan, M. Zhong, I-nice: a new approach for identifying the number of clusters and initial cluster centres. Inf. Sci. 466, 129–151 (2018). https://doi.org/10.1016/j.ins.2018.07.034
M.Z. Rodriguez, C.H. Comin, D. Casanova, O.M. Bruno, D.R. Amancio, L.D.F. Costa, F.A. Rodrigues, Clustering algorithms: a comparative approach. PLoS ONE 14(1), e0210236 (2019). https://doi.org/10.1371/journal.pone.0210236
P.J. Rousseeuw, Silhouettes: a graphical aid to the interpretation and validation of cluster analysis. J. Comput. Appl. Math. 20, 53–65 (1987). https://doi.org/10.1016/0377-0427(87)90125-7
O. Arbelaitz, I. Gurrutxaga, J. Muguerza, J.M. Pérez, I. Perona, An extensive comparative study of cluster validity indices. Pattern Recognit. 46(1), 243–256 (2013). https://doi.org/10.1016/j.patcog.2012.07.021
R. Tibshirani, G. Walther, T. Hastie, Estimating the number of clusters in a data set via the gap statistic. J. R. Stat. Soc. Ser. B-Stat. Methodol. 63(2), 411–423 (2001). https://doi.org/10.1111/1467-9868.00293
C. Yuan, H. Yang, Research on K-value selection method of K-means clustering algorithm. J.-Multidiscip. Sci. J. 2(2), 226–235 (2019). https://doi.org/10.3390/j2020016
H. Liu, L. Fen, J. Jian, L. Chen, Overlapping community discovery algorithm based on hierarchical agglomerative clustering. Int. J. Pattern Recognit. Artif. Intell. 32(03), 1850008 (2018). https://doi.org/10.1142/S0218001418500088
M. Dash, H. Liu, P. Scheuermann, K.L. Tan, Fast hierarchical clustering and its validation. Data Knowl. Eng. 44(1), 109–138 (2003). https://doi.org/10.1016/S0169-023X(02)00138-6
P. Burman, A comparative study of ordinary cross-validation, v-fold cross-validation and the repeated learning-testing methods. Biometrika 76(3), 503–514 (1989). https://doi.org/10.1093/biomet/76.3.503
S.-S. Yu, S.-W. Chu, C.-M. Wang, Y.-K. Chan, T.-C. Chang, Two improved k-means algorithms. Appl. Soft Comput. 68, 747–755 (2018). https://doi.org/10.1016/j.asoc.2017.08.032
D. Posada, T.R. Buckley, Model selection and model averaging in phylogenetics: advantages of Akaike information criterion and Bayesian approaches over likelihood ratio tests. Syst. Biol. 53(5), 793–808 (2004). https://doi.org/10.1080/10635150490522304
J. Ding, V. Tarokh, Y. Yang, Bridging AIC and BIC: a new criterion for autoregression. IEEE Trans. Inf. Theory 64(6), 4024–4043 (2018). https://doi.org/10.1109/TIT.2017.2717599
R. Xu, D. Wunschll, Survey of clustering algorithms. IEEE Trans. Neural Netw. 16(3), 645–678 (2005). https://doi.org/10.1109/TNN.2005.845141
J. Hao, T. Ho, machine learning made easy: a review of Scikit-learn package in python programming language. J. Educ. Behav. Stat. 44(3), 348–361 (2019). https://doi.org/10.3102/1076998619832248
Acknowledgements
None.
Funding
This work was supported by the National Key Research and Development Program of China (2018YFA0404603), Yunnan Key Research and Development Program (2018IA054), Yunnan Applied Basic Research Project (2017FB001), the Key Science and Technology Program of Henan Province (202102210152, 212102210611), Henan Province Higher Education Teaching Reform Research and Practice Project (2019SJGLX386), and the Research and Cultivation Fund Project of Anyang Normal University (AYNUKPY-2019-24, AYNUKPY-2020-25).
Author information
Authors and Affiliations
Contributions
CS introduced the idea of this work and finished partial English writing. SW designed the algorithms and completed partial English writing. BW, WW, and HL coded to implement the algorithms and finished partial English writing. JL completed the experiments and completed a partial English writing. CS and JL contributed equally to this work, and they are co-first authors. All authors read and approved the final manuscript.
Corresponding author
Ethics declarations
Competing interests
The authors declare that they have no competing interests.
Additional information
Publisher's Note
Springer Nature remains neutral with regard to jurisdictional claims in published maps and institutional affiliations.
Rights and permissions
Open Access This article is licensed under a Creative Commons Attribution 4.0 International License, which permits use, sharing, adaptation, distribution and reproduction in any medium or format, as long as you give appropriate credit to the original author(s) and the source, provide a link to the Creative Commons licence, and indicate if changes were made. The images or other third party material in this article are included in the article's Creative Commons licence, unless indicated otherwise in a credit line to the material. If material is not included in the article's Creative Commons licence and your intended use is not permitted by statutory regulation or exceeds the permitted use, you will need to obtain permission directly from the copyright holder. To view a copy of this licence, visit http://creativecommons.org/licenses/by/4.0/.
About this article

Cite this article
Shi, C., Wei, B., Wei, S. et al. A quantitative discriminant method of elbow point for the optimal number of clusters in clustering algorithm. J Wireless Com Network 2021, 31 (2021). https://doi.org/10.1186/s13638-021-01910-w
Received:
Accepted:
Published:
DOI: https://doi.org/10.1186/s13638-021-01910-w