
Abstract
Spinocerebellar ataxia type 3 (SCA3) is a rare neurodegenerative disorder resulting from an aberrant expansion of a polyglutamine stretch in the ataxin-3 protein and subsequent neuronal death. The underlying intracellular signaling pathways are currently unknown. We applied the Reverse-phase Protein MicroArray (RPMA) technology to assess the levels of 50 signaling proteins (in phosphorylated and total forms) using three in vitro and in vivo models expressing expanded ataxin-3: (i) human embryonic kidney (HEK293T) cells stably transfected with human ataxin-3 constructs, (ii) mouse embryonic fibroblasts (MEF) from SCA3 transgenic mice, and (iii) whole brains from SCA3 transgenic mice. All three models demonstrated a high degree of similarity sharing a subset of phosphorylated proteins involved in the PI3K/AKT/GSK3/mTOR pathway. Expanded ataxin-3 strongly interfered (by stimulation or suppression) with normal ataxin-3 signaling consistent with the pathogenic role of the polyglutamine expansion. In comparison with normal ataxin-3, expanded ataxin-3 caused a pro-survival stimulation of the ERK pathway along with reduced pro-apoptotic and transcriptional responses.
Introduction
Spinocerebellar ataxia type 3 (SCA3), also known as Machado-Joseph disease (MJD), is an autosomal dominantly inherited ataxia which is characterized by deficits in gait, movement, and coordination linked to a CAG repeat expansion in the ATXN3 gene and a concordant polyglutamine expansion in the ataxin-3 protein. Therefore, SCA3 falls into the group of polyglutamine disorders which includes Huntington’s disease and within the broader category of neurodegenerative disorders to include Parkinson’s disease and Alzheimer’s disease [55].
Although the gene responsible for SCA3 was discovered more than 25 years ago [25], the cellular signaling pathways of neurodegeneration remain elusive. Protein activation mapping and identification of critical nodes in the signaling network represent central approaches required to elucidate the underlying nature of the disease and for the development of effective therapeutic interventions. Traditional low-throughput methods of protein analysis such as Western blotting and immunohistochemistry have served an important role in understanding SCA3, but their well-known limitations include difficulty in analyzing complex signaling networks at the level of protein expression and post-translational modification. On the other hand, DNA microarrays and RNA sequencing provide readouts restricted to the mRNA level with little follow-up on how these changes manifest at the protein level. While RNA encodes information about cellular status, proteins are the ultimate drivers of the cellular machinery serving in key mechanism of cell signaling through post-translational modifications. Reversible protein phosphorylation, especially on serine, threonine or tyrosine residues, is one of the most important and well-studied post-translational regulating protein function and signal transmission [5]. However, phosphorylated proteins are notoriously difficult to analyze on a mass scale by traditional methods such as Western blot especially when small amounts of samples need to be tested with high sensitivity.
To that end we utilized the Reverse-phase Protein MicroArray (RPMA) technology, a sensitive, quantitative, and high-throughput immunoassay to analyze protein and post-translational modification at the level of total protein abundance or specific phosphorylation. In the RPMA analysis a few microliters of cell lysates are printed onto nitrocellulose slides which are then probed with the protein-specific antibodies. The amount of bound antibody is quantitated using a highly sensitive colorimetric or fluorometric procedure [60].
Here, we present an RPMA-based analysis of three SCA3 models including human embryonic kidney (HEK293T) cells stably-transfected with plasmids encoding different ataxin-3 variants with normal (15 glutamines, HEK15Q) and expanded polyglutamine repeat (148 glutamines, HEK148Q), mouse embryonic fibroblasts (MEF) from ataxin-3 148Q (MEF148Q, [12]) and ataxin-3 knockout mice (MEFKO, [44]), and whole-brain samples from a SCA3 mouse model (CamKII/SCA377Q, [11, 43, 48]). Our data provide assessment of the phosphoprotein signaling landscape contributing to the development of the disease phenotype in the context of different SCA3 models and suggest that the RPMA technology can be broadly applied to characterize neurodegenerative disorders thus assisting in biomarker identification and developing novel targets for therapy.
Materials and methods
Cell and Mouse models of SCA3
HEK293T cells were stably transfected with a plasmid expressing green fluorescent protein (GFP)-tagged ataxin-3 with 15 glutamines (HEK15Q), ataxin-3 with 148 glutamines (HEK148Q), or empty GFP plasmid (HEKempty) as control. Transfected cells were sorted by FACS and highly expressing cells were collected for analysis [48]. Mouse embryonic fibroblasts (MEF) were isolated as described in Hübener et al. [24] from the ataxin-3 148Q (MEF148Q), ataxin-3 knockout (MEFKO), and wild-type mice (MEFwt). The ataxin-3 knockout mouse line is described in Schmitt et al. [45] and the ataxin-3 148Q mouse line was generated as described in Boy et al. [12]. C57BL/6 wild-type mice were used to isolate control fibroblasts. The CamKII/SCA377Q mouse model is described in Schmidt et al. [44]. Mice were sacrificed at 12 months of age.
RPMA analysis
For Reverse-phase Protein MicroArray Analysis (RPMA, [60]) we used an established and pre-validated set of 50 different antibodies [38, 39] directed against the total and phosphorylated forms of signaling proteins which cover a wide array of signaling pathways relevant to the cell fate including apoptosis, survival, and autophagy (Additional file 1: Tables S1 and S2). All antibodies were validated for specificity prior to testing. RPMA analysis was performed according to Einspahr et al. [17]. Samples were printed onto the array slides at concentrations 100%, 50%, 25%, and 12.5% in duplicates and prepared for staining by treating with Reblot (Chemicon, CA). Slides were treated with blocking solution I-block (Applied Biosystems, MA) at 2 g/l and 0.5% Tween-20 in PBS. The total protein amounts loaded on the chip were estimated using SYPRO Ruby Protein Blot Stain (Invitrogen, CA) according to the manufacturer’s instructions and imaged on the NovaRay scanner (Alpha Innotech, CA). Blocked arrays were stained with antibodies on an automated slide stainer (Dako, CA) using the Catalyzed Signal Amplification System kit according to the manufacturer’s recommendation (Dako, CA). A signal was generated using streptavidin-conjugated IRDye 680 (LI-COR Biosciences, NE). Stained slides were scanned on the NovaRay scanner. The TIF images of the antibody and SYPRO-stained slides were analyzed using MicroVigene v2.9.9.9 software (VigeneTech, MA). Briefly, MicroVigene performed spot finding, local background subtraction (using local and slide average intensity), replicate averaging and total protein normalization, producing a single value for each sample at each dilution. All signal values produced for data analysis were at least two standard deviations above background. All four dilutions of each sample were analyzed for linear regression and only measurements which met linearity were kept for analysis. For each sample and antibody, SCA3 samples were normalized to the corresponding protein concentration in the wild-type sample at the same dilution and averaged across all available dilutions. These were then analyzed by the t-test to determine the p-value for each averaged protein level. All differences compared to wild-type found significant with 95% confidence are shown in Additional file 1: Table S1.
Western blot analysis
Western blot analyses were essentially performed as described previously [48, 56] with 30 µg of protein loaded from each sample on Tris–glycine or Bis–Tris SDS polyacrylamide gels and separated electrophoretically. Afterwards, proteins were transferred to 0.2 µm nitrocellulose membranes (GE Healthcare, Dornstadt, Germany) using the respective transfer buffer. After blocking, the membranes were incubated with the same primary antibodies as used in the RPMA analysis (for details and dilutions see Additional file 1: Table S2) diluted in TBST at 4 °C overnight. Following the incubation with a fluorescence- or HRP-labeled secondary antibody, membranes were detected using an Odyssey Fc Imager (LI-COR Biosciences, Bad Homburg, Germany) and quantified using the Image Studio Software (LI-COR) or ImageJ. Statistical analyses were performed using GraphPad Prism 8.40 for Windows (GraphPad Software, San Diego, CA). Data is shown as arithmetic means ± SEM. Outliers were identified using Grubbs’ test with alpha = 0.05. Statistical significance of data sets was determined using Student’s t-test and p-values less than or equal to 0.05 were considered as statistically significant.
Results
There is mounting evidence that inflammatory signaling cascades are involved in the development and pathogenesis of SCA3 [4, 15]. We thus generated a snapshot of the SCA3 degenerative landscape via a large screen of phosphorylated signaling proteins which act as principal regulators of signal transduction across multiple signaling networks. The list of tested proteins and their levels relative to corresponding controls are presented in Additional file 1: Table S1.
Our results show that the overexpression of both normal and expanded ataxin-3 has a profound effect on several signaling pathways. Of significant note is the phosphatidyl inositol 3-phosphate kinase (PI3K) cell survival pathway. Phosphorylation of its key members (Table 1) is robustly altered.
Major signaling responses altered by expanded ataxin-3 in SCA3 models
Although we applied a wide range of cellular and animal models, the sets of altered signaling proteins in response to expanded ataxin-3 were found to be rather similar (Fig. 1a). Pairwise comparison of the HEK148Q and MEF148Q cell responses in spite of the different species origin (human vs. mouse) revealed only four proteins as non-shared low responders (with levels changed by less than ± 0.1). As expected, brain of the SCA3 transgenic mouse model was more distant from the cultured cells: 16 responses were found unique for the MEF148Q cells or the analyzed brains. All three models shared signaling nodes of major cell pathways important for cell fate (Table 1). A fragment of the signaling network illustrating these results is shown in Fig. 1b. Comparison of the HEK15Q and HEK148Q cells identified changes due to the polyglutamine expansion within ataxin-3 (Additional file 1: Table S1). Among the prominent differences (above the ± 20% threshold) between these cells the polyglutamine expansion caused reduction of the levels of apoptotic and transcriptional regulators (Table 1). The increased responses included the pro-survival ERK-p70S6K pathway (Table 1).

Altered signaling proteins in models of SCA3. a Signaling proteins responding to expanded ataxin-3 expression in the indicated SCA3 models (HEK148Q, MEF148Q and brain of SCA3 mouse model) in comparison to the respective controls (HEKwt, MEFwt, and control brain). In all three different SCA3 disease models, we observed a significant overlap of dysregulated signaling proteins. For clarity, only the proteins displaying alterations of more that ± 20% relative to the corresponding control levels are shown. b A fragment of the signaling network illustrating connections between shared proteins in a
Effect of wild-type ataxin-3 and the polyglutamine expansion
To evaluate the contribution of normal (non-expanded) ataxin-3 in the cell signaling we analyzed cells lacking ataxin-3 (MEFKO) in comparison with wild-type cells (MEFwt). The proteins were grouped together based on their stimulation or suppression relative to the wild-type cells (Fig. 2). It is typically assumed that the proteins in the knock-out (KO) cells would display opposite effects (suppression vs. stimulation) compared to wild-type cells. We therefore compared the reaction towards the loss of ataxin-3 (MEFKO vs. MEFwt) with the reaction induced by the polyglutamine expansion within ataxin-3 (MEF148Q vs. MEFwt). Figure 2 shows that a number of responses induced by the presence of expanded ataxin-3 were suppressed by the presence of wild-type ataxin-3 (stimulated in MEFKO cell). On the other hand, a large group of responses including the major cell fate proteins were stimulated by the presence of wild-type ataxin-3 (suppressed in MEFKO cells) but suppressed in cells expressing expanded ataxin-3. No responses stimulated by wild-type ataxin-3 were found to be further amplified by the presence of expanded ataxin-3. As expected, the SCA3 whole brain samples demonstrated a certain degree of specificity compared to the MEF148Q cells (Fig. 2). In spite of these specifics the results from both models demonstrated that the expanded ataxin-3 strongly interfered with the normal ataxin-3 signaling.

Side-by side comparison of signaling in reaction to the presence of wild-type and expanded ataxin-3 in MEF cells (a) and SCA3 mouse brain (b). Shown are the relative protein levels of signaling proteins altered upon the presence of wild-type ataxin-3 (comparison of MEFKO with MEFwt) or expanded ataxin-3 (MEF148Q vs. MEFwt) in MEF cells (a) as well as in mouse brain (SCA3 vs. wt mouse brain, b). Proteins are grouped according their stimulation (↑) / suppression (↓) by wild-type (ataxin-3wt) and expanded ataxin-3 (ataxin-3exp). For clarity, only the protein pairs displaying alterations of more that ± 20% in one or both proteins relative to the corresponding control levels are shown
To corroborate the results of the RPMA analysis, we validated a selection of marker proteins found dysregulated in the mouse brain samples by Western blot, demonstrating a strong consistency with our high-throughput approach (Fig. 3a, b). This includes the downregulation of the phosphorylated forms of AKT, ERK, GSK3 and JNK. To further dissect the apparently downregulated AKT/mTOR pathway, we investigated additional proteins namely total and phosphorylated levels of mTOR itself and its upstream inhibitor AMPKβ1. Western blot analysis showed a trend towards a reduction of the AKT and p70S6K-mediated activating phosphorylation of mTOR at Ser2448, and significantly increased levels of pSer108-AMPKb1 (Fig. 3c, d), both confirming rather inhibitory effects on the mTOR pathway by the expression of expanded ataxin-3 [21,23].
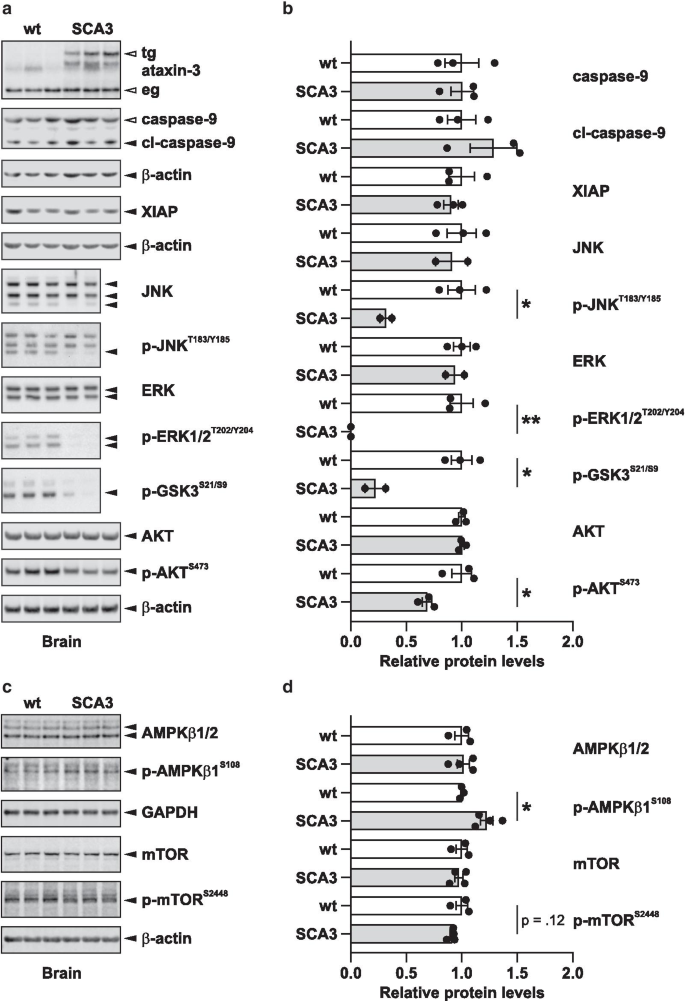
Confirmation of RPMA data by Western blot analysis. For validation of RPMA data, Western blot analyses of mouse brains of SCA3 and wild-type mice were performed for selected targets. The same antibodies as in the RPMA analysis were used. Blot images (a) and graphs (b) showing their quantification. Quantified bands are marked with a black arrow. β-actin was used as loading control. In the SCA3 mouse model, transgenic expanded ataxin-3 (tg) is detected in addition to the endogenous ataxin-3 (eg). In addition, total and phosphorylated levels of AMPKβ1 and mTOR were analyzed (c and d) to further dissect the impact of expanded ataxin-3 on the mTOR signaling pathway. The bars correspond to means (wt n = 3, SCA3 n = 2–4) ± SEM. Statistical significant differences (t-test) are marked (*, p < 0.05; **, p < 0.01)
Discussion
Polyglutamine expanded ataxin-3 decreases pro-survival signaling via the AKT pathway
The serine/threonine-protein kinase AKT is a key protein kinase involved in survival and growth with physiological links to neurological disorders. The levels of Serine 473-phosphorylated AKT (p-AKTS473), representing an active form of this protein, were decreased in all three models indicating a drop in pro-survival signaling due to the 148Q expansion. AKT signaling cascades include a number of proteins previously implicated in SCA3 such as GSK3, FOXO and mTOR [4, 18, 27, 42]. An increased susceptibility towards oxidative stress (via FOXO4 and SOD2) was suggested to be a potential contributor to neuronal cell death in SCA3 and AKT, ERK, and JNK are all among the known kinases which target FOXOs and contribute to their activation and localization [4, 27].
Upstream of AKT lies the PI3K pathway. This pathway is balanced and activated by the tumor suppressor phosphatase and tensin homolog PTEN. In our analyses, we observed an increase of both the total and phosphorylated levels of PTEN in SCA3 mouse brain samples and a decrease in HEK293T and MEF cells expressing expanded ataxin-3. Interestingly, ataxin-3 is suggested to be responsible for repressing PTEN transcription in cancer [42] which further emphasizes the importance of the AKT signaling pathway in disease progression.
Altered GSK3 signaling in SCA3 models
Importantly, we also saw a reduction of phosphorylated glycogen synthase kinase 3 (GSK3) shared among all SCA3 models investigated. GSK3α and GSK3β are constitutively active, proline-directed serine/threonine kinases involved in a variety of cellular processes including glycogen metabolism [58], gene transcription [50], apoptosis [51] and microtubule stability [3, 13]. GSK3 is known to play a role in several neurological disorders [30]. With respect to SCA3 it is known to phosphorylate ataxin-3 and thus regulate its aggregation propensity [19, 37]. Furthermore, the phosphorylation of ataxin-3 by GSK3 contributes to its nuclear translocation [37], a process increasing the toxicity of expanded ataxin-3 and required for the manifestation of the disease [9, 48]. The reduction of GSK3 may therefore reflect a protective mechanism against this increase of toxicity.
GSK3 was also the first reported substrate of AKT and the two are functionally similar. GSK3 is a strong promoter of Toll-like receptors-induced production of proinflammatory cytokines such as IL-6 which was found to be altered in SCA3 patient samples [18]. AKT is known to exert an inhibitory role on GSK3 via phosphorylation of Ser21/Ser9 (p-GSK3S21/S9) [22]. Consistent with the observed decrease in p-AKTS473, we detected a reduced inhibitory phosphorylation of GSK3 in HEK293T and MEF cells expressing expanded ataxin-3.
Furthermore, GSK3 is required for activation of STAT proteins in astrocytes, microglia and macrophages [8]. Accordingly, our SCA3 cell models showed changes in seven proteins compared to two STAT proteins in the brain samples, while MEFKO cells showed profound alterations of STAT levels in response to the absence of ataxin-3 (Additional file 1: Table S1 and Fig. 2). These observations reinforce the link between ataxin-3 and GSK3 and should prompt the field to consider the role of insulin and glucose in brain homeostasis and neuronal degeneration as a metabolic syndrome. It is noteworthy, that GSK3 inhibitors recently gained attention in terms of their potential for diabetes, cancer, and neurodegeneration [33] highlighting a therapeutic potential for SCA3.
SCA3 models exhibit alterations of AKT-associated factors
Tumor suppressor protein p53 is considered the “guardian of the genome” [28] because of its important role in determining cell fate. A tight regulation of p53 is critical in maintaining homeostasis and keeping a balance between its cancer-suppressive and age-promoting functions [10]. The interaction between p53 and GSK3 is hypothesized to be involved in aggregate clearance and neurodegeneration: the Alzheimer’s disease hypothesis suggests that under normal conditions, GSK3 is involved in keeping p53 levels low while under conditions of cellular stress (e.g. aggregation) p53 is stabilized, proteasomal function declines, and levels of p53 increase [40, 51]. We observed that the levels of activated p-p53S15 increased in MEF148Q cells and in SCA3 mouse brains in contrast to its suppression by wild-type ataxin-3 (increase in MEFKO cells). Recently, p53 was identified as a substrate of wild-type ataxin-3 and the polyglutamine expansion was associated to increased p53-dependent neuronal death [31]. One can hypothesize that SCA3 and other neurodegenerative disorders involve a positive feedback between proteasomal degradation, aggregation, GSK3 activation, and increased p53 levels. Besides p53, the strongest increase in MEF cells both as reaction to the expression of expanded ataxin-3 and to the loss of ataxin-3 were observed for HSP90 and SUMO 2/3. Both proteins were implicated before in SCA3 [2, 47] and our results further stress their relevance. Ataxin-3 is SUMOylated and the SUMOylation of ataxin-3 regulates its function [2]. Moreover, the inhibition of HSP90 turned out as promising therapeutic strategy in a mouse model for SCA3 [47].
The extracellular signal regulated kinase ERK is a member of the MAPK pathway. It is a key protein lying at the intersection of proliferation, differentiation, and survival [29]. It was previously shown that ERK is responsible for the calcium-dependent phosphorylation of ataxin-1 [26] and the downregulation of ERK reduces levels of ataxin-1 and suppresses neurodegeneration in Drosophila and mice [20]. ERK is further able to act on downstream pathways of AKT and mTOR via control of the p70S6 kinase and the S6 ribosomal subunit [34]. The phosphorylated ERK (p-ERK1/2T202/Y204) was reduced in all models tested including the knockout MEFKO cells. The latter suggested that the stimulating effect of wild-type ataxin-3 in regulating p-ERK1/2T202/Y204 levels was abrogated by the polyglutamine expansion. We also found that similar to ERK, another MAPK, stress-activated p-JNKT183/Y185 displayed a strong inhibition by the expanded ataxin-3.
An additional target of AKT is the endothelial nitric oxide synthase (eNOS) which catalyzes the production of nitric oxide. We observed a decrease in eNOS activation by ataxin-3 148Q in all models similar to ERK. The phosphorylation of eNOS at Ser1177 (p-eNOSS1177) by AKT activates this enzyme. In terms of neurodegeneration, alterations in eNOS have been linked to blood–brain barrier integrity [6] which directly points to the importance of peripheral inflammation in propagation of CNS dysfunction.
Indication of impaired mTOR activation in SCA3 models
P70S6 kinase is a mitogen-activated kinase affected by ERK signaling downstream of mTOR and AKT. It phosphorylates the S6 protein of the 40S ribosomal subunit (RPS6) and thus controls mRNA translation. The phosphorylation of RPS6 is commonly used as a readout of mTOR activation [36] and other work suggests that the state of Ser240/Ser244 phosphorylation of RPS6 (p-RPS6S240/S244) can be used to estimate the neuronal activity state of striatal cholinergic interneurons [7]. We observed decreased levels of p-RPS6S240/S244 in all models and MEFKO cells indicating a negative impact of the presence of expanded ataxin-3 on mTOR activation. Moreover, an interaction between ataxin-3 and the kinase (ribosomal protein S6 kinase alpha-1) phosphorylating RPS6 has also been suggested [1, 52].
Along with p70S6K, another important neuron-related kinase connected with mTOR is Src. Our data indicate an increased activity of Src in our models: The Tyr527 phosphorylation site of Src (p-SrcY527) which renders the enzyme less active was decreased in HEK148Q, MEF148Q and mouse brain samples. Although first identified as a proto-oncogene, Src was found to be expressed in differentiated, post-mitotic neurons and is important for neuronal differentiation and neurite outgrowth with the capability to control ion channel activity and synaptic transmission [43]. Src is involved in the intracellular release of calcium stores from the endoplasmic reticulum [53]. Concordant with our data, a reduced phophorylation of Src has also been observed in a different mouse model of SCA3 [59]. Moreover, Src has been linked to Huntington’s disease where expression of polyglutamine-expanded huntingtin activates Src and ultimately promotes neuronal death induced by glutamate. In this line, Src was found to be altered in ataxin-2 patient fibroblasts and ataxin-2 knockout lines [16].
Further supporting our RPMA analysis, we observed using Western blots a trend towards reduced phosphorylation of mTOR at Ser2448, an activating modification mediated by AKT and p70S6K [23], and significantly increased levels of Ser108-phosphorylated AMPKβ1, which acts as an upstream inhibitor of mTOR [21, 54]. These observations support the indication of rather impaired mTOR activation. In an earlier study, the inhibition of mTOR led to an induction of autophagy thereby ameliorating the toxicity of expanded ataxin-3 in SCA3 mice [35]. Consistently, increasing phosphorylated AMPK by the administration of cordycepin in SCA3 cells and mice was shown to have neuroprotective effects via activation of autophagy and lowering mutant protein synthesis [32]. Thus, these findings suggest that the detected lowering of mTOR activation in our models may represent a rescue mechanism.
Pro-survival, anti-apoptotic contribution of polyglutamine expansion
Apoptosis and necrosis are believed to be the two major death pathways for neurons [14]. Regarding apoptosis, it was suggested that initiator or executor caspases are activated in neurodegenerative diseases [57]. In Huntington’s disease, neurons positive for caspase-3 die quickly but for those with aggregates trigger cellular quiescence, deactivate apoptosis but activate delayed necrosis, which supports the argument that high-ordered aggregates or inclusions might be protective [41]. In our analysis, the levels of cleaved caspases including caspase-3, -7, and -9 were increased in SCA3 mouse brains while either decreased or not altered in MEF and HEK293T cell models. Seemingly contradictory behavior was displayed by the pro-apoptotic FADD (activated in MEF148Q cells, but suppressed in our other models). Bcl-2 family members (Bcl-xL, Bax, Bad, Bim) as well as FLIP, SHIP and XIAP were uniformly either reduced or not altered. Recent data showed that the ratio of Bcl2/Bax was decreased in SCA3 patients compared to controls, suggesting that the ratios and balances of these proteins are perhaps more important than their absolute values [61]. Consistent with this, comparison of normal vs. expanded ataxin-3 showed that the presence of the polyglutamine expansion within ataxin-3 provided a pro-survival and anti-apoptotic contribution. Since the cell behavior is dictated by a superposition of multiple signals, the overall balance in favor of survival or death outcomes cannot be predicted with certainty based on our data only. Nevertheless, it seems reasonable to conclude that, depending on the particular cellular context, the expanded ataxin-3 can provide a widespread anti-apoptotic impact on cell signaling.
Conclusion
In our work, we used RPMA analysis to characterize the altered signaling networks observed upon ataxin-3 expansion in both in vitro and in vivo models. It is important to consider that these models have large differences such as innate expression of ataxin-3, overexpression of ataxin-3, have different levels of sensitivity to expanded protein and are derived from different tissues. We employed a set of antibodies which cover various pathways across the cellular landscape including inflammation, survival, energy metabolism, growth, transcription, translation, apoptosis, mitochondrial integrity and autophagy. We suggest that elucidating these signaling cascades is integral in understanding the function of ataxin-3 in health and disease. We demonstrate that across our models, AKT/mTOR pathway targets (Table 1) are significantly altered. Our results revealed alterations shared between tested models as well as the unique differences providing new perspectives on altered signaling in SCA3. In future studies, the role of the altered pathways needs to be correlated to the disease progression and outcome in SCA3 patients and animal models [46, 49]. This analysis can shed light on future targets for research and pharmaceutical development by painting a clearer picture of the neurodegenerative landscape.
Availability of data and materials
All data generated or analyzed during this study are included in this published article and its supplementary information.
Change history
22 May 2021
The Open Access funding statement has been updated in this publication.
Abbreviations
- SCA3:
-
Spinocerebellar ataxia type 3
- MJD:
-
Machado-Joseph disease
- AKT:
-
AKT8 virus oncogene cellular homolog
- ATF:
-
Activating transcription factor 2
- Bad:
-
Bcl-2-associated agonist of cell death
- Bax:
-
Bcl-2-associated X protein
- Bcl-xL:
-
B-cell lymphoma-extra large
- Bim:
-
Bcl-2-interacting mediator
- cl:
-
Prefix cl- denotes a cleaved form
- CREB:
-
CAMP response element-binding protein
- eNOS:
-
Endothelial nitric oxide synthase
- ERK:
-
Extracellular signal-regulated kinase
- FADD:
-
Fas-associated protein with death domain
- FLIP:
-
FLICE (Caspase-8) inhibitory protein
- FOXO:
-
Forkhead box protein class O4
- GAPDH:
-
Glyceraldehyde-3-phosphate dehydrogenase
- GSK:
-
Glycogen synthase kinase
- HSP27:
-
Heat shock protein 27
- HSP90:
-
Heat shock protein 90
- IκBα:
-
Inhibitor of NF-κB alpha subunit
- IL-10:
-
Interleukin 10
- JNK:
-
Jun N-terminal kinase
- mTOR:
-
Mammalian target of rapamycin
- NF-κB:
-
Nuclear factor κB
- p-:
-
Prefix p- denotes a phosphorylated protein
- p53:
-
Tumor suppressor protein that protects from DNA damage
- p70S6K:
-
Phosphoprotein 70 ribosomal protein S6 kinase
- PARP:
-
Poly(ADP-ribose) polymerase
- PTEN:
-
Phosphatase and tensin homolog deleted on chromosome 10
- RPMA:
-
Reverse-phase Protein MicroArray
- RPS6:
-
Small-subunit ribosomal protein S6
- SHIP:
-
Src homology 2 (SH2) domain-containing inositol phosphatase
- Src:
-
Rous sarcoma oncogene cellular homolog
- STAT:
-
Signal transducer and activator of transcription
- SUMO:
-
Small ubiquitin-like modifier
- TNF-R1:
-
Tumor necrosis factor receptor 1
- wt:
-
Wild-type
- XIAP:
-
X-linked inhibitor of apoptosis
References
Almeida B, Fernandes S, Abreu IA, Macedo-Ribeiro S. Trinucleotide repeats: a structural perspective. Front Neurol. 2013;4:76. https://doi.org/10.3389/fneur.2013.00076.
Almeida B, Abreu IA, Matos CA, Fraga JS, Fernandes S, Macedo MG, Gutiérrez-Gallego R, Pereira PJ, Carvalho AL, Macedo-Ribeiro S. SUMOylation of the brain-predominant Ataxin-3 isoform modulates its interaction with p97. Biochem Biophys Acta. 2015;1852(9):1950–9. https://doi.org/10.1016/j.bbadis.2015.06.010.
Anderton BH, Betts J, Blackstock WP, Brion JP, Chapman S, Connell J, et al. Sites of phosphorylation in tau and factors affecting their regulation. Biochem Soc Symp. 2001;67:73–80.
Araujo J, Breuer P, Dieringer S, Krauss S, Dorn S, Zimmermann K, et al. FOXO4-dependent upregulation of superoxide dismutase-2 in response to oxidative stress is impaired in spinocerebellar ataxia type 3. Hum Mol Genet. 2011;20(15):2928–41. https://doi.org/10.1093/hmg/ddr197.
Ardito F, Giuliani M, Perrone D, Troiano G, Lo Muzio L. The crucial role of protein phosphorylation in cell signaling and its use as targeted therapy (Review). Int J Mol Med. 2017;40(2):271–80. https://doi.org/10.3892/ijmm.2017.3036.
Beauchesne É, Desjardins P, Hazell AS, Butterworth RF. ENOS gene deletion restores blood-brain barrier integrity and attenuates neurodegeneration in the thiamine-deficient mouse brain. J Neurochem. 2009;111(2):452–9. https://doi.org/10.1111/j.1471-4159.2009.06338.x.
Bertran-Gonzalez J, Chieng BC, Laurent V, Valjent E, Balleine BW. Striatal cholinergic interneurons display activity-related phosphorylation of ribosomal protein S6. PLoS ONE. 2012;7:12. https://doi.org/10.1371/journal.pone.0053195.
Beurel E, Jope RS. Differential regulation of STAT family members by glycogen synthase kinase-3. J Biol Chem. 2008;283(32):21934–44. https://doi.org/10.1074/jbc.M802481200.
Bichelmeier U, Schmidt T, Hübener J, Boy J, Rüttiger L, Häbig K, Poths S, Bonin M, Knipper M, Schmidt WJ, Wilbertz J, Wolburg H, Laccone F, Riess O. Nuclear localization of ataxin-3 is required for the manifestation of symptoms in SCA3: in vivo evidence. J Neurosci. 2007;27(28):7418–28. https://doi.org/10.1523/JNEUROSCI.4540-06.2007.
Bieging KT, Mello SS, Attardi LD. Unravelling mechanisms of p53-mediated tumour suppression. Nat Rev Cancer. 2014;14(5):359–70. https://doi.org/10.1038/nrc3711.
Boy J, Schmidt T, Wolburg H, Mack A, Nuber S, Böttcher M, et al. Reversibility of symptoms in a conditional mouse model of spinocerebellar ataxia type 3. Human Mol Genetics. 2009;18(22):4282–95. https://doi.org/10.1093/hmg/ddp381.
Boy J, Schmidt T, Schumann U, Grasshoff U, Unser S, Holzmann C, et al. A transgenic mouse model of spinocerebellar ataxia type 3 resembling late disease onset and gender-specific instability of CAG repeats. Neurobiol Dis. 2010;37(2):284–93. https://doi.org/10.1016/j.nbd.2009.08.002.
Brion JP, Anderton BH, Authelet M, Dayanandan R, Leroy K, Lovestone S, et al. Neurofibrillary tangles and tau phosphorylation. Biochem Soc Symp. 2001;67:81–8.
Chi H, Chang H-Y, Sang T-K. Neuronal Cell Death Mechanisms in Major Neurodegenerative Diseases. Int J Mol Sci. 2018;19(10):3082. https://doi.org/10.3390/ijms19103082.
Chou A-H, Lin A-C, Hong K-Y, Hu S-H, Chen Y-L, Chen J-Y, et al. p53 activation mediates polyglutamine-expanded ataxin-3 upregulation of Bax expression in cerebellar and pontine nuclei neurons. Neurochem Int. 2011;58(2):145–52. https://doi.org/10.1016/j.neuint.2010.11.005.
Drost J, Nonis D, Eich F, Leske O, Damrath E, Brunt ER, et al. Ataxin-2 modulates the levels of Grb2 and SRC but not ras signaling. J Mol Neurosci. 2013;51(1):68–81. https://doi.org/10.1007/s12031-012-9949-4.
Einspahr JG, Calvert V, Alberts DS, Curiel-Lewandrowski C, Warneke J, Krouse R, et al. Functional protein pathway activation mapping of the progression of normal skin to squamous cell carcinoma. Cancer Prev Res. 2012;5(3):403–13. https://doi.org/10.1158/1940-6207.CAPR-11-0427.
Evert BO, Schelhaas J, Fleischer H, de Vos R, a I., Brunt, E. R., Stenzel, W., , et al. Neuronal intranuclear inclusions, dysregulation of cytokine expression and cell death in spinocerebellar ataxia type 3. Clin Neuropathol. 2006;25(6):272–81.
Fei E, Jia N, Zhang T, Ma X, Wang H, Liu C, et al. Phosphorylation of ataxin-3 by glycogen synthase kinase 3β at serine 256 regulates the aggregation of ataxin-3. Biochem Biophys Res Commun. 2007;357(2):487–92. https://doi.org/10.1016/j.bbrc.2007.03.160.
Ferrarelli LK. Conserved signals in neurodegeneration. Sci Signal. 2013;6(281):143. https://doi.org/10.1126/scisignal.2004445.
Garcia D, Shaw RJ. AMPK: Mechanisms of Cellular Energy Sensing and Restoration of Metabolic Balance. Mol Cell. 2017;66(6):789–800. https://doi.org/10.1016/j.molcel.2017.05.032.
Hermida MA, Dinesh Kumar J, Leslie NR. GSK3 and its interactions with the PI3K/AKT/mTOR signalling network. Adv Biol Regul. 2017;65:5–15. https://doi.org/10.1016/j.jbior.2017.06.003.
Hoeffer CA, Klann E. mTOR signaling: at the crossroads of plasticity, memory and disease. Trends Neurosci. 2010;33(2):67–75. https://doi.org/10.1016/j.tins.2009.11.003.
Hübener J, Vauti F, Funke C, Wolburg H, Ye Y, Schmidt T, et al. N-terminal ataxin-3 causes neurological symptoms with inclusions, endoplasmic reticulum stress and ribosomal dislocation. Brain. 2011;134(7):1925–42. https://doi.org/10.1093/brain/awr118.
Kawaguchi Y, Okamoto T, Taniwaki M, Aizawa M, Inoue M, Katayama S, et al. CAG expansions in a novel gene for Machado-Joseph disease at chromosome 14q321. Nature Genet. 1994;8(3):221–8.
Kaytor MD, Byam CE, Tousey SK, Stevens SD, Zoghbi HY, et al. A cell-based screen for modulators of ataxin-1 phosphorylation. Hum Mol Genet. 2005;14(8):1095–105. https://doi.org/10.1093/hmg/ddi122.
Klotz LO, Sánchez-Ramos C, Prieto-Arroyo I, Urbánek P, Steinbrenner H, Monsalve M. Redox regulation of FoxO transcription factors. Redox Biol. 2015. https://doi.org/10.1016/j.redox.2015.06.019.
Lane DP. Cancer. p53, guardian of the genome. Nature. 1992;358(6381):15–6. https://doi.org/10.1038/358015a0.
Lavoie H, Gagnon J, Therrien M. ERK signalling: a master regulator of cell behaviour, life and fate. Nat Rev Mol Cell Biol. 2020;21(10):607–32. https://doi.org/10.1038/s41580-020-0255-7.
Lei P, Ayton S, Bush AI, Adlard PA. GSK-3 in neurodegenerative diseases. Int J Alzheimer’s Dis. 2011;2011:1–9. https://doi.org/10.4061/2011/189246.
Liu H, Li X, Ning G, Zhu S, Ma X, Liu X, et al. The Machado-Joseph Disease Deubiquitinase Ataxin-3 regulates the stability and apoptotic function of p53. PLoS Biol. 2016;14(11):e2000733. https://doi.org/10.1371/journal.pbio.2000733.
Marcelo A, Brito F, Carmo-Silva S, Matos CA, Alves-Cruzeiro J, Vasconcelos-Ferreira A, Koppenol R, Mendonça L, de Almeida LP, Nóbrega C. Cordycepin activates autophagy through AMPK phosphorylation to reduce abnormalities in Machado-Joseph disease models. Hum Mol Genet. 2019;28(1):51–63. https://doi.org/10.1093/hmg/ddy328.
Maqbool M, Hoda N. GSK3 inhibitors in the therapeutic development of diabetes, cancer and Neurodegeneration: past, present and future. Curr Pharm Des. 2017;23(29):4332–50. https://doi.org/10.2174/1381612823666170714141450.
Mendoza MC, Er EE, Blenis J. The Ras-ERK and PI3K-mTOR pathways: cross-talk and compensation. Trends Biochem Sci. 2011;36(6):320–8. https://doi.org/10.1016/j.tibs.2011.03.006.
Menzies FM, Huebener J, Renna M, Bonin M, Riess O, Rubinsztein DC. Autophagy induction reduces mutant ataxin-3 levels and toxicity in a mouse model of spinocerebellar ataxia type 3. Brain. 2010;133(Pt 1):93–104. https://doi.org/10.1093/brain/awp292.
Meyuhas O. Ribosomal protein S6 phosphorylation. Int Rev Cell Mol Biol. 2015;320:41–73. https://doi.org/10.1016/bs.ircmb.2015.07.006.
Mueller T, Breuer P, Schmitt I, Walter J, Evert BO, Wüllner U. CK2-dependent phosphorylation determines cellular localization and stability of ataxin-3. Hum Mol Genet. 2009;18:3334–43. https://doi.org/10.1093/hmg/ddp274.
Popova TG, Espina V, Zhou W, Mueller C, Liotta L, Popov SG. Whole proteome analysis of mouse lymph nodes in cutaneous anthrax. PLoS ONE. 2014;9(10):e110873. https://doi.org/10.1371/journal.pone.0110873.
Popova TG, Espina V, Liotta LA, Popov SG. Reverse-phase microarray analysis reveals novel targets in lymph nodes of bacillus anthracis spore-challenged mice. PLoS ONE. 2015;10(6):e0129860. https://doi.org/10.1371/journal.pone.0129860.
Proctor CJ, Gray DA. GSK3 and p53 - is there a link in Alzheimer’s disease? Mol Neurodegen. 2010;5(7):1–15. https://doi.org/10.1186/1750-1326-5-7.
Ramdzan YM, Trubetskov MM, Ormsby AR, Newcombe EA, Sui X, Tobin MJ, et al. huntingtin inclusions trigger cellular quiescence, deactivate apoptosis, and lead to delayed necrosis. Cell Reports. 2017;19(5):919–27. https://doi.org/10.1016/j.celrep.2017.04.029.
Sacco JJ, Yau TY, Darling S, Patel V, Liu H, Urbé S, et al. The deubiquitylase Ataxin-3 restricts PTEN transcription in lung cancer cells. Oncogene. 2013. https://doi.org/10.1038/onc.2013.512.
Salter MW, Kalia LV. Src kinases: a hub for NMDA receptor regulation. Nat Rev Neurosci. 2004;5(4):317–28. https://doi.org/10.1038/nrn1368.
Schmidt J, Mayer AK, Bakula D, Freude J, Weber JJ, Weiss A, et al. Vulnerability of frontal brain neurons for the toxicity of expanded ataxin-3. Hum Mol Genet. 2019;28(9):1463–73. https://doi.org/10.1093/hmg/ddy437.
Schmitt I, Linden M, Khazneh H, Evert BO, Breuer P, Klockgether T, et al. Inactivation of the mouse Atxn3 (ataxin-3) gene increases protein ubiquitination. Biochem Biophys Res Commun. 2007;362:734–9. https://doi.org/10.1016/j.bbrc.2007.08.062.
Shi C-SS, Shenderov K, Huang N-NN, Kabat J, Abu-Asab M, Fitzgerald KA, et al. Activation of autophagy by inflammatory signals limits IL-1beta production by targeting ubiquitinated inflammasomes for destruction. Nat Immunol. 2012;13(3):255–63. https://doi.org/10.1038/ni.2215.
Silva-Fernandes A, Duarte-Silva S, Neves-Carvalho A, Amorim M, Soares-Cunha C, Oliveira P, Thirstrup K, Teixeira-Castro A, Maciel P. Chronic treatment with 17-DMAG improves balance and coordination in a new mouse model of Machado-Joseph disease. Neurotherapeutics. 2014;11(2):433–49. https://doi.org/10.1007/s13311-013-0255-9.
Sowa AS, Martin E, Martins IM, Schmidt J, Depping R, Weber JJ, et al. Karyopherin α-3 is a key protein in the pathogenesis of spinocerebellar ataxia type 3 controlling the nuclear localization of ataxin-3. Proc Natl Acad Sci. 2018;115(11):E2624–33. https://doi.org/10.1073/pnas.1716071115.
Spooren A, Kolmus K, Laureys G, Clinckers R, De Keyser J, Haegeman G, et al. Interleukin-6, a mental cytokine. Brain Res Rev. 2011. https://doi.org/10.1016/j.brainresrev.2011.01.002.
Troussard AA, Tan C, Yoganathan TN, Dedhar S. Cell-extracellular matrix interactions stimulate the AP-1 transcription factor in an integrin-linked kinase- and glycogen synthase kinase 3-dependent manner. Mol Cell Biol. 1999;19:7420–7.
Turenne GA, Price BD. Glycogen synthase kinase3 beta phosphorylates serine 33 of p53 and activates p53’s transcriptional activity. BMC Cell Biol. 2001;2:12. https://doi.org/10.1186/1471-2121-2-12.
Vinayagam A, Stelzl U, Foulle R, Plassmann S, Zenkner M, Timm J, et al. A directed protein interaction network for investigating intracellular signal transduction. Sci Signal. 2011;4(189):rs8. https://doi.org/10.1126/scisignal.2001699.
Wang H, Reiser G. The role of the Ca 2+-sensitive tyrosine kinase Pyk2 and Src in thrombin signalling in rat astrocytes. J Neurochem. 2003;84(6):1349–57. https://doi.org/10.1046/j.1471-4159.2003.01637.x.
Warden SM, Richardson C, O’Donnell J Jr, Stapleton D, Kemp BE, Witters LA. Post-translational modifications of the beta-1 subunit of AMP-activated protein kinase affect enzyme activity and cellular localization. Biochem J. 2001;354(Pt 2):275–83. https://doi.org/10.1042/0264-6021:3540275.
Weber JJ, Sowa AS, Binder T, Hübener J. From pathways to targets: understanding the mechanisms behind polyglutamine disease. Biomed Res Int. 2014. https://doi.org/10.1155/2014/701758.
Weber JJ, Haas E, Maringer Y, Hauser S, Casadei NLP, Chishti AH, Riess O, Hübener-Schmid J. Calpain-1 ablation partially rescues disease-associated hallmarks in models of Machado-Joseph disease. Hum Mol Genet. 2020;29(6):892–906. https://doi.org/10.1093/hmg/ddaa010.
Wellington CL, Hayden MR. Caspases and neurodegeneration: on the cutting edge of new therapeutic approaches. Clin Genet. 2000;57(1):1–10. https://doi.org/10.1034/j.1399-0004.2000.570101.x.
Welsh GI, Proud CG. Glycogen synthase kinase-3 is rapidly inactivated in response to insulin and phosphorylates eukaryotic initiation factor eIF-2B. Biochem J. 1993;294(Pt 3):625–9.
Wiatr K, Piasecki P, Marczak Ł, Wojciechowski P, Kurkowiak M, Płoski R, Rydzanicz M, Handschuh L, Jungverdorben J, Brüstle O, Figlerowicz M, Figiel M. Altered levels of proteins and phosphoproteins, in the absence of early causative transcriptional changes, shape the molecular pathogenesis in the brain of young presymptomatic Ki91 SCA3/MJD Mouse. Mol Neurobiol. 2019;56(12):8168–202. https://doi.org/10.1007/s12035-019-01643-4.
Wilson B, Liotta LA, Petricoin E 3rd. Monitoring proteins and protein networks using reverse phase protein arrays. Dis Markers. 2010;28(4):225–32. https://doi.org/10.3233/DMA-2010-0705.
Yang Z, Shi C, Zhou L, Li Y, Yang J, Liu Y, et al. Metabolic profiling reveals biochemical pathways and potential biomarkers of spinocerebellar ataxia 3. Front Mol Neurosci. 2019;12:159. https://doi.org/10.3389/fnmol.2019.00159.
Acknowledgements
We want to thank Virginia Espina for her technical assistance on this project and Ina Schmitt for providing ataxin-3 knockout mice. We further acknowledge support by the Open Access Publishing Fund of the Eberhard Karls University of Tuebingen.
Funding
Open Access funding enabled and organized by Projekt DEAL. The work leading to this invention has received funding from the European Commission’s Seventh Framework Programme FP7/2010 under grant agreement no. 264508 (TreatPolyQ) and the Federal Ministry of Education and Research (PPPT-MJD, grant agreement no. 01GM1309B; SCA-CYP, grant agreement no. 01GM1803) under the umbrella of E-Rare (ERA-Net for Research Programmes on Rare Diseases).
Author information
Authors and Affiliations
Contributions
Conceptualization, ASS and TP; Investigation, ASS, TSP, TH, JJW, JS, PSS; Writing-Original Draft, ASS; Writing-Review & Editing, ASS, JHS, JJW, JS, TS; Supervision, JHS, TS; Funding Acquisition, TS. All authors read and approved the final manuscript.
Corresponding author
Ethics declarations
Ethics approval
The study was carried out in strict accordance with the recommendations presented in the Guide of Care and Use of Laboratory Animals of the University of Tuebingen, Germany. The protocols were approved by the Institutional Animal Care and Use Committee (IACUC) of the University of Tuebingen, Germany.
Consent for publication
Not applicable.
Competing interests
The authors declare that they have no competing interests.
Additional information
Publisher's Note
Springer Nature remains neutral with regard to jurisdictional claims in published maps and institutional affiliations.
Supplementary information
Additional file 1: Table S1.
RPMA analysis of relative protein levels. Table S2. Used antibodies and dilutions.
Rights and permissions
Open Access This article is licensed under a Creative Commons Attribution 4.0 International License, which permits use, sharing, adaptation, distribution and reproduction in any medium or format, as long as you give appropriate credit to the original author(s) and the source, provide a link to the Creative Commons licence, and indicate if changes were made. The images or other third party material in this article are included in the article's Creative Commons licence, unless indicated otherwise in a credit line to the material. If material is not included in the article's Creative Commons licence and your intended use is not permitted by statutory regulation or exceeds the permitted use, you will need to obtain permission directly from the copyright holder. To view a copy of this licence, visit http://creativecommons.org/licenses/by/4.0/. The Creative Commons Public Domain Dedication waiver (http://creativecommons.org/publicdomain/zero/1.0/) applies to the data made available in this article, unless otherwise stated in a credit line to the data.
About this article

Cite this article
Sowa, A.S., Popova, T.G., Harmuth, T. et al. Neurodegenerative phosphoprotein signaling landscape in models of SCA3. Mol Brain 14, 57 (2021). https://doi.org/10.1186/s13041-020-00723-0
Received:
Accepted:
Published:
DOI: https://doi.org/10.1186/s13041-020-00723-0