
Abstract
Background
This study investigated if the evidence on the success of the Pay for Performance (P4P) schemes in healthcare is changing as the schemes continue to evolve by updating a previous systematic review.
Methods
A meta-regression analysis using 116 studies evaluating P4P schemes published between January 2010 to February 2018. The effects of the research design, incentive schemes, use of incentives, and the size of the payment to revenue ratio on the proportion of statically significant effects in each study were examined.
Results
There was evidence of an increase in the range of countries adopting P4P schemes and weak evidence that the proportion of studies with statistically significant effects have increased. Factors hypothesized to influence the success of schemes have not changed. Studies evaluating P4P schemes which made payments for improvement over time, were associated with a lower proportion of statistically significant effects. There was weak evidence of a positive association between the incentives’ size and the proportion of statistically significant effects.
Conclusion
The evidence on the effectiveness of P4P schemes is evolving slowly, with little evidence that lessons are being learned concerning the design and evaluation of P4P schemes.
Background
The use of Pay for Performance (P4P) schemes in healthcare has had its successes and failures. Using financial incentives targeted at healthcare providers to improve value-based healthcare provision is a key policy issue. Many governments and insurers use P4P schemes as a policy lever to change healthcare providers’ behavior to improve value for money in healthcare and make providers accountable. However, numerous literature reviews based on narrative syntheses of evidence have concluded that the evidence on P4P schemes’ impacts is both weak and heterogeneous (see, for instance [1,2,3]). The key reasons proposed for the weak evidence is that schemes have been either poorly designed (insufficient size of incentives, unintended consequences, unclear objectives, crowding out of intrinsic motivation, myopia, multi-tasking concerns, external validity, the scheme is voluntary, gaming), or poorly evaluated (poor study designs where causality cannot be inferred, no account of provider selection into or out of schemes, poor reporting of incentive design, poor reporting of parallel interventions such as performance feedback).
In this paper, we examined whether more recent studies provided improved evidence on the effectiveness of P4P schemes. One may expect that those designing and evaluating P4P schemes are improving how these schemes work and are being assessed. We updated the first meta-regression analysis of the effectiveness of P4P schemes [4] to investigate how more recent studies differed from the previous ones in the overall effects of the P4P schemes, the effects of study design on the reported effectiveness of the P4P schemes, and the effects of the size of incentives as a percentage of total revenue. A larger number of studies evaluating the effects of P4P helped us to increase the precision of the estimates of the effects in a meta-regression analysis and provided new evidence of changes in effects, study designs, and payment designs.
Scott et al. [4] found that an average of 56% of outcome measures per scheme was statistically significantly. Their findings suggested that studies with better study designs, such as Difference-in-Differences (DD) designs, had a lower chance of finding a statistically significant effect. They also provided preliminary evidence that the size of incentives as a proportion of revenue may not be associated with the chance of finding a statistically significantly outcome.
Method
Our method was identical to that used by [4]. The same search strategy (databases and keywords) was extended from studies published between January 2010 and July 2015 (old studies) to studies published between August 2015 and February 2018 (new studies), and the same data were extracted from the new studies. Studies were included if they examined the effectiveness of a scheme on any type of outcome (e.g., costs, utilization, expenditures, quality of care, health outcomes and if incentives were targeted at individuals or groups of medical practitioners or hospitals).Footnote 1
A vote-counting procedure was used to record the proportion of reported effect sizes that were statistically significant (at the 10% level) per study (noting if there were issues of the unit of analysis error and small sample size).Footnote 2 Some studies examined a range of different outcome indicators, each with a reported effect size (i.e., usually the difference in an outcome indicator between an intervention and control group), while others examined the heterogeneity of effect sizes across time or sub-groups of the sample. Each separate effect size was counted when constructing the dependent variable (a proportion) for each study. For example, if a study reported an overall effect size and then analyzed the results separately by gender, then three effect sizes were counted.
A meta-regression analysis was conducted to examine factors associated with the proportion of statistically significant effects in each study, with each published paper as the unit of analysis. A generalized linear model with a logit link function (a fractional logit with a binomial distribution) was used because the dependent variable was a proportion with observations at both extremes of zero and one [7]. The error terms would not be independent if there was more than one study evaluating the same scheme, and so standard errors were clustered at the scheme level.
Our regression models included studies from [4] in addition to the new studies. Our estimates differed slightly from those estimated in [4] since we controlled for additional variables, including publication year, a dummy variable indicating studies from the new review, and the size of the P4P payments as a proportion of the total revenue. This was calculated from studies that reported both the size of the incentive amount and the provider’s total income or revenue. If there was a range of incentive amounts, we used the mid-point in the regression analysis.
Additional features of payment designs were extracted from the included papers and used in the regression models as independent variables, to the extent that they were reported in the papers reviewed. The additional features included whether the scheme included incentives for improvements in both quality and cost or quality alone (an important design innovation as used in shared savings schemes in the US’s Accountable Care Organizations), whether the scheme rewarded for quality improvement over time rather than meeting a threshold at a specific point in time, and how incentives were used by those receiving the incentive payments (physician income, discretionary use, or specific use such as quality improvement initiatives). We also included a categorical variable for the study design used: Difference-in-Difference (DD), Interrupted Time Series (ITS), Randomized Controlled Trial (RCT), and Before-After with regression (BA) as the reference group. Studies with no control groups and studies which did not adjust for covariates were excluded. We further included a dummy variable for schemes in the US where arguably most experimentation has occurred to date, and whether the scheme was in a hospital or primary care setting.
Results
A total of 448 new papers were found, of which 302 papers were included after screening the title and abstract. Of these, 163 were empirical studies, and full-text screening identified 37 new studies that were eligible for inclusion [4].
Table 1 presents a summary of the new studies by the country of the evaluated P4P scheme.Footnote 3 The new studies evaluated 23 different schemes across 12 countries, including schemes in new countries (Afghanistan, Kenya, Sweden, and Tanzania). This finding reflects an increase in the proportion of P4P schemes from countries other than the US (from 23% versus 56%) compared to the studies in [4]. There was also a slightly lower proportion of schemes in new studies, which are conducted in hospitals (25% versus 29.5%).
Table 2 summarizes the overall effects of the schemes evaluated in new studies. The 37 studies across 23 schemes reported on 620 effect sizes (average of 26.95 per scheme and 16.76 per study), of which 53% were statistically significant (53% per scheme; 60% per study). This compared to 46, 56, and 54%, respectively, from [4], suggested a slight increase in the proportion of significant effects, but an overall mixed effects of P4P schemes.
Table 3 suggests that the P4P schemes had mixed effects on the range of outcomes considered. Table 4 shows that countries with the highest proportion of statistically significant effects are Kenya (82%), France (81%), Taiwan (75%), and Tanzania (73%). Only one study, in Afghanistan, showed no effects.
Meta-regression analysis
Table 5 presents the meta-regression analysis using 116 studies evaluating P4P schemes published between January 2010 to February 2018. A full set of descriptive statistics is presented in Additional file 2 Appendix B. The three models in Table 5 had different sample sizes because of the covariates in each model were different.
The first model suggested that the new studies were 11 percentage points more likely to report statistically significant effects, although the estimated coefficient itself was not statistically significant. Studies with DD and RCT designs were respectively 20 and 19 percentage points less likely to report a statistically significant effects compared with the studies with BA with control designs. Studies with ITS design were not statistically different compared with the BA studies. The role of study design in explaining the proportion of statistically significant effects was weaker compared with [4], which reported 24 and 25 percentage points differences for DD and RCT designs, respectively. The proportion of different study designs in the new compared to old review were similar, suggesting that the difference in the effect of study design might be due to the studies with RCT, ITS, and DD designs in the new review having lower proportions of statistically significant effects relative to the studies with BA designs.
Studies evaluating P4P schemes that used incentives for improving both costs and quality (compared to the quality alone) were 11 percentage points more likely to report statistically significant effect sizes. The coefficient was slightly larger than in [4] and statistically significant at the 10% level. This might be due to overall weaker effects from the new studies since none of the new studies examined this type of payment design. Studies evaluating P4P schemes, which rewarded for improvement over time, led to a lower proportion of statistically significant effect sizes.
Scott et al. [4] found that the use of payments for specific purposes (such as payments for investment quality improvement rather than physician income) was associated with a 24 percentage points increase in the proportion of statistically significant effect sizes, but this has fallen to 8 percentage points (Model 2). Of the 23 new schemes included in the review, eight schemes included information on the size of the incentive payments relative to total revenue, ranging from 0.05 to 28% (see Table 6 for more details). Figure 1 shows the unadjusted correlation between the size of payments and the proportion of statistically significant effect sizes, and includes regression lines for old, new, and all studies combined. Studies from the new review showed a stronger negative relationship between the payment size and effectiveness, based on only 11 studies (Table 6). After controlling for other factors in the main regression in Table 5, the results suggested a small positive association between the size of incentives and the proportion of effect sizes statistically significant at the 10% level (Model 3).
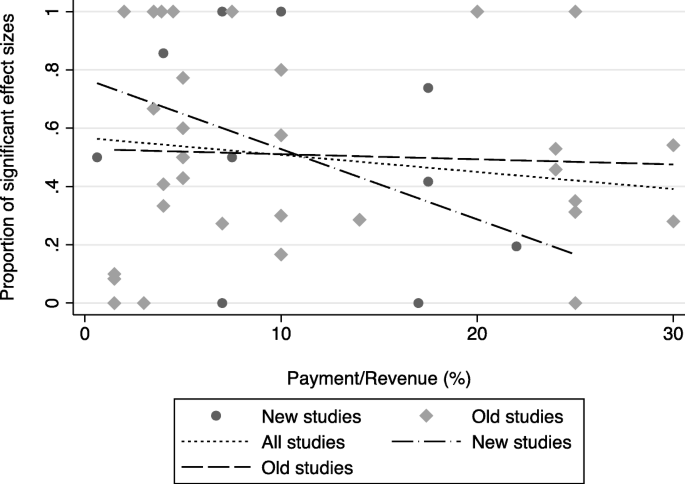
Relationship between the relative size of incentive payments to revenue and portion of significant effect sizes
Discussion
We examined if more recent studies changed the conclusions of the first meta-analysis of P4P literature as P4P schemes continue to evolve. This evolution could be better scheme design, or that the same designs are being used in more settings where our results suggested the latter. Thirty-seven recent studies over a two-year period were added to the existing 80 studies reported in a previous review. The RCT and DD study designs reduced the proportion of statistically significant effects by a lower amount than the previous review. The range of countries in which P4P is being evaluated had increased, with some weak evidence that the proportion of studies with statistically significant effects had increased. The effectiveness of P4P remained mixed overall.
There may be unobserved factors within each scheme associated with both the size of incentive and the likelihood of a statistically significant effects. This variable could be measured with error as some studies present a range rather than an average, of which we took the midpoint.
Despite mounting evidence on the effectiveness of P4P schemes, differences in payment design that were able to be extracted from the studies seemed to play a minor role. However, this meta-analysis masked much heterogeneity in the context, design, and implementation of schemes that were unlikely to be reported in the published studies. Schemes included various diseases, outcome measures, and payment designs, including schemes where the additional funding was used rather than re-allocating existing funding. The choice of outcome indicators may influence the effectiveness of each scheme as some may be more costly for physicians to change than others, while others, such as health outcomes, may be more dependent on patient’s behavior change.
Clustering by the scheme may have accounted for some of this unobserved heterogeneity within schemes. There may also be interactions between different features of payment design, though to examine these would require more clear hypotheses about such interactions and more detailed reporting of payment designs. Data extraction was limited to published studies that vary how they reported the payment designs and study designs. There needs to be improved and more standardized reporting in the literature to enable more general lessons to be learned from P4P schemes that can guide their successful design and implementation [19].
Conclusion
The factors influencing the success of schemes have not changed remarkably. When assessing the studies, none provided any justification for the particular incentive design used, and none stated they were attempting to improve the way incentives were designed compared to previous schemes. This may be because many schemes were designed within a specific local context, and so were constrained in the design they could use and the scheme’s objectives. This could also be because they were constrained in the indicators they use and can collect and report, suggesting that improvements in information and data on quality occur only very slowly over time.
There should be no expectation that incentive designs should necessarily be becoming more complex over time, as this can lead to gaming and ignores the existence of already strong altruistic motives to improve the quality of care. Incentive schemes were also a result of negotiation between providers and payors, and this presented constraints in how incentives were designed. Providers attempted to extract maximum additional income for minimum behavior change, and payors try and achieve the opposite. This could mean that the resulting schemes were relatively weak in terms of incentives’ strength and size. The value of some schemes to policymakers could be more about the increased accountability they seemed to provide, rather than changing behavior and improving value-based healthcare itself. Similarly, although providers were interested in enhancing quality, their preference for self-regulation and autonomy and protection of income, meant that top-down comparisons of performance and potential reductions in earnings were likely to have been unwelcome. Though payment models must support and not hinder value-based healthcare provision, they remained ‘one size fits all’ fairly blunt instruments that needed to be supplemented with other behavior change interventions.
Article summary
Strength and limitations
-
This study updated the first meta-regression analysis of the effectiveness of Pay-for-Performance (P4P) schemes to examine if the factors affecting P4P schemes’ success had changed over time as these schemes evolved.
-
Data extraction was limited to published studies that varied in how they reported the payment and the study designs.
-
This meta-analysis masked much of heterogeneity in the context, design, and implementation of schemes that were unlikely to be reported in the published studies.
Availability of data and materials
The extracted data and the statistical analysis code are available from the corresponding author upon reasonable request.
Notes
We searched “PubMed” and “EconLit” electronic databases for journal articles with the keywords of “value-based purchasing,” “pay for performance,” and “accountable care organisations,” focusing on studies evaluating a P4P scheme or schemes rewarding for cost reductions. We restricted our search to studies in English from high-, middle and low-income countries, and we excluded studies using qualitative data, reviews of the literature, editorials, and opinion pieces, and studies with no control group, and studies which did not adjust for confounders. We included studies in our review if they examined the impact of schemes on any type of outcome (e.g., costs, utilization, expenditures, quality of care, health outcomes), and if the incentives were targeted at individual or groups of medical practitioners or hospitals. We identified 37 new studies.
More details of the new studies are provided in Appendix A. A summary of the pooled new and old studies is presented in Table B.1 in Appendix B.
Abbreviations
- P4P:
-
Pay for performance
- DD:
-
Difference in Differences
- RCT:
-
Randomized Control Trial
- BA:
-
Before-After
- ITS:
-
Interrupted Time Series
- UK:
-
United Kingdom
- US:
-
United States
- QOF:
-
Quality and Outcomes Framework
- SBT:
-
Spontaneous breathing trials
- ACO:
-
Accountable Care Organizations
- GP:
-
General practitioner
- CAPI-ROSP:
-
France’s national P4P scheme for primary care physicians
- QB:
-
Quality Blue
- LDL-C:
-
Low-density lipoprotein cholesterol
- PIN:
-
Physician Integrated Network
- AIC:
-
Akaike information criterion
- BIC:
-
Bayesian information criterion
- ICU:
-
Intensive Care Unit
- MAPD:
-
Medicare Advantage Prescription Drug
- HVBP:
-
Medicare Value-Based Purchasing
- MHIP:
-
Mental Health Information Program
- QIDS:
-
Quality Improvement Demonstration Study
References
Cattel D, Eijkenaar F. Value-Based Provider Payment Initiatives Combining Global Payments With Explicit Quality Incentives: A Systematic Review. Med Care Res Rev. 2019;77(6):2020.
Flodgren G, Eccles MP, Shepperd S, Scott A, Parmelli E, Beyer FR. An overview of reviews evaluating the effectiveness of financial incentives in changing healthcare professional behaviours and patient outcomes. Cochrane Database Syst Rev. 2011. https://doi.org/10.1002/14651858.CD009255.
Van Herck P, De Smedt D, Annemans L, et al. Systematic review: Effects, design choices, and context of pay-for-performance in health care. BMC Health Serv Res. 2010;10:247. https://doi.org/10.1186/1472-6963-10-247.
Scott A, Liu M, Yong J. Financial incentives to encourage value-based health care. Med Care Res Rev. 2018;75:3–32.
Sun X, Liu X, Sun W, Yip W, Wagstaff A, Meng Q. The Impact of a Pay-For-Performance Scheme on Perscription Quality in Rural China. Health Econ. 2016;25:706–22.
Bushman BJ, Wang M. Vote-counting procedures in meta-analysis. The handbook of research synthesis, vol. 236; 1994. p. 193–213.
Papke LE, Wooldridge JM. Econometric methods for fractional response variables with an application to 401 (k) plan participation rates. J Appl Econ. 1996;11:619–32.
Barbash IJ, Pike F, Gunn SR, Seymour CW, Kahn JM. Effects of physician-targeted pay for performance on use of spontaneous breathing trials in mechanically ventilated patients. Am J Respir Crit Care Med. 2017;196:56–63. https://doi.org/10.1164/rccm.201607-1505OC.
Sicsic J, Franc C. Impact assessment of a pay-for-performance program on breast cancer screening in France using micro data. Eur J Health Econ. 2017;18:609–21.
Michel-Lepage A, Ventelou B. The true impact of the French pay-for-performance program on physicians’ benzodiazepines prescription behavior. Eur J Health Econ. 2016;17:723–32. https://doi.org/10.1007/s10198-015-0717-6.
Constantinou P, Sicsic J, Franc C. Effect of pay-for-performance on cervical cancer screening participation in France. Int J Health Econ Manage. 2017;17:181–201.
Sherry TB, Bauhoff S, Mohanan M. Multitasking and Heterogeneous Treatment Effects in Pay-for-Performance in Health Care: Evidence from Rwanda; 2016. https://doi.org/10.2139/ssrn.2170393.
Anselmi L, Binyaruka P, Borghi J. Understanding causal pathways within health systems policy evaluation through mediation analysis: an application to payment for performance (P4P) in Tanzania. Implement Sci. 2017;12:1–18.
Binyaruka P, Robberstad B, Torsvik G, Borghi J. Who benefits from increased service utilisation? Examining the distributional effects of payment for performance in Tanzania. Int J Equity Health. 2018;17:14. https://doi.org/10.1186/s12939-018-0728-x.
Sherry TB. A note on the comparative statics of pay-forperformance in health care. Health Econ. 2016;25:637–44.
Ellegard LM, Dietrichson J, Anell A. Can pay-for-performance to primary care providers stimulate appropriate use of antibiotics? Health economics. May. 2017;2017:39–54. https://doi.org/10.1002/hec.3535.
Ryan AM, Krinsky S, Kontopantelis E, Doran T. Long-term evidence for the effect of pay-for-performance in primary care on mortality in the UK: a population study. Lancet. 2016;388:268–74. https://doi.org/10.1016/S0140-6736(16)00276-2.
Engineer CY, Dale E, Agarwal A, Agarwal A, Alonge O, Edward A, et al. Effectiveness of a pay-for-performance intervention to improve maternal and child health services in Afghanistan: a cluster-randomized trial. Int J Epidemiol. 2016;45:451–9. https://doi.org/10.1093/ije/dyv362.
Ogundeji YK, Sheldon TA, Maynard A. A reporting framework for describing and a typology for categorizing and analyzing the designs of health care pay for performance schemes. BMC Health Serv Res. 2018;18:1–15.
Gleeson S, Kelleher K, Gardner W. Evaluating a pay-for-performance program for Medicaid children in an accountable care organization. JAMA Pediatr. 2016;170:259. https://doi.org/10.1001/jamapediatrics.2015.3809.
Hu T, Decker SL, Chou S-Y. Medicaid pay for performance programs and childhood immunization status. Am J Prev Med. 2016;50:S51–7. https://doi.org/10.1016/j.amepre.2016.01.012.
Bastian ND, Kang H, Nembhard HB, Bloschichak A, Griffin PM. The impact of a pay-for-performance program on central line–associated blood stream infections in Pennsylvania. Hosp Top. 2016;94:8–14. https://doi.org/10.1080/00185868.2015.1130542.
Asch DA, Troxel AB, Stewart WF, Sequist TD, Jones JB, Hirsch AMG, et al. Effect of financial incentives to physicians, patients, or both on lipid levels: a randomized clinical trial. JAMA - Journal of the American Medical Association. 2015;314:1926–35.
Vermeulen MJ, Stukel TA, Boozary AS, Guttmann A, Schull MJ. The Effect of Pay for Performance in the Emergency Department on Patient Waiting Times and Quality of Care in Ontario, Canada: A Difference-in-Differences Analysis. Annals of Emergency Medicine. 2016;67:496–505.e7. doi:https://doi.org/10.1016/j.annemergmed.2015.06.028.
Lapointe-Shaw L, Mamdani M, Luo J, Austin PC, Ivers NM, Redelmeier DA, et al. Effectiveness of a financial incentive to physicians for timely follow-up after hospital discharge: a population-based time series analysis. CMAJ. 2017;189:E1224–9.
Rudoler D, de Oliveira C, Cheng J, Kurdyak P. Payment incentives for community-based psychiatric care in Ontario, Canada. Cmaj. 2017;189:E1509–16.
Lavergne MR, Law MR, Peterson S, Garrison S, Hurley J, Cheng L, et al. Effect of incentive payments on chronic disease management and health services use in British Columbia, Canada: interrupted time series analysis. Health Policy. 2018;122:157–64. https://doi.org/10.1016/j.healthpol.2017.11.001.
Puyat JH, Kazanjian A, Wong H, Goldner EM. Is the road to mental health paved with good incentives? Estimating the population impact of physician incentives on mental health care using linked administrative data. Med Care. 2017;55:182–90.
Katz A, Enns JE, Chateau D, Lix L, Jutte D, Edwards J, et al. Does a pay-for-performance program for primary care physicians alleviate health inequity in childhood vaccination rates? Int J Equity Health. 2015;14:114. https://doi.org/10.1186/s12939-015-0231-6.
LeBlanc E, Bélanger M, Thibault V, Babin L, Greene B, Halpine S, et al. Influence of a pay-for-performance program on glycemic control in patients living with diabetes by family physicians in a Canadian Province. Can J Diabetes. 2017;41:190–6. https://doi.org/10.1016/j.jcjd.2016.09.008.
Kasteridis P, Mason A, Goddard M, Jacobs R, Santos R, Rodriguez-Sanchez B, et al. Risk of care home placement following acute hospital admission: effects of a pay-for-performance scheme for dementia. PLoS One. 2016;11:e0155850. https://doi.org/10.1371/journal.pone.0155850.
Haarsager J, Krishnasamy R, Gray NA. Impact of pay for performance on access at first dialysis in Queensland. Nephrology. 2018;23:469–75.
Chen TT, Lai MS, Chung KP. Participating physician preferences regarding a pay-for-performance incentive design: a discrete choice experiment. Int J Qual Health Care. 2016;28:40–6.
Huang Y-C, Lee M-C, Chou Y-J, Huang N. Disease-specific pay-for-performance programs. Med Care. 2016;54:977–83. https://doi.org/10.1097/MLR.0000000000000598.
Hsieh H-M, Gu S-M, Shin S-J, Kao H-Y, Lin Y-C, Chiu H-C. Cost-effectiveness of a diabetes pay-for-performance program in diabetes patients with multiple chronic conditions. PLoS One. 2015;10:e0133163. https://doi.org/10.1371/journal.pone.0133163.
Pan C-C, Kung P-T, Chiu L-T, Liao YP, Tsai W-C. Patients with diabetes in pay-for-performance programs have better physician continuity of care and survival. Am J Manag Care. 2017;23:e57–66 http://www.ncbi.nlm.nih.gov/pubmed/28245660. .
Chen Y-C, Lee CT-C, Lin BJ, Chang Y-Y, Shi H-Y. Impact of pay-for-performance on mortality in diabetes patients in Taiwan. Medicine. 2016;95:e4197. https://doi.org/10.1097/MD.0000000000004197.
Hsieh H-M, Lin T-H, Lee I-C, Huang C-J, Shin S-J, Chiu H-C. The association between participation in a pay-for-performance program and macrovascular complications in patients with type 2 diabetes in Taiwan: a nationwide population-based cohort study. Prev Med. 2016;85:53–9. https://doi.org/10.1016/j.ypmed.2015.12.013.
Hsieh H-M, Shin S-J, Tsai S-L, Chiu H-C. Effectiveness of pay-for-performance incentive designs on diabetes care. Med Care. 2016;54:1063–9. https://doi.org/10.1097/MLR.0000000000000609.
Chen H-J, Huang N, Chen L-S, Chou Y-J, Li C-P, Wu C-Y, et al. Does pay-for-performance program increase providers adherence to guidelines for managing hepatitis B and hepatitis C virus infection in Taiwan? PLoS One. 2016;11:e0161002. https://doi.org/10.1371/journal.pone.0161002.
Chen T-T. Hsueh Y-S (Arthur), Ko C-H, Shih L-N, Yang S-S. the effect of a hepatitis pay-for-performance program on outcomes of patients undergoing antiviral therapy. Eur J Pub Health. 2017;27:955–60. https://doi.org/10.1093/eurpub/ckx114.
Binyaruka P, Patouillard E, Powell-Jackson T, Greco G, Maestad O, Borghi J. Effect of paying for performance on utilisation, quality, and user costs of health services in Tanzania: a controlled before and after study. PLoS One. 2015;10:1–16.
Menya D, Platt A, Manji I, Sang E, Wafula R, Ren J, et al. Using pay for performance incentives (P4P) to improve management of suspected malaria fevers in rural Kenya: a cluster randomized controlled trial. BMC Med. 2015;13:268. https://doi.org/10.1186/s12916-015-0497-y.
Ryan AM, Burgess JF, Jr. Pesko MF, Borden WB and Dimick B. The Early Effects of Medicare's Mandatory Hospital Pay‐for‐Performance Program. Health Serv Res. 2015;50:81-97. https://doi.org/10.1111/1475-6773.12206.
Jha AK. Value-based purchasing: time for reboot or time to move on? JAMA. 2017;317:1107. https://doi.org/10.1001/jama.2017.1170.
Shih T, Nicholas LH, Thumma JR, Birkmeyer JD, Dimick JB. Does pay-for-performance improve surgical outcomes? Aann Surg. 2014;259:677–81.
Swaminathan S, Mor V, Mehrotra R, Trivedi AN. Effect of Medicare dialysis payment reform on use of erythropoiesis stimulating agents. Health Serv Res. 2015;50:790–808.
Kuo RNC, Chung KP, Lai MS. Effect of the Pay-for-Performance Program for Breast Cancer Care in Taiwan. J Oncol Pract. 2011;7(3S):e8s–15s.
Chen JY, Tian H, Juarez DT, Yermilov I, Braithwaite RS, Hodges KA, et al. Does pay for performance improve cardiovascular care in a “real-world” setting? Am J Med Qual. 2011;26:340–8.
Gavagan TF, Du H, Saver BG, Adams GJ, Graham DM, McCray R, et al. Effect of financial incentives on improvement in medical quality indicators for primary care. J Am Board Fam Med. 2010;23:622–31.
Kruse G, Chang Y, Kelley JH, Linder JA, Einbinder J, Rigotti NA. Healthcare system effects of pay-for-performance for smoking status documentation. Am J Manag Care. 2013;23:554–61 https://www.ncbi.nlm.nih.gov/pmc/articles/PMC3624763/pdf/nihms412728.pdf.
Kiran T, Wilton AS, Moineddin R, Paszat L, Glazier RH. Effect of payment incentives on cancer screening in Ontario primary care. Ann Fam Med. 2014;12:317–23.
Li J, Hurley J, Decicca P, Buckley G. Physician response to pay-for-perfor- mance: Evidence from a natural experiment. Health Econ. 2014;23(8):962–78.
Kristensen SR, Meacock R, Turner AJ, Boaden R, McDonald R, Roland M, et al. Long-term effect of hospital pay for performance on mortality in England. N Engl J Med. 2014;371:540–8.
Sutton M, Nikolova S, Boaden R, Lester H, McDonald R, Roland M. Reduced mortality with hospital pay for performance in England. N Engl J Med. 2012;367:1821–8.
Bhalla R, Schechter CB, Strelnick AH, Deb N, Meissner P, Currie BP. Pay for performance improves quality across demographic groups. Qual Manag Health Care. 2013;22:199–209.
Bardach NS, Wang JJ, de Leon SF, Shih SC, Boscardin WJ, Goldman LE, et al. Effect of pay-for-performance incentives on quality of care in small practices with electronic health records: a randomized trial. JAMA. 2013;310:1051–9.
Ryan AM, McCullough CM, Shih SC, Wang JJ, Ryan MS, Casalino LP. The intended and unintended consequences of quality improvement interventions for small practices in a community-based electronic health record implementation project. Med Care. 2014;52:826–32.
Peabody JW, Shimkhada R, Quimbo S, Solon O, Javier X, McCulloch C. The impact of performance incentives on child health outcomes: results from a cluster randomized controlled trial in the Philippines. Health Policy Plan. 2014;29:615–21.
Lemak CH, Nahra TA, Cohen GR, Erb ND, Paustian ML, Share D, et al. Michigan’s fee-for-value physician incentive program reduces spending and improves quality in primary care. Health Aff. 2015;34:645–52.
Saint-Lary O, Sicsic J. Impact of a pay for performance programme on French GPs’ consultation length. Health Policy. 2015;119:417–26. https://doi.org/10.1016/j.healthpol.2014.10.001.
Sharp AL, Song Z, Safran DG, Chernew ME, Mark FA. The effect of bundled payment on emergency department use: alternative quality contract effects after year one. Acad Emerg Med. 2013;20:961–4.
Song Z, Fendrick AM, Safran DG, Landon B, Chernew ME. Global budgets and technology-intensive medical services. Healthcare. 2013;1:15–21.
Song Z, Safran DG, Landon BE, He Y, Ellis RP, Mechanic RE, et al. Health care spending and quality in year 1 of the alternative quality contract. N Engl J Med. 2011;365:909–18.
de Walque D, Gertler PJ, Bautista-Arredondo S, Kwan A, Vermeersch C, de Dieu BJ, et al. Using provider performance incentives to increase HIV testing and counseling services in Rwanda. J Health Econ. 2015;40:1–9. https://doi.org/10.1016/j.jhealeco.2014.12.001.
Chien AT, Li Z, Rosenthal M. Imprroving timely childhood immuniizations through pay for performanace in Medicaid-managed care. Health Res Educ Trust. 2010;45:1934–47.
Allen T, Fichera E, Sutton M. Can payers use prices to improve quality? Evidence from English hospitals. Health Econ. 2016;25:56–70.
McDonald R, Zaidi S, Todd S, Konteh F, Hussein K, Roe J, et al. A qualitative and quantitative evaluation of the introduction of best practice tariffs: An evaluation report commissioned by the Department of Health. 2012; October. http://www.nottingham.ac.uk/business/documents/bpt-dh-report-21nov2012.pdf.
Unutzer J, Chan YF, Hafer E, Knaster J, Shields A, Powers D, et al. Quality improvement with pay-for-performance incentives in integrated behavioral health care. Am J Public Health. 2012;102:41–5.
Serumaga B, Ross-Degnan D, Avery AJ, Elliott RA, Majumdar SR, Zhang F, et al. Effect of pay for performance on the management and outcomes of hypertension in the United Kingdom: interrupted time series study. BMJ. 2011;342:d108.
Simpson CR, Hannaford PC, Ritchie LD, Sheikh A, Williams D. Impact of the pay-for-performance contract and themanagement of hypertension in Scottish primary care: a 6-year population-based repeated cross-sectional study. Br J Gen Pract. 2011;61:443–51.
Ross JS, Lee JT, Netuveli G, Majeed A, Millett C. The effects of pay for performance on disparities in stroke, hypertension, and coronary heart disease management: interrupted time series study. PLoS One. 2011;6:e27236.
Sun X, Liu X, Sun Q, Yip W, Wagstaff A, Meng Q. The impact of a pay-for-performance scheme on prescription quality in rural China impact evaluation; 2014.
Yip W, Powell-Jackson T, Chen W, Hu M, Fe E, Hu M, et al. Capitation combined with pay-for-performance improves antibiotic prescribing practices in rural China. Health Aff. 2014;33:502–10.
Powell-Jackson T, Yip WC-M. Realigning demand and supply side incen- tives to improve primary health care seeking in rural China. Health Econ. 2015;24:755–72.
Acknowledgements
The authors acknowledge the data provided by the authors of the previous review [4].
Funding
Financial support for this study was provided by the National Health and Medical Research Council (NHMRC) Partnership Centre on Health System Sustainability.
Author information
Authors and Affiliations
Contributions
AZ conducted the literature search, data extraction, and statistical analysis and contributed to data interpretation and paper drafting. AS provided management oversight of the whole project and contributed to data interpretation and drafting of the paper. Both authors have read and approved the manuscript.
Corresponding author
Ethics declarations
Ethics approval and consent to participate
Not applicable.
Consent for publication
Not applicable.
Competing interests
Authors have no conflict of interest to declare.
Additional information
Publisher’s Note
Springer Nature remains neutral with regard to jurisdictional claims in published maps and institutional affiliations.
Supplementary Information
Rights and permissions
Open Access This article is licensed under a Creative Commons Attribution 4.0 International License, which permits use, sharing, adaptation, distribution and reproduction in any medium or format, as long as you give appropriate credit to the original author(s) and the source, provide a link to the Creative Commons licence, and indicate if changes were made. The images or other third party material in this article are included in the article's Creative Commons licence, unless indicated otherwise in a credit line to the material. If material is not included in the article's Creative Commons licence and your intended use is not permitted by statutory regulation or exceeds the permitted use, you will need to obtain permission directly from the copyright holder. To view a copy of this licence, visit http://creativecommons.org/licenses/by/4.0/. The Creative Commons Public Domain Dedication waiver (http://creativecommons.org/publicdomain/zero/1.0/) applies to the data made available in this article, unless otherwise stated in a credit line to the data.
About this article

Cite this article
Zaresani, A., Scott, A. Is the evidence on the effectiveness of pay for performance schemes in healthcare changing? Evidence from a meta-regression analysis. BMC Health Serv Res 21, 175 (2021). https://doi.org/10.1186/s12913-021-06118-8
Received:
Accepted:
Published:
DOI: https://doi.org/10.1186/s12913-021-06118-8