
Abstract
Background
Obesity is related to the increased incidence of hypertension and in healthy individuals, blood pressure changes with age and body mass. The aims of this paper were to evaluate the effectiveness of the weight loss intervention on body composition and blood pressure, and to evaluate the relationship between these factors among housewives in the MyBFF@home study.
Methods
MyBFF@home intervention was a quasi-experimental study which involved 328 overweight and obese housewives aged 18–59 years old (Control group: 159, Intervention group: 169). Data of the control and intervention group (pre and post intervention who completed the body composition and blood pressure measurements were analysed. Body compositions were measured using the Body Impedance Analyser (InBody 720) and blood pressure (Systolic and Diastolic) was taken using the blood pressure monitoring device (Omron HEM 907) at baseline, 6 month and 12 month. Data analyses (Pearson’s correlation test and ANOVA) were performed and analysed using SPSS Statistics for Windows, version 22.0.
Results
Visceral fat area, fat mass and body fat percentage, were all significantly decreased in the intervention group compared to the control group after 6 month intervention (p < 0.05). Systolic blood pressure was reduced significantly by − 6.81 mmHg (95% CI: -9.72,-3.90; p < 0.01) in the intervention and by − 7.95 mmHg (95% CI: -11.69,-4.20; p < 0.01) in the control group after 6 month intervention. Diastolic blood pressure was significantly correlated with BMI (r = 0.19), waist circumference (r = 0.23), body fat mass (r = 0.22), body fat percentage (r = 0.18) visceral fat area (r = 0.22) and skeletal muscle mass (r = 0.14) with p < 0.05. At 12-month follow-up, no significant changes of blood pressure were detected in both groups.
Conclusion
There were significant changes in the body fat and systolic blood pressure over 6 month among the participants in the intervention group compared to the control group. However, both groups were unable to sustain the positive changes in the body fats during the maintenance phase. There was a relationship between the body composition and blood pressure during the weight loss intervention and weight loss maintenance phase. Participation among obese housewives in a community-based intervention programme led to the improvements in blood pressure and body composition.
Background
Adipose tissue has been traditionally considered a fat-storage organ but is now known to have an active role in systemic metabolism through the active secretion of adipokines or obesity hormones [1, 2]. Visceral adipose tissue (VAT), rather than subcutaneous adipose tissue has been shown to be profoundly responsible of most of the obesity-associated metabolic disorders and closely associated with a cluster of risk factors [3, 4]. Recent studies emphasise the importance of depots where fat is accumulated rather than the simple fat mass, and visceral obesity is known to be a strong risk factor for metabolic and subsequent cardiovascular disease [5,6,7,8,9]. A study among Korean premenopausal women clarified that visceral fat area is a major determinant of metabolic syndrome risk in premenopausal women compared to waist circumference [10]. Since the possibility of measuring VAT by imaging techniques such as computed tomography and magnetic resonance imaging is not always available, bioelectrical impedance analyser (BIA) represents a good alternative to estimate VAT. Patients with increased VAT-related cardiometabolic risk could be identified and this allows a better management of obese patients [11].
In healthy individuals, blood pressure (BP) changes with age and body mass [12]. Several studies have showed that overweight is one of the principal factors related to increased incidence of hypertension in worldwide [13, 14]. In 2015, the prevalence of raised blood pressured in females aged 18 and over was around 20% and males around 24% (Global Health Observatory data, WHO) [15]. In Malaysia, the overall prevalence of hypertension (known and undiagnosed) among adults of 18 years and above in the National Health and Morbidity Survey (NHMS) was 30.3% [16].
In a lifestyle intervention for obese women, the study showed significant changes in body composition, consisting of a smaller proportion of body fat and increased lean body mass [17]. Among adolescents, a combination of caloric restriction, exercise and behaviour change produced a greater decrease in resting systolic blood pressure and peak exercise diastolic blood pressure than did a programme of caloric restriction and behaviour change alone [18]. In a recent study, lifestyle-changing intervention by family physician-led group visits achieved significant weight loss and quality of life improvement in overweight and obese women [19]. In contrast, a group of older men was studied for independent and combined effects of weight loss and aerobic exercise on blood pressure. Combining the two interventions did not reduce blood pressure to a greater degree than the two interventions did independently. This difference in outcome might be explained by an age-dependent factor [20].
The objective of this study was to evaluate the effectiveness of lifestyle intervention on body composition and blood pressure among overweight and obese women who participated in the MyBFF@home study. We also aimed to evaluate the relationship between the body composition and blood pressure.
Methods
This paper is part of the ‘My Body Is Fit and Fabulous at home’ (MyBFF@home) study. The design of the MyBFF@home was a quasi-experimental, which involved a pre and post intervention at the community setting. Participants were overweight and obese housewives living in low cost flats (People’s Home/Housing Project) in Federal Territory of Kuala Lumpur, Malaysia. The inclusion criteria were housewives aged 18–59 years old, overweight and obese with BMI 25.0 to 39.9 kg/m2. Participants who were morbidly obese (BMI > 40.0), currently on weight management programme, had limitation for physical activities (bed ridden and physical disability), had diabetes, heart disease, renal dysfunction and severe hypertension (confirmation with self-report) were excluded in the study. Screening of the housewives was conducted by the nurses and the medical assistants from 1Malaysia Clinics.
Socio-demographic characteristics of the participants and details of the intervention were described earlier by Mohamad Nor et al. [21]. The intervention group received a weight loss intervention package consisted of individual diet counselling, group exercise and self-monitoring tools (Food diary and physical activity diary). The control group received women’s health seminar package. Both groups were followed-up for 6 months (intervention phase - intervention: n = 83; control: n = 66) and another 6 months (maintenance phase – intervention: n = 65; control: n = 56). Participants’ body mass index (BMI) and waist circumference were collected at baseline, 6 and 12 months. We only analysed participants’ data with completed body composition assessment. The study flow is represented in the Fig. 1.
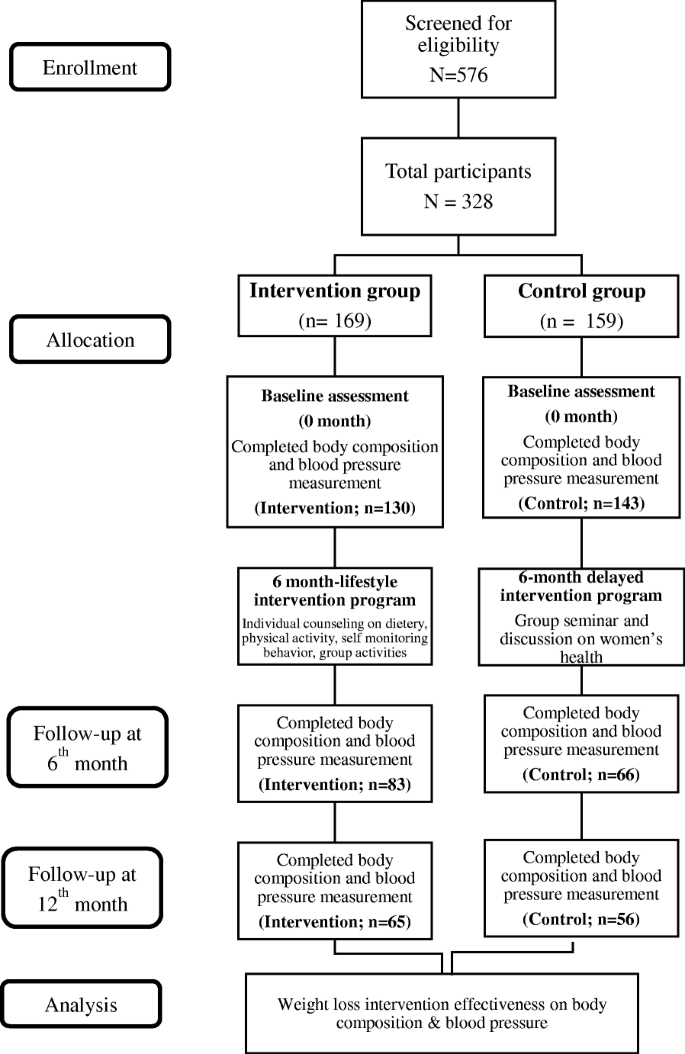
Study flow of the body composition and blood pressure data collection in the MyBFF@home study
Body composition measurement
Bioelectrical impedance analyser (BIA) produces a close estimate of fat mass in a wide range of body compositions [22]. It is a non-invasive measurement of body composition and has also many advantages compared with other methods because it is inexpensive, simple, fast, safe, portable, and easy to perform, as well as requires minimum operator training [23]. Direct segmental multi-frequency BIA measurements were taken using BIA InBody 720 (BioSpace Co., Seoul, Korea). This BIA adopt a tetrapolar, eight-point tactile electrode system that separately measures impedance of the arms, trunk, and legs at six different frequencies (1, 5, 50, 250, 500, and 1000 kHz). This equipment has previously been shown to have high test-pretest reliability and accuracy [24]. Subjects had to fast for at least 5 h and not engage into strenuous physical activity during the previous 12 h.
In the MyBFF@home study, the following body composition parameters were measured: body fat mass (FM), percentage body fat (BFP), skeletal muscle mass (SMM), and visceral fat area (VFA). Testing was conducted according to manufacturer instructions. The subject stepped on the foot electrodes barefoot and stood still until body weight was measured. The subject grasped the hand electrode cables, and gently held on to the thumb electrode and the palm electrode, thereby providing contact with a total of eight electrodes. Hands were held of approximately 20 degrees away from the body, until measurements were completed. The inbuilt software was used to calculate the body composition values. The build-in body composition analysis of total weight, lean body mass and fat mass were compared to normal range values. By the end of BIA measurement, each participant was able to see her result.
Blood pressure measurements
A fully automated blood pressure monitor using oscillometric method was used (Omron HEM 907; Omron Healthcare Europe BV, Hoofdorp, The Netherlands). Blood pressure (BP) was recorded in mmHg from the patients’ arm, in sitting position. Measurements were taken twice and a mean value was computed. Hypertension was defined by a systolic BP ≥ 140 mmHg and/or, diastolic BP ≥ 90 mmHg. Prior to recruitment, screening has been done. Therefore, those detected with moderate and severe hypertension have been referred to clinics and excluded from the study.
Anthropometric measurements
Measurements of weight, height and waist circumference were obtained for anthropometric analysis. All participants were weighed to the nearest 0.1 kg in light clothing, without shoes and with an empty bladder on an electronic scale (Tanita HD319, Japan; at baseline, 6 month and again at 12 months). Height was measured using a SECA Bodymeter. Waist circumference was measured to the nearest 0.5 cm at the umbilicus with a flexible tape applied directly on the skin. BMI was calculated by dividing the measured body weight (kg) by the squared of body height (m2). BMI categories were referred to WHO 1998 classification.
Statistical analysis
Baseline characteristics between study groups were compared using independent t-test. Pearson’s correlations test was done for correlation of BIA measurements with SBP and DBP during baseline. Within group changes were analysed using paired t-test. Whilst, one-way ANOVA was used to detect mean difference of body composition changes between study groups. Analyses were performed by study phase (intervention and maintenance phase). Data were analysed using IBM SPSS Statistics for Windows, version 22 (IBM Corp., Armonk, N.Y., USA).
Results
At the baseline, the total number of participants who completed body composition and blood pressure measurement was 273 (72.2%). A total of 149 participants completed the 6-month intervention (intervention: n = 83; control: n = 66). Finally, after the next 6 months of maintenance phase, 121 participants provided all outcome data at all time points; baseline, 6- and 12-month (intervention: n = 65; control: n = 56) (Fig. 1).
Table 1 shows the baseline characteristics of body composition and blood pressure in the intervention and control group. Variables were presented as mean and standard deviations as they were normally distributed. The baseline characteristics of the measured parameters are comparable between the study and control groups. Skeletal muscle mass in the intervention group recorded higher measurement compared to control (22.35 ± 2.8 kg vs 21.67 ± 2.85 kg, p = 0.05). Systolic and diastolic BP were within normal range.
Table 2 shows correlation between blood pressure and anthropometric and body composition indices. Diastolic BP was significantly correlated with BMI (r = 0.21, p < 0.001), waist circumference (r = 0.24, p < 0.001), fat mass (r = 0.22, p < 0.001), body fat percentage (r = 0.22, p < 0.001), visceral fat area (r = 0.22, p < 0.001) and skeletal muscle mass (r = 0.12, p < 0.05). No correlations were found between systolic BP and other parameters.
Table 3 summarizes the body composition and blood pressure changes over the 6-month intervention period and another 6 months weight loss maintenance phase. The body composition analysis revealed a highly significant reduction of body fat mass in the intervention group, (− 1.20 kg (95% CI:-1.76,-0.64, p < 0.01), and also in the control group (0.48 kg (95% CI: 0.07, 0.89, p < 0.05). For visceral fat area, highly significant difference between baseline and month-6 were detected for intervention group (− 4.41 kg (95% CI: -6.06,-2.76, p < 0.001), and − 4.57 kg (95% CI:-6.83,-2.31, p < 0.001) for the control group. Overall, fat mass, body fat percentage and visceral fat area were reduced in both study groups, without significant difference between them. In both groups, systolic BP reduced significantly during intervention phase (p < 0.001**). Graphical changes are shown in Fig. 2.

Graphical representation of changes of selected parameters at 6-month
Improvement in skeletal muscle mass was retained during this phase with significant increment in the intervention compared to the control group (0.31 kg vs. 0.00 kg respectively, p = 0.016). Both groups gained fat content from 6 to 12 months and fat regain was significantly (P < 0.05) greater for the intervention than for the control group. At 12-month follow-up, systolic and diastolic BP have shown insignificant decrement in both groups (Fig. 3).

Graphical representation of changes of selected parameters at12-month
Discussion
Our intervention programme reduced systolic blood pressure significantly, in both groups. This could be explained by reduction of fat mass, body fat percentage and visceral fat area, in both groups too. This observation was seen in other study, where in a weight loss intervention among Latinos, weight loss was followed by reduction of systolic and diastolic blood pressure [25]. However this positive effect was not only achieved among participants of the intervention arm, but also by control group participants. There is robust evidence that action to lower blood pressure does reduce the risk to health. A systematic review found that, in the populations studied, every 10 mmHg reduction in blood pressure resulted in a 17% reduction for coronary heart disease, a 27% reduction for stroke, a 28% reduction for heart failure and a significant 13% reduction in all-cause mortality [26]. In this study, systolic blood pressure was reduced significantly by 6.8 mmHg and 9 mmHg in the intervention and control group, respectively. Blood pressure showed significant positive correlations with weight, body fat, fat weight, core fat, body mass index, and basal metabolic rate in Asian obese and normal weight middle-aged women [27, 28]. This study found that subjects with higher diastolic blood pressure have higher body composition measurements. This is in line with a Chinese study by Wu O., et al. (2018) where diastolic blood pressure was significantly positively correlated with BMI and waist circumference [28]. As risk factors of the new onset of hypertension, the impact of diastolic blood pressure compared with systolic blood pressure, men compared with women, and higher body mass index were greater in the younger adults, whereas in the older adults, the impact of systolic blood pressure and female sex were greater [29].
BMI is as an important obesity index. However, the negative effect of obesity is increasingly attributed to excess adiposity, particularly central and visceral adiposity, and BMI cannot differentiate between the fat mass and other body compositions such as lean mass or bone mass. Visceral fat is an important component and has been shown to be associated with a greater cardiometabolic risk, as compared with subcutaneous fat and other obesity measurements, including BMI [30,31,32]. Although visceral fat area was reduced significantly at month-6 for both groups, this reduction was not maintained at 12 months. During the same period, both systolic and diastolic BP did not increase after the maintenance phase, despite increment of adiposity at 12-month. A modest weight loss can normalise blood pressure levels in hypertensive patients even without reaching ideal weight [33].
Various components in the intervention package might contribute to these findings, including the individualised dietary counselling. Recently, a dietary intervention provides significant benefits to overweight/obese patients with primary hypertension, by reduction of blood pressure, body compositions and biochemical parameters [34]. Another study showed that, a four-week diet regimen, exercise and psychological intervention for weight loss, systolic and diastolic BP showed significant decline, while the BIA analysis revealed significant reduction of body fat content [35]. One possible mechanism is through reduction of sodium intake. A Cochrane study showed that sodium reduction resulted in a decrease in SBP/DBP of 1/0 mmHg in white participants with normotension and a decrease in SBP/DBP of 5.5/2.9 mmHg in white participants with hypertension [36].
High percentage of fat, mainly visceral, have been related to insulin resistance, high levels of angiotensin II, increased secretion of aldosterone, and, consequently, high absorption of sodium in renal tubules [33, 37]. Additionally, stiffness of endothelial and vascular smooth muscle cells, extracellular matrix remodelling and perivascular adipose tissue inflammation and immune cell dysfunction contribute to the development of arterial stiffness in obesity. This is supported by Lefferts WK et al., (2017) who suggested visceral adiposity may detrimentally affect subclinical markers of cardiovascular disease risk and contribute to artery stiffness [38].
Body impedance analysis in this study revealed that skeletal muscle mass increased significantly in the intervention group at month-12. Engagement of exercise and physical activities by the intervention participants may contribute to this result [39]. This observation was not detected in the intervention period. This possibly due to a long-term effect of exercise and physical activities.
Despite participants in the control group only attended group seminars and discussion on women’s health, without the intervention package, we also saw positive effect on body composition in this group. One of the components received by both study groups was diet intake self-monitoring, where the participants needed to record their food intake routinely for at least three days in a week. Burke (2011) showed a significant association between self-monitoring and weight loss was consistently found [40]. MyBFF@home weight loss package alone might be effective, but enrolling into any weight-loss programmes might provide awareness and self-empowerment among women in the control group although they were not intervened. Control group participants may also have been previously exposed to various health programmes, conducted by the government or local communities, which may have raised health awareness among them. The participants might practice ‘Self-directed intervention’ which did not require professional assistant. Self-directed interventions are likely to be most effective when they empower participants to control and regulate their own thoughts, feelings, and behaviours, thereby changing psychological and environmental prompts to weight-gain behaviours [41]. Another example is, enrolling in a programme through work (with a corporate partner) affects retention and weight loss [42]. Control individuals in the control group who participated in the programme may be more motivated, which resulted in positive effects found in this study. Furthermore, adhering to improved lifestyle, focusing on behavioural change and maintaining weight loss after the end of the intervention seem to be the key not only for cardio-metabolic risk factors but also for sustainable health-related quality of life [43].
There are also some limitations to be mentioned. Participants were not randomly assigned to the programmes, only the location of the flats were randomly assigned. Menopausal women showed more visceral fat [44], however we do not have this data. Manufacturers of BIA technology recommend to avoid testing women when they perceive to be retaining water during the menstrual cycle. We also do not have menstrual status of the participants. However, according to a recent study, contact-electrode BIA devices can be used at any time during a woman’s menstrual cycle without altering the body composition values [45]. Another limitation is the small samples size in the subgroup, potentially influencing the power of the analyses.
Conclusions
Participating in a lifestyle intervention programme in a community setting led to the improvements in blood pressure and the body composition. We noted significantly lower adiposity and systolic blood pressure over 6 months in the participants enrolled in the intervention programme, both in the intervention and control group. Generally, both groups were unable to show effective sustainability of positive changes in body fats during the maintenance phase. More effective strategies are needed to empower individuals to positively act on the matter of their personal health.
Abbreviations
- BFP:
-
Percentage body fat
- BIA:
-
Bioelectrical impedance analyser
- BMI:
-
Body mass index
- BP:
-
Blood pressure
- FM:
-
Body fat mass
- MyBFF@home:
-
My Body Is Fit and Fabulous at Home
- SMM:
-
Skeletal muscle mass
- VAT:
-
Visceral adipose tissue
- VFA:
-
Visceral fat area
References
Gustafson B, Hammarstedt A, Andersson CX, Smith U. Inflamed adipose tissue: a culprit underlying the metabolic syndrome and atherosclerosis. Arterioscler Thromb Vasc Biol. 2007;27:2276–83.
Hiuge-Shimizu A, Kishida K, Funahashi T, Ishizaka Y, Oka R, Okada M, et al. Absolute value of visceral fat area measured on computed tomography scans and obesity-related cardiovascular risk factors in large-scale Japanese general population (the VACATION-J study). Ann Med. 2012;44:82–92.
Ryo M, Kishida K, Nakamura T, Funahashi T, Shimomura I. Short-term intervention reduces bioelectrical impedance analysis-measured visceral fat in type 2 diabetes mellitus. Diabetes Res Clin Pract. 2014;103:e27–9.
Hyun YJ, Kim OY, Jang Y, Ha J-W, Chae JS, Kim JY, et al. Evaluation of metabolic syndrome risk in Korean premenopausal women: not waist circumference but visceral fat. Circ J Off J Jpn Circ Soc. 2008;72:1308–15.
Payahoo L, Ostadrahimi A, Mobasseri M, Khaje Bishak Y, Farrin N, Asghari Jafarabadi M, et al. Effects of zinc supplementation on the anthropometric measurements, lipid profiles and fasting blood glucose in the healthy obese adults. Adv Pharm Bull. 2013;3:161–5.
Frayn KN. Visceral fat and insulin resistance--causative or correlative? Br J Nutr. 2000;83(Suppl 1):S71–7.
Mataix J, López-Frías M, Martínez-de-Victoria E, López-Jurado M, Aranda P, Llopis J. Factors associated with obesity in an adult Mediterranean population: influence on plasma lipid profile. J Am Coll Nutr. 2005;24:456–65.
Marreiro DDN, Fisberg M, Cozzolino SMF. Zinc nutritional status and its relationships with hyperinsulinemia in obese children and adolescents. Biol Trace Elem Res. 2004;100:137–49.
Heyward VH. Evaluation of body composition. Current issues Sports Med Auckl NZ. 1996;22:146–56.
Mathieu P. Abdominal obesity and the metabolic syndrome: a surgeon’s perspective. Can J Cardiol. 2008;24(Suppl D):19D–23D.
Gómez-Ambrosi J, González-Crespo I, Catalán V, Rodríguez A, Moncada R, Valentí V, et al. Clinical usefulness of abdominal bioimpedance (ViScan) in the determination of visceral fat and its application in the diagnosis and management of obesity and its comorbidities. Clin Nutr Edinb Scotl. 2018;37:580–9.
Hosseini M, Baikpour M, Yousefifard M, Fayaz M, Koohpayehzadeh J, Ghelichkhani P, et al. Blood pressure percentiles by age and body mass index for adults. EXCLI J. 2015;14:465–77.
Kotsis V, Stabouli S, Papakatsika S, Rizos Z, Parati G. Mechanisms of obesity-induced hypertension. Hypertens res off J Jpn Soc. Hypertension. 2010;33:386–93.
Stepien M, Stepien A, Banach M, Wlazel RN, Paradowski M, Rizzo M, et al. New obesity indices and adipokines in normotensive patients and patients with hypertension: comparative pilot analysis. Angiology. 2014;65:333–42.
Raised blood pressure. Global Health Observatory (GHO) data. 2018. www.who.int/gho/ncd/risk_factors/blood_pressure_text/en/ . Accessed 20 Apr 2018.
Institute for Public Health. National Health and Morbidity Survey 2011 (NHMS 2011). Vol. II: Non-Communicable Diseases. Kuala Lumpur: Ministry of Health Malaysia; 2011.
Kozłowska A, Okręglicka KM, Jagielska AM, Skibniewska M, Nitsch-Osuch A. Lifestyle intervention program for amelioration of Dysmetabolism in overweight women. Adv Exp Med Biol. 2018; https://doi.org/10.1007/5584_2018_169.
Rocchini AP, Katch V, Anderson J, Hinderliter J, Becque D, Martin M, et al. Blood pressure in obese adolescents: effect of weight loss. Pediatrics. 1988;82:16–23.
Tunay M, Kurdak H, Özcan S, Özdemir Ç, Özer ZY. Family physician-led group visits for lifestyle modification in women with weight problems: a pilot intervention and follow-up study. Obes Facts. 2018;11:1–14.
Dengel DR, Galecki AT, Hagberg JM, Pratley RE. The independent and combined effects of weight loss and aerobic exercise on blood pressure and oral glucose tolerance in older men. Am J Hypertens. 1998;11:1405–12.
Mohamad Nor NS, Ambak R, Omar MA, Shahar S, Abdul Aziz NS, Mohd Yusoff MF, et al. Methodology of the my body is fit and fabulous at home (MyBFF@home): an intervention study to combat obesity among housewives in Malaysia. J Womens Health, Issues Care. 2016;5:2.
Houtkooper LB, Lohman TG, Going SB, Howell WH. Why bioelectrical impedance analysis should be used for estimating adiposity. Am J Clin Nutr. 1996;64:436S–48S.
Roubenoff R. Applications of bioelectrical impedance analysis for body composition to epidemiologic studies. Am J Clin Nutr. 1996;64:459S–62S.
Gibson AL, Holmes JC, Desautels RL, Edmonds LB, Nuudi L. Ability of new octapolar bioimpedance spectroscopy analyzers to predict 4-component-model percentage body fat in Hispanic, black, and white adults. Am J Clin Nutr. 2008;87:332–8.
Ettehad D, Emdin CA, Kiran A, Anderson SG, Callender T, Emberson J, et al. Blood pressure lowering for prevention of cardiovascular disease and death: a systematic review and meta-analysis. Lancet Lond Engl. 2016;387:957–67.
Zhang X, Imperatore G, Thomas W, Cheng YJ, Lobelo F, Norris K, et al. Effect of lifestyle interventions on glucose regulation among adults without impaired glucose tolerance or diabetes: a systematic review and meta-analysis. Diabetes Res Clin Pract. 2017;123:149–64.
Shin JY, Ha CH. Relationships between blood pressure and health and fitness-related variables in obese women. J Phys Ther Sci. 2016;28:2933–7.
Wu O, Leng J, Yang F, Yang H, Zhang H, Li Z, et al. A comparative research on obesity hypertension by the comparisons and associations between waist circumference, body mass index with systolic and diastolic blood pressure, and the clinical laboratory data between four special Chinese adult groups. Clin Exp Hypertens. 2018;40:16–21.
Kanegae H, Oikawa T, Okawara Y, Hoshide S, Kario K. Which blood pressure measurement, systolic or diastolic, better predicts future hypertension in normotensive young adults? J Clin Hypertens Greenwich Conn. 2017;19:603–10.
Després JP. Physical activity and the risk of coronary heart disease. J Assoc Medicale Can. 1989;141:939.
Shah RV, Murthy VL, Abbasi SA, Blankstein R, Kwong RY, Goldfine AB, et al. Visceral adiposity and the risk of metabolic syndrome across body mass index: the MESA study. JACC Cardiovasc Imaging. 2014;7:1221–35.
Kang SH, Cho KH, Park JW, Yoon KW, Do JY. Association of Visceral fat Area with chronic kidney disease and metabolic syndrome risk in the general population: analysis using multi-frequency bioimpedance. Kidney Blood Press Res. 2015;40:223–30.
Kucharska A, Gajewska D, Kiedrowski M, Sińska B, Juszczyk G, Czerw A, et al. The impact of individualised nutritional therapy according to DASH diet on blood pressure, body mass, and selected biochemical parameters in overweight/obese patients with primary arterial hypertension: a prospective randomised study. Kardiol Pol. 2018;76:158–65.
Weinreich T, Filz H-P, Gresser U, Richartz BM. Effectiveness of a four-week diet regimen, exercise and psychological intervention for weight loss. J Clin Diagn Res JCDR. 2017;11:LC20–4.
Graudal NA, Hubeck-Graudal T, Jurgens G. Effects of low sodium diet versus high sodium diet on blood pressure, renin, aldosterone, catecholamines, cholesterol, and triglyceride. Cochrane Libr [Internet]. John Wiley & Sons, Ltd; 2017 [cited 2018 Apr 19]. Available from: http://cochranelibrary-wiley.com/doi/10.1002/14651858.CD004022.pub4/full
Cho S-A, Joo HJ, Cho J-Y, Lee SH, Park JH, Hong SJ, et al. Visceral fat area and serum adiponectin level predict the development of metabolic syndrome in a community-based asymptomatic population. PLoS One. 2017;12:e0169289.
Aroor AR, Jia G, Sowers JR. Cellular mechanisms underlying obesity-induced arterial stiffness. Am J Physiol Regul Integr Comp Physiol.; 2018;314(3):R387-98.
Lefferts WK, Sperry SD, Jorgensen RS, Kasprowicz AG, Skilton MR, Figueroa A, et al. Carotid stiffness, extra-media thickness and visceral adiposity in young adults. Atherosclerosis. 2017;265:140–6.
Nishiguchi S, Yamada M, Kajiwara Y, Sonoda T, Yoshimura K, Kayama H, et al. Effect of physical activity at midlife on skeletal muscle mass in old age in community-dwelling older women: a cross-sectional study. J Clin Gerontol Geriatr. 2014;5:18–22.
Burke LE, Wang J, Sevick MA. Self-monitoring in weight loss: a systematic review of the literature. J Am Diet Assoc. 2011;111:92–102.
Kessler DA. The end of overeating: Taking Control of the Insatiable American Appetite. Pennsylvania: Emmaus; 2009. p.320
Martin CK, Talamini L, Johnson A, Hymel AM, Khavjou O. Weight loss and retention in a commercial weight-loss program and the effect of corporate partnership. Int J Obes. 2010;34:742–50.
Elbe A-M, Elsborg P, Dandanell S, Helge JW. Correlates and predictors of obesity-specific quality of life of former participants of a residential intensive lifestyle intervention. Obes Sci Pract. 2018;4:188–93.
Soto Rodríguez A, García Soidán JL, Arias Gómez MJ, Leirós Rodríguez R, Del Álamo Alonso A, Pérez Fernández MR. Metabolic syndrome and visceral fat in women with cardiovascular risk factor. Nutr Hosp. 2017;34:863–8.
Cumberledge EA, Myers C, Venditti JJ, Dixon CB, Andreacci JL. The effect of the menstrual cycle on body composition determined by contact-electrode bioelectrical impedance analyzers. Int J Exerc Sci. 2018;11:625–32.
Acknowledgements
The authors would like to thank the Director General of Health Malaysia for the permission to publish this paper. The authors would also like to thank all research team members from various institutions and Dr. Wan Nazaimoon Wan Mohamud (former MyBFF project coordinator) for their technical support. Special thanks to all the participants in the MyBFF@home study, for their full co-operation and dedication.
Funding
Publication of this article was sponsored by the Ministry of Health Malaysia.
Availability of data and materials
The dataset that support the findings of this article belong to the MyBFF@home study. At present, the data are not publicly available but can be obtained from the authors upon reasonable request and with the permission from the Director General of Health, Malaysia.
About this supplement
This article has been published as part of BMC Women’s Health Volume 18 Supplement 1, 2018: My Body is Fit and Fabulous at home (MyBFF@home). The full contents of the supplement are available online at https://bmcwomenshealth.biomedcentral.com/articles/supplements/volume-18-supplement-1.
Author information
Authors and Affiliations
Contributions
NSMN, RA and TA were responsible for the concept, project and supervision. FM, LAZ and MAO were responsible for data analysis. FM wrote the original draft. NSMN, LAZ, MAO, RA, UKS, NAH and TA contributed to the writing to the writing, review and editing of this paper. All authors have read and confirmed the manuscript.
Corresponding author
Ethics declarations
Ethics approval and consent to participate
Ethical approval for the MyBFF@home study was obtained from the Medical Research Ethic Committee (MREC) Malaysia (Research registration number: NMRR-13-726-16,391). Informed written consent was taken from all respondents at the beginning of the study.
Competing interests
The authors declare that they have no competing interests.
Publisher’s Note
Springer Nature remains neutral with regard to jurisdictional claims in published maps and institutional affiliations.
Rights and permissions
Open Access This article is distributed under the terms of the Creative Commons Attribution 4.0 International License (http://creativecommons.org/licenses/by/4.0/), which permits unrestricted use, distribution, and reproduction in any medium, provided you give appropriate credit to the original author(s) and the source, provide a link to the Creative Commons license, and indicate if changes were made. The Creative Commons Public Domain Dedication waiver (http://creativecommons.org/publicdomain/zero/1.0/) applies to the data made available in this article, unless otherwise stated.
About this article

Cite this article
Fazliana, M., Liyana, A.Z., Omar, A. et al. Effects of weight loss intervention on body composition and blood pressure among overweight and obese women: findings from the MyBFF@home study. BMC Women's Health 18 (Suppl 1), 93 (2018). https://doi.org/10.1186/s12905-018-0592-2
Published:
DOI: https://doi.org/10.1186/s12905-018-0592-2