
Abstract
Background
In the last decade, interest in working life expectancy (WLE) and socioeconomic differences in WLE has grown considerably. However, a comprehensive overview of the socioeconomic differences in WLE is lacking. The aim of this review is to systematically map the research literature to improve the insight on differences in WLE and healthy WLE (HWLE) by education, occupational class and income while using different ways of measuring and estimating WLE and to define future research needs.
Methods
A systematic search was carried out in Web of Science, PubMed and EMBASE and complemented by relevant publications derived through screening of reference lists of the identified publications and expert knowledge. Reports on differences in WLE or HWLE by education, occupational class or income, published until November 2022, were included. Information on socioeconomic differences in WLE and HWLE was synthesized in absolute and relative terms.
Results
A total of 26 reports from 21 studies on educational and occupational class differences in WLE or HWLE were included. No reports on income differences were found. On average, WLE in persons with low education is 30% (men) and 27% (women) shorter than in those with high education. The corresponding numbers for occupational class difference were 21% (men) and 27% (women). Low-educated persons were expected to lose more working years due to unemployment and disability retirement than high-educated persons.
Conclusions
The identified socioeconomic inequalities are highly relevant for policy makers and pose serious challenges for equitable pension policies. Many policy interventions aimed at increasing the length of working life follow a one-size-fits-all approach which does not take these inequalities into account. More research is needed on socioeconomic differences in HWLE and potential influences of income on working life duration.
Introduction
Despite increased longevity, the average length of working life remains relatively short as compared to life expectancy [1, 2]. According to Eurostat statistics, working life expectancy (WLE) at age 15 in Europe in 2021 was 38.2 years among men and 33.7 years among women, respectively [3], while life expectancy at this age was 62.6 years (men) and 68.3 (women). Earlier studies reported significant gender, educational and occupational class differences in WLE [1, 4,5,6].
WLE denotes the time that a person is expected to participate in working life after a given age [7]. The measure is similar to life expectancy but with permanent exit from working life as the final state, irrespective of how the labour market is left (e.g., retirement or death). WLE is a population summary measure, which is forecasting a duration of working life of all individuals in a particular study population based on cumulative labour market attachment. It does not determine how long an individual will actually work during the remaining lifespan.
Different terms are used in the literature for the WLE, e.g., labour force expectancy, labour market life expectancy, active life expectancy [1]. A principal conceptual distinction of these terms is in how participation in working life is defined.
Participation in working life can be defined in several ways. The broadest definition refers to being economically active and thereby available to the labour market, i.e., being in the labour force as either employed/self-employed or unemployed. WLE estimated based on labour force participation rates is sometimes called labour force expectancy or economic activity expectancy [1]. In a narrower definition, participating in working life is restricted to being employed and is sometimes referred to as employment life expectancy [8]. An even stricter definition of working life refers to productive work only, i.e., not being e.g., in sickness absence or in subsidized employment [9]. The latter definition of participation in working life takes into account possible temporary interruptions of work due to ill-health or other reasons (e.g. unemployment, studying or care activities) more comprehensively than the former two.
WLE takes into consideration the complex interplay between changes in life expectancy and age-specific patterns of labour market behaviour of individuals in the population, which cover entry patterns at a young age, exit schedules at old age, temporary exit and re-entering employment and productive work participation during the lifespan. It differs from the average duration of working life, calculated based on average ages at which individuals enter and exit from the labour market [10]. The time that a person at a given age is expected to spend in other labour market states than employment determines working years lost (WYL). The sum of WLE and WYL indicates the potential remaining working years after a specific age. The WYL can be decomposed by reason due to which working years were lost (e.g., unemployment, receiving disability benefits or retirement).
Poor health, chronic diseases, and reduced work ability were found to be associated with withdrawal from the labour force due to disability, early retirement and accidental death, especially among older adults [11,12,13,14,15,16,17]. In order to incorporate longevity, health status and labour force participation into one population metric, healthy working life expectancy (HWLE) was introduced [18, 19]. HWLE is defined as the time that a person at a given age is expected to be healthy and participate in working life until permanent withdrawal from the labour market. This indicator has been in use for several years utilizing varying definitions of “being healthy”, e.g., good self-rated health [20,21,22,23] or absence of disabilities [24].
Socioeconomic differences in labour market participation and age of withdrawal from paid employment are well established [25,26,27]. Workers with low socioeconomic position were more prone to earlier exit from the labour market even after controlling for ill-health [25]. Education, occupation and income are the three most common indicators of socioeconomic position. Even though they are correlated, they capture distinct aspects of socioeconomic position and thus are not interchangeable [28, 29]. Recent studies with a primary focus on socioeconomic differences reported a substantially lower WLE among persons with low education and among manual workers [5, 6, 30].
In the last 10 years, interest in WLE and socioeconomic differences in WLE has grown considerably, and an increasing number of papers are published each year. According to a recent narrative review on indicators and determinants of the years of working life lost, persons with low socioeconomic position have lower WLE and more years of working life lost than those with high socioeconomic position [16]. However, a comprehensive overview of the socioeconomic differences in WLE and HWLE is lacking. With this review, we aim to provide an overview of this quickly expanding body of research. Specifically, we aim to improve the insight on differences in WLE and HWLE by education, occupational class and income while using different ways of measuring and estimating WLE and define future research needs.
Method
To review the existing reports on socioeconomic differences in WLE is demanding because of the vast diversity in fields of research and methodological approaches. We chose to conduct a scoping review instead of a systematic review because the former is better able to map the available research literature and answer broader questions [31, 32]. Furthermore, a scoping review allows to clarify the complex concept of WLE, incorporate various study designs and estimation approaches in both published and grey literature and identify knowledge gaps. In contrast, systematic reviews often have a narrow research question, such as the strength of evidence for association, effectiveness of treatments/interventions. To conduct the scoping review, we followed the five-step methodological framework proposed by Arksey and O’Malley [33].
Step 1: identifying the research question(s)
We identified three research questions for the scoping review: (1) what knowledge is available on socioeconomic differences in WLE and HWLE, (2) do socioeconomic differences in WLE and HWLE vary across different operationalisations of WLE and HWLE (i.e. different ways of measuring and estimating WLE) and (3) what are the challenges that future research on WLE and HWLE should address?
Step 2: identifying relevant studies
We identified relevant studies by searching published articles in the electronic databases Web of Science, PubMed and EMBASE until November 2022, using a combination of the following keywords in text: (“working life expectancy” or “work life expectancy” or “working life duration” or “working years lost” or “labour market affiliation” or “healthy working life expectancy”) and (socioeconomic or education or income or occupation or “occupational class” or “social class”). The search was complemented by additional relevant publications derived through search in Google Scholar, screening of reference lists of the identified publications. Additional references were included according to the knowledge of the authors. We limited our searches to reports written in English but did not use any year of publication limit.
Step 3: study selection
We scanned titles and abstracts, applying three inclusion criteria: (1) the main report’s focus was on WLE or HWLE, (2) reports include a description of estimation method for WLE or HWLE and 3) reports presented results on socioeconomic factors associated with WLE or HWLE. Reports focusing on WLE or HWLE but not showing results on socioeconomic differences in these measures, as well as reports focusing on individual-level measures of working life duration were therefore excluded from the current review. To identify eligible articles, titles and abstracts were screened and full-text reading of potentially relevant articles was performed by the first author. When abstracts provided insufficient information to make a decision on exclusion or inclusion of the reports, a full text was reviewed. Decisions about ambiguous papers were taken together by the authors.
Step 4: charting the data
Data extraction was performed by the first author using predefined tables. The headings in the table were checked and verified by all co-authors. In addition to bibliographic information (authors’ names, publication year, and study location), characteristics of the study population and data sources, we extracted key results and information on operationalization of socioeconomic position and WLE as well as the method and types of working life tables used to estimate WLE. We extracted key results and information on operationalization of socioeconomic factors and WLE (listed labour market states), as well as the method and types of working life tables used to estimate WLE. Two approaches have been used to estimate WLE or HWLE. The prevalence-based approach, sometimes called Sullivan’s method, is based on the prevalence of labour market states and mortality rates, while the incidence-based approach is based on incidence rates that capture transitions between states. Furthermore, the WLE can be estimated using either cohort or period life tables [5, 34, 35]. Period life tables can be constructed based on data from one or a few years. Essentially, the age-specific labour market conditions observed in this brief period are used to cover complete working lives, thus representing synthetic working trajectories. In contrast, cohort life tables are constructed based on real working life trajectories. Selection of the approaches is commonly driven by data availability. For those reports that in addition to WLE presented results for WYL we also extracted information on socioeconomic differences in WYL.
The data extraction was checked and verified by all co-authors and in more detail by TL and AdW.
We did not perform a quality assessment of the included studies as this review was aiming to map published empirical research in the field regardless of the quality of the studies.
Step 5: collating, summarizing, and reporting
For quantitative data synthesis, we included only the studies with population-representative data. To synthesize information on the magnitude of educational, occupational class and income differences in WLE, HWLE and WYL, we calculated the absolute difference (years) in the outcome of interest between the highest and lowest socioeconomic categories. In order to examine variation in socioeconomic differences across different age groups and across different operationalizations of WLE, we also calculated the relative difference by dividing the years-difference between the highest and lowest socioeconomic categories by remaining potential working years. The remaining potential working years were calculated as years from the specific age (for which expectancy was estimated) until age 65. For example, for WLE at age 30, the remaining potential working years equalled 35 years.
Results
Literature search and exclusion of studies
Figure 1 presents a flow chart of the literature search and the inclusion and exclusion of records. The literature search of reports published before November 2022 yielded 54 records, including 23 duplicates. In addition, 12 potentially relevant publications were selected from the reference lists or suggested by the experts. A total of 43 records were screened based on title and abstract. Of the 38 publications eligible for full-text reading, 26 reports from 21 studies were included into the review [1, 2, 4,5,6, 21, 24, 30, 34, 36,37,38,39,40,41,42,43,44,45,46,47,48,49,50,51,52]. Six of the twelve excluded reports were excluded because they focused on retirement age instead of WLE. Excluded reports and explanation for their exclusion based on the full-text reading are shown in the Supplement (Table S1). Of the duplicated reports from the same study the results of the first report were included into quantitative analyses (Supplementary Table S2).
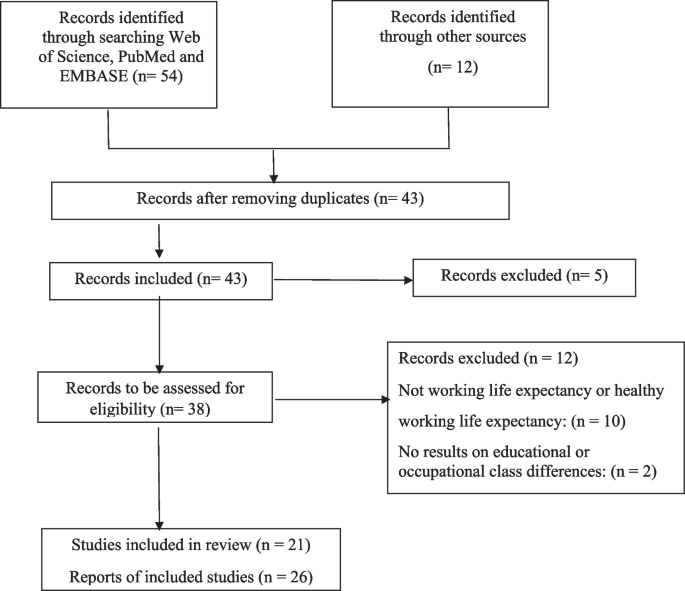
Flow chart of selection of sources of evidence
Overall study characteristics
Table 1 presents a description of the included reports. Studies were conducted in the United States (n = 7), Finland (n = 3), Spain (n = 3), The Netherlands (n = 3), United Kingdom (n = 3), Germany (n = 2), Italy (n = 1), Denmark (n = 1), and Turkey (n = 1). Two reports presented results for several European countries. All reports were published between 1990 and 2022, with the majority (16 out of 26) published during the past five years.
The WLE or related measures were estimated using self-reports in 19 reports and register data in seven reports (Table 2). WLE was most frequently (n = 15) defined as employment expectancy. It was defined as economic activity expectancy (including employment and unemployment) in eight reports and as productive work expectancy (employed and not being e.g., on sickness absence or in subsidized employment) in two reports. In the vast majority of the reports (n = 21), the incidence-based approach was used for estimation of WLE. Only one report [50] used continuous transitions, a few reports used monthly transitions, while in the remaining reports, data were interval-censored with one or more years between the transitions. One report performed a simulation of life trajectories based on estimated hazard rates for mortality, employment, and retirement [39]. Five reports presented socioeconomic differences in HWLE. Half of the reports also explored socioeconomic differences in WYL. The vast majority of the included reports (n = 21; 81%) examined educational differences in WLE or related indicators, while fewer reports (n = 7) examined social/occupational class differences. No reports on income differences in WLE or related measures were found.
Five reports did not include numerical results for specific socioeconomic categories and were excluded from the data synthesis [2, 40, 47,48,49]. A study by Tetzlaff and co-authors [52] was excluded because it utilized very specific data of a particular region of Germany as well as of a particular health insurance.
Educational differences
All studies found a longer WLE among persons with high education compared to those with low education (Supplementary Table S3). Most of the studies observed a larger absolute educational difference in WLE at ages between 15 and 40 years among women than men (Fig. 2A). Gender gap in the educational differences in WLE after age of 45 was relatively small. Across all ages, absolute educational differences in WLE tended to be smaller among initially employed than initially economically active (including both employed and unemployed) or inactive individuals (Fig. 2A).

Educational differences in WLE among men and women. A Absolute differences (years); B Relative differences (share of remaining working life)
In most of the studies, relative differences between persons with high and low education were somewhat similar between men and women irrespective of the initial labour market state and age at which WLE was estimated (Fig. 2B). As compared with high-educated persons, working life years of low-educated persons were expected to be, on average, 30% shorter among men and 27% among women. The magnitude of differences varied noticeably by definition used for WLE and study population, particularly among women (Table 3). Studies with WLE defined as economic activity expectancy (including both employment and unemployment) reported the largest educational difference (mean 38% among men and 41% among women). In such studies, differences in the general population were smaller than in populations initially economically active or inactive. Studies with WLE defined as productive work expectancy (time expected to be at work) reported the smallest educational differences (mean 11% among men and 18% among women).
The magnitude of educational differences between incidence- and prevalence-based methods was similar. However, studies using incidence-based methods based on data with short censoring intervals (i.e., less than a year) reported smallest educational differences. Studies which used cohort life tables for calculations of WLE, tended to report smaller educational differences than studies which used period life tables.
Differences in WLE at age 50 between high and low-educated persons, which were most examined, varied considerably across the studies (from 0.40 to 9.90 years among men and from 0.50 to 9.80 among women). On average, WLE at age 50 among low-educated persons was 5.1 (men) and 4.6 years (women) shorter than among high-educated persons (median values 5.4 and 4.4 years among men and women, respectively). The smallest educational differences (0.40 and 0.50 among men and women, respectively) were reported in a general population study [30], where WLE was defined as years expected to be in paid employment and estimated using incidence-based approach with monthly transitions between the labour market states.
Occupational class differences
Occupational class differences were found in all studies, and individuals in non-manual occupations had longer WLE than individuals in manual occupations (Supplementary Table S3). Larger occupational class differences in WLE among women than men were found in the study by Dudel and co-authors [4], while in the other studies, differences were similar in both genders (Fig. 3A and B). As compared with persons belonging to high occupational class, working life years of persons in low occupational class was expected to be, on average, shorter by 21% (median: 22%) among men and 27% (median: 28%) among women.

Occupational class differences in WLE among men and women. A Absolute differences (years); B Relative differences (share of remaining working life)
The smallest occupational class differences were found in the study of initially employed men and women, where incidence-based approach and continuous scheme of observations (data were not interval-censored) was used for estimation of WLE [50].
Socioeconomic differences in healthy working life expectancy
Two studies examined educational differences in both WLE and HWLE. Smaller educational differences in HWLE than in WLE at age 50 (3.50 vs. 3.80 years) were found in a study by Parker et al. [21]. While according to another study [24] educational differences in HWLE at age 58 were much larger than in WLE, being 1.4 and 0.8 years, respectively (Supplementary Table S3). Larger occupational class differences in HWLE than in WLE at age 50 were found, being 1.60 and 1.40 years, respectively [21] (Supplementary Table S3).
Socioeconomic differences in working years lost
Six out of 13 studies that explored socioeconomic differences in WYL presented results for WYL due to unemployment, disability and early retirement (Table 2, Supplementary Table S4). All studies found that irrespective of age low-educated persons are expected to lose more working years due to unemployment and disability retirement than high-educated persons. (Supplementary Figure S1, Supplementary Table S4). However, the opposite phenomenon was seen for WYL due to early retirement. Overall, in both genders, educational differences for WYL due to unemployment were larger than for disability retirement. Educational differences in WYL due to unemployment at age 15–40 years were on average 0.6 years larger among women than men (vary from 0.8 to 7.4 years and from 0.7 to 5.7 years in women and men, respectively). In contrast, Robroek and co-authors [6] found larger educational differences in WYL due to disability retirement among men than women.
All studies found that irrespective of age, persons belonging to low occupational class are expected to lose more working years due to unemployment and disability retirement than persons in high occupational class (Supplementary Figure S2, Supplementary Table S4). Both men and women in low occupational class at age 50 were expected to lose about one year more than persons belonging to high occupational class due to unemployment.
Discussion
Our main findings reveal that irrespective of socioeconomic indicator, persons with low socioeconomic position have shorter WLE than those with high socioeconomic position. On average, WLE in persons with low education is 29% (men) and 27% (women) shorter than in those with high education. The magnitude of educational differences varies noticeably depending on the definition used for WLE and study population. Overall, the occupational class differences in WLE were more pronounced among women than men (with mean difference being 27% vs. 21%). Among low-educated persons more working years were lost due to unemployment and disability retirement but less due to other types of non-employment than among high-educated persons. Moreover, educational differences in WYL due to unemployment were larger than due to disability retirement.
In general, WLE represents the average expected working life duration for individuals at a specific age. Different definitions of WLE are used in the literature to capture the dynamic patterns of entering, exiting and re-entering employment during the lifespan and to distinguish between employment and non-employment labour market states, as well as healthy and unhealthy working life. For this review, we included the following most commonly used definitions: economic activity expectancy (expected years in either paid employment or unemployment), employment expectancy (expected years in paid employment), productive work expectancy (expected years in paid employment, excluding sickness absence) and healthy WLE (expected years in working life while being in “good health”).
The direction of socioeconomic differences in WLE that we found, was expected, knowing socioeconomic inequalities in labour market attachment, health and life expectancy exist [53,54,55,56]. However, we observed a noticeable variation in the magnitude of educational differences in WLE across the studies. One of the reasons for the large variation in the educational differences is the variation in methods to estimate WLE. WLE is a probabilistic construct, estimated using multistate models based on ether period or cohort life tables, of which the first one is most frequently used. WLE, building on life tables for a given period (one year or several years), describes patterns of labour market attachment in a synthetic or hypothetical cohort with an assumption that the age-specific mortality and participation rates in different labour market states during remaining years will be the same as those observed in that period. This is a rather strong assumption, which might be violated and not necessary be realizable similarly across different study populations, age groups, as well as time periods. The larger the deviation from the assumption is, the higher the likelihood of bias in the WLE estimates will be. Furthermore, the direction of bias might be different for different subgroups of the study population. At younger age the WLE is likely overestimated, while at older age it is likely underestimated. For people below age of 30 years, high heterogeneity in labour market participation of people increases uncertainty for the estimation of WLE.
The studies included into our review were very heterogeneous with regard to factors that may influence the socioeconomic differences in WLE (e.g., operationalization of WLE, study population, categorization of socioeconomic factors, methods of estimation of WLE). Due to above mentioned reasons the absolute socioeconomic differences in WLE across different ages as well as different study populations or subgroups are not comparable. As such, in the current review we used relative socioeconomic differences to better understand the reasons for the large observed variation in the socioeconomic differences in WLE across the studies.
We found that studies with WLE defined as economic activity expectancy reported the largest differences, while the smallest differences were found for productive work expectancy. WLE defined as economic activity expectancy covers both employment and unemployment and thus will result in higher estimates of the WLE, as compared with narrower definitions.
Large variation in the reported socioeconomic differences can also be attributed to the stage of economic cycle when WLE was estimated/calculated. Educational differences might be intensified during the economic crisis since less-educated persons are more vulnerable to unemployment than higher-educated persons [34, 57]. Unemployment, in particular long-term unemployment, is increasing during economic recession. Dudel and co-authors [4] examined the influence of economic crisis on WLE in Spain and found a tremendous effect, which differed largely by gender and occupational category. Among unskilled manual workers, the average proportion of lifetime spent in unemployment and outside the labour market, increased markedly during the economic crisis, while it remained at the same level among people in skilled non-manual occupations.
Knowing that health is an important contributor to earlier permanent withdrawal from the labour market [13, 58], decomposition of WLE to healthy and unhealthy WLE is warranted. A recent study in 14 countries within the Organisation for Economic Co-operation and Development, found noticeable cross-country variation in trends of HWLE between 2002 and 2017, while an increasing trend in unhealthy WLE was observed in most of the countries [22]. Five reports on HWLE from three studies were included in the current review. All studies observed longer HWLE at age 50 and later among individuals with high socioeconomic position than among those with low socioeconomic position. However, the magnitude of the differences varied across the studies.
An association of income level with morbidity and mortality is well documented [59,60,61]. Since 2001, the income-related health gap widened substantially in most of the western countries due to the faster increase in life expectancy among individuals with higher incomes than those with lower incomes [62, 63]. How income influences working life duration is poorly understood, since no reports on the association of income with either WLE or HWLE was captured by our searches. The lack of reports on income inequality in WLE might be partly due to the fact that income is much more volatile than education or occupational class.
There are several methodological choices and challenges in examining socioeconomic differences in WLE. Most importantly, the levels of WLE and inequalities in WLE differ depending on the study population or sub-populations where it is estimated; depending on whether a cohort perspective or a period perspective is used; and depending on whether prevalence-based or incidence-based methods are applied.
For example, results on educational differences in WLE at age 50 from two Dutch studies were very different. One study [30] found that WLE at age 50 in low-educated people was by 0.4 (men) and 0.5 (women) years shorter than in high-educated people. The corresponding numbers in another study [6], were 2.5 and 3.4 years in men and women, respectively. The study population of the former study consisted of around 12 000 participants of the online STREAM cohort. While the latter study utilized nationally representative data from Statistics Netherlands on about 5 million individuals. Otherwise, both studies were similar with regard of WLE definition and estimation method, as well as educational categories. Similarly, occupational class differences in WLE at age 50 varied in two Finnish studies. In one study, in both genders the WLE at age 50 among manual workers was 3.6 years shorter than among upper-level non-manual workers [5]. In another study, the difference in WLE between manual and upper-level non-manual workers was only 1 year [50]. The two studies differed with regard to study population (general vs. employed), WLE definition (employment vs. productive work expectancy) and method of estimation (prevalence- vs. incidence-based). The occupational class differences in the second study [50] are likely underestimated due to healthy worker effect. Manual workers are more likely to leave the labour force before age of 50 years due to reduced workability than the upper-level non-manual workers. The examples presented above suggest that the socioeconomic differences in WLE at age of 50 might be attenuated due to selection bias in the study population.
Dudel and Myrskylä [35] found that the same data can show increases in WLE in the period perspective but stagnation or decline of WLE in the cohort perspective. The increase in period WLE was caused by an increase in employment rates in the most recent years of the data; however, this increase did not compensate for reductions in employment rates some birth cohorts experienced in earlier periods, leading to the decrease in the cohort perspective. Incidence-based methods are known to capture sudden changes in employment better than prevalence-based methods which is particularly relevant if the data used in an analysis includes a macroeconomic shock like a recession (e.g., Dudel et al. [4]).
Moreover, we found that levels of inequalities also depend on whether period or cohort WLE is estimated. This is due to the fact that period WLE can amplify group differences, in particular if there are macroeconomic shocks. This is because period WLE for a period affected by a shock implicitly assumes that individuals are exposed to the resulting adverse economic conditions throughout their whole life, while real cohorts usually only experience these conditions for a few years. Moreover, members of real cohorts might try to compensate for years of working life lost once economic conditions improve (e.g., they might extend time of old age retirement due to less pension savings) while this is not captured in period WLE. However, the direction of the inequalities found in the literature is rather consistent irrespective of the specific methods used.
Strengths and limitations
To our knowledge, the present study is the first to review the literature on educational and occupational class differences in WLE and HWLE. We believe that our search strategy allowed us to broadly capture the relevant scientific reports on this topic. We used a standard data extraction form for each report included in the scoping review, thus our summarized information should be as robust and standardized as possible. However, the current review also has limitations. Due to heterogeneity of included reports and large differences in the country context which influenced the results, we were neither able to conduct a systematic review nor a meta-analysis of the findings. Instead, we aimed to overview which different operationalizations of WLE, as well as socioeconomic indicators, were used in the literature and identify the methodological challenges in analysing the socioeconomic differences in WLE. In particular, we examined whether the magnitude of socioeconomic differences varies by the used indicators, by different study populations or according to different definitions of WLE and approaches used for its estimation. We focused on WLE and did not include measures of the length of working life which do not account for all possible labour market transitions; one example of such a a measure is the effective retirement age [64, 65].
Future research needs
There is a need for further research on several aspects of WLE. First, the majority of studies focuses on a single country, and only very little comparative research is available (e.g., [1]). Such research is essential for understanding how different institutional contexts and policy regimes are shaping WLE and potentially influencing socioeconomic inequalities in WLE. However, differences in the distribution of socioeconomic position across the countries challenge comparability of results. It could be of interest to use inequality measures, such as relative index of inequality and the slope index of inequality, for comparisons of the socioeconomic gradient in WLE.
Second, almost all studies on WLE are rather descriptive, with only a few exceptions. This means that the drivers and causes of trends and inequalities in WLE are poorly understood. There is no “golden standard” regarding operationalization of WLE and estimation methods, which are typically selected based on data availability. Several factors may cause uncertainty in the estimates, with the direction of bias (overestimation or underestimation) changing and depending on specific circumstances and interplay of those factors. Therefore, future studies should pay attention to more detailed reporting about study population, institutional context, operationalization of WLE, analytical approaches for estimation and underlying assumptions.
Studies which are connecting WLE to health and working conditions have emerged recently [66], starting to fill this gap. Nevertheless, more research is needed. The study of WLE could be further extended to include characteristics of employment, such as full- vs. part-time or the quality of work [67]. Finally, most studies focus on a rather wide age range. Some studies have shown that there are specific years which are particularly vulnerable. For instance, Dudel et al. [4] provide evidence that young Spanish workers below age 30 were particularly affected by the financial crisis in 2007/8. Identifying such vulnerable groups of workers will help design better targeted labour market and pension policies. Most of the studies included into this review examined educational differences in WLE, while no studies on income differences were found. Furthermore, socioeconomic differences in HWLE are largely unknown. Future research is needed to fill the knowledge gap on HWLE and potential influences of income on working life duration.
Conclusions
This scoping review adds to the literature in several ways. We provide the first review of socioeconomic inequalities in WLE and HWLE. Our results show that disparities between socioeconomic groups are often substantial, and persistent over time and across countries. Moreover, our results show a large variability in the levels of inequalities, depending on the age at which WLE is measured; the operationalization of WLE (including definition and estimation method) and socioeconomic position; the institutional context and the examined study population.
The directions of the inequalities are, however, largely consistent across studies. That is, higher-educated individuals tend to have longer WLE than lower-educated individuals, and individuals in non-manual occupations work longer than individuals in manual occupations. Overall, our findings show that despite these consistencies, some caution is advisable when comparing studies of WLE. The inequalities we report are highly relevant for policy makers and pose serious challenges to equitable retirement and pension policies. Many policy interventions aimed at increasing the length of working life follow a one-size-fits-all approach, which does not take these inequalities into account.
Availability of data and materials
All data relevant to the study are included in the article or uploaded as supplementary information.
Abbreviations
- WLE:
-
Working life expectancy
- HWLE:
-
Healthy working life expectancy
- WYL:
-
Working years lost
References
Loichinger E, Weber D. Trends in Working Life Expectancy in Europe. J Aging Health. 2016;28:1194–213.
Weber D, Loichinger E. Live longer, retire later? Developments of healthy life expectancies and working life expectancies between age 50–59 and age 60–69 in Europe. Eur J Aging. 2020;19:75–93.
Eurostat. Steady increase in the expected duration of working life in the EU. Eurostat 2022b; Statistics Explained, June 2022. Available at: https://ec.europa.eu/eurostat/statistics-explained/index.php?title=Duration_of_working_life_-_statistics#Steady_increase_in_the_expected_duration_of_working_life_in_the_EU. (Accessed 10 July 2023).
Dudel C, López Gómez MA, Benavides FG, Myrskylä M. The length of Working Life in Spain: levels, recent trends, and the impact of the Financial Crisis. Eur J Popul. 2018;34:769–91.
Leinonen T, Martikainen P, Myrskylä M. Working Life and Retirement expectancies at Age 50 by Social Class: Period and Cohort trends and projections for Finland. J Gerontol B Psychol Sci Soc Sci. 2018;73:302–13.
Robroek SJ, Nieboer D, Järvholm B, Burdorf A. Educational differences in duration of working life and loss of paid employment: working life expectancy in the Netherlands. Scand J Work Environ Health. 2020;46:77–84.
Siegel JS. The Life Table. In: Siegel JS. The Demography and Epidemiology of Human Health and Aging. Springer, Dordrecht. 2012; pp 135–216. Available at https://link.springer.com/book/10.1007/978-94-007-1315-4.
Nurminen MM, Heathcote CR, Davis BA, Puza BD. Working life expectancies: the case of Finland 1980–2006. J R Statist Soc A. 2005;168:567–81.
Pedersen J, Bjorner JB. Worklife expectancy in a cohort of Danish employees aged 55–65 years - comparing a multi-state Cox proportional hazard approach with conventional multi-state life tables. BMC Public Health. 2017;17:879.
Hytti H, Nio I. Monitoring the employment strategy and the duration of active working life. Helsinki: Kela – The Social Insurance Institution, Finland; 2004. Social security and health research: working papers no 38. Available at: https://helda.helsinki.fi/items/eb70342e-244a-4f43-8889-1bfe116195ba/full. (Accessed 10 July 2023).
van den Berg T, Schuring M, Avendano M, Mackenbach J, Burdorf A. The impact of ill health on exit from paid employment in Europe among older workers. Occup Environ Med. 2010;67:845–52.
Takala J, Hämäläinen P, Saarela KL, Yun LY, Manickam K, Jin TW, et al. Global estimates of the burden of injury and illness at work in 2012. J Occup Environ Hyg. 2014;11:326–37.
van Rijn RM, Robroek SJ, Brouwer S, Burdorf A. Influence of poor health on exit from paid employment: a systematic review. Occup Environ Med. 2014;71:295–301.
Leinonen T, Laaksonen M, Chandola T, Martikainen P. Health as a predictor of early retirement before and after introduction of a flexible statutory pension age in Finland. Soc Sci Med. 2016;58:149–57.
Gondek D, Ning K, Ploubidis GB, Nasim B, Goodman A. The impact of health on economic and social outcomes in the United Kingdom: a scoping literature review. PLoS ONE. 2018;13: e0209659.
Shiri R, Hiilamo A, Lallukka T. Indicators and determinants of the years of working life lost: a narrative review. Scand J Public Health. 2021;49:666–74.
Hasselhorn HM, Leinonen T, Bültmann U, Mehlum IS, du Prel JB, Kiran S, et al. The differentiated roles of health in the transition from work to retirement - conceptual and methodological challenges and avenues for future research. Scand J Work Environ Health. 2022;48:312–21.
Lievre A, Jusot F, Barnay T, Sermet C, Brouard N, Robine JM, et al. Healthy working life expectancies at age 50 in Europe: a new indicator. J Nutr Health Aging. 2007;11:508–14.
Dudel C. Healthy and unhealthy working-life expectancy: opportunities and challenges. Lancet Healthy Longev. 2021;2:e604-605.
de Wind A, van der Noordt M, Deeg DJH, Boot CRL. Working life expectancy in good and poor self-perceived health among Dutch workers aged 55–65 years with a chronic disease over the period 1992–2016. Occup Environ Med. 2018;75:792–7.
Parker M, Bucknall M, Jagger C, Wilkie R. Population-based estimates of healthy working life expectancy in England at age 50 years: analysis of data from the English Longitudinal Study of Ageing. Lancet Public Health. 2020;5:e395-403.
Boissonneault M, Rios P. Changes in healthy and unhealthy working-life expectancy over the period 2002-17: a population-based study in people aged 51–65 years in 14 OECD countries. Lancet Healthy Longev. 2021;2:e629-638.
Laaksonen M, Elovainio M, Kainulainen S, Leinonen T, Jääskeläinen T, Rissanen H, et al. Changes in healthy and unhealthy working life expectancies among older working-age people in Finland, 2000–2017. Eur J Public Health. 2022;32:729–34.
van der Noordt M, van der Pas S, van Tilburg TG, van den Hout A, Deeg DJ. Changes in working life expectancy with disability in the Netherlands, 1992–2016. Scand J Work Environ Health. 2019;45:73–81.
Schuring M, Robroek SJ, Otten FW, Arts CH, Burdorf A. The effect of ill health and socioeconomic status on labor force exit and re-employment: a prospective study with ten years follow-up in the Netherlands. Scand J Work Environ Health. 2013;39:134–43.
Schram JLD, Schuring M, Oude Hengel KM, Burdorf A. Health-related educational inequalities in paid employment across 26 European countries in 2005–2014: repeated cross-sectional study. BMJ Open. 2019;9: e024823.
Rohrbacher M, Hasselhorn HM. Social inequalities in early exit from employment in Germany: a causal mediation analysis on the role of work, health, and work ability. Scand J Work Environ Healthy. 2022;48:569–78.
Shavers VL. Measurement of socioeconomic status in health disparities research. J Natl Med Assoc. 2007;99:1013–23.
Darin-Mattsson A, Fors S, Kåreholt I. Different indicators of socioeconomic status and their relative importance as determinants of health in old age. Int J Equity Health. 2017;16:173.
Schram JLD, Schuring M, Oude Hengel KM, Burdorf A, Robroek SJW. The influence of chronic diseases and poor working conditions in working life expectancy across educational levels among older employees in the Netherlands. Scand J Work Environ Health. 2022;48:391–8.
Levac D, Colquhoun H, O’Brien KK. Scoping studies: advancing the methodology. Implement Sci. 2010;5:1–9.
Munn Z, Peters MDJ, Stern C, Tufanaru C, McArthur A, Aromataris E. Systematic review or scoping review? Guidance for authors when choosing between a systematic or scoping review approach. BMC Med Res Methodol. 2018;18(1):143.
Arksey H, OʼMalley L. Scoping studies: towards a methodological framework. Int J Soc Res Meth. 2005;8:19–32.
Dudel C, Myrskylä M. Working Life Expectancy at Age 50 in the United States and the impact of the great recession. Demography. 2017;54:2101–23.
Dudel C, Myrskylä M. Cohort trends in Working Life Expectancies at Age 50 in the United States: a Register-based study using Social Security Administration Data. J Gerontol B Psychol Sci Soc Sci. 2020;75:1504–14.
Hayward MD, Grady WR. Work and retirement among a cohort of older men in the United States, 1966–1983. Demography. 1990;27:337–56.
Hayward MD. Lichter a life cycle model of labour force inequality. Extending Clogg’s life table approach. Soc Meth Res. 1998;26:480–510.
Millimet DL, Nieswiadomy M, Ryu H, Slottje D. Estimating worklife expectancy: an econometric approach. J Econometrics. 2003;113:83–113.
Karlsson M, Mayhew L, Rickayzen B. Individualised life tables. Investigating dynamics of health, work and cohabitation in the UK. Pop Ageing. 2009;1:153–91.
Millimet DL, Nieswiadomy M, Slottje DJ. Detailed estimation of worklife expectancy for the measurement of human capital: accounting for marriage and children. J Econom Surv. 2010;24:339–61.
Skoog GR, Ciecka JE, Krueger KV. The Markov Process Model of Labor Force Activity: Extended Tables of Central Tendency, Shape, Percentile Points, and Bootstrap Standard Errors. J Forensic Econ. 2011;22:165–229.
Nurminen M. Working-life expectancy in Finland: trends and differentials 2000–2015. A multistate regression modeling approach. Helsinki: Finnish Centre for Pensions; 2012. Finnish Centre for Pensions report no 3. Available at: https://www.julkari.fi/bitstream/handle/10024/129432/WorkinglifeexpectancyinFinlandtrendsanddifferentials20002015Amultistateregressionmodelingapproach.pdf?sequence=1&isAllowed=y. (Accessed 10 July 2023).
Krueger KV, Slesnick F. Total worklife expectancy. J Forensic Econ. 2014;25:51–70.
Özer MN, The Effects of Education and Marital Status on Female Working Life Expectancy in Turkey. An application of multistate life table for 2009–2010. Ankara: Thesis Center: 2014. Master thesis no 356184. Available at: https://tez.yok.gov.tr/UlusalTezMerkezi/tezSorguSonucYeni.jsp. (Accessed 10 July 2023).
Lorenti A, Dudel C, Myrskyla M. The legacy of the great recession in Italy: a wider geographical, gender, and generational gap in Working Life Expectancy. Soc Indic Res. 2019;142:283–303.
Stanek M, Requena M. Expected lifetime in different employment statuses: evidence from the Economic Boom-and-bust cycle in Spain. Res Aging. 2019;41:286–309.
Lorenti A, Dudel C, Hale JM, Myrskylä M. Working and disability expectancies at older ages: the role of childhood circumstances and education. Soc Sci Res. 2020;91: 102447.
Dudel C, Loichinger E, Klüsener S, Sulak H, Myrskylä M. The extension of late working life in Germany: trends, inequalities, and the East-West divide. Rostock: Max Planck Institute for Demographic Research (MPIDR). MPIDR Working Paper 2021;No.WP-2021-018. Available at https://doi.org/10.4054/MPIDR-WP-2021-018 or https://nbn-resolving.org/urn:nbn:de:0168-ssoar-77024-2 (Accessed 10 July 2023).
Nexø MA, Pedersen J, Cleal B, Andersen I, Bjørner JB. Working life expectancies among individuals with type 1 and type 2 diabetes over a 30-year period. Scand J Work Environ Health. 2021;47:540–9.
Schram JL, Solovieva S, Leinonen T, Viikari-Juntura E, Burdorf A, Robroek SJ. The influence of occupational class and physical workload on working life expectancy among older employees. Scand J Work Environ Health. 2021;47:5–14.
Lynch M, Bucknall M, Jagger C, Wilkie R. Healthy working life expectancy at age 50 for people with and without osteoarthritis in local and national English populations. Sci Rep. 2022;12:2408.
Tetzlaff J, Luy M, Epping J, Geyer S, Beller J, Stahmeyer JT, et al. Estimating trends in working life expectancy based on health insurance data from Germany - challenges and advantages. SSM Popul Healthy. 2022;19:101215.
Schuring M, Robroek SJ, Lingsma HF, Burdorf A. Educational differences in trajectories of self-rated health before, during, and after entering or leaving paid employment in the European workforce. Scand J Work Environ Health. 2015;41:441–50.
Heggebø K, Tøge AG, Dahl E, Berg JE. Socioeconomic inequalities in health during the great recession: a scoping review of the research literature. Scand J Public Health. 2019;47:635–54.
Turek K, Henken Ks KM. Gender and Educational Inequalities in Extending Working Lives: Late-Life Employment Trajectories Across Three Decades in Seven Countries. Work, Aging and Retirement, 2022;, waac021, Available at: https://doi.org/10.1093/workar/waac021. (Accessed 10 July 2023).
Dudel C, van Raalte AA. Educational inequalities in life expectancy: measures, mapping, meaning. J Epidemiol Community Health. 2023. https://doi.org/10.1136/jech-2023-220633. (Online ahead of print).
Coile CC, Levine PB. Recessions, retirement, and social security. Am Econom Rev. 2011;101:23–8.
Schuring M, Schram JL, Robroek SJ, Burdorf A. The contribution of health to educational inequalities in exit from paid employment in five European regions. Scand J Work Environ Health. 2019;45:346–55.
Islam MS, Mondal MNI, Tareque MI, Rahman MA, Hoque MN, Ahmed MM, et al. Correlates of healthy life expectancy in low- and lower-middle-income countries. BMC Public Health. 2018;18:476.
Head J, Chungkham HS, Hyde M, Zaninotto P, Alexanderson K, Stenholm S, et al. Socioeconomic differences in healthy and disease-free life expectancy between ages 50 and 75: a multi-cohort study. Eur J Public Health. 2019;29:267–72.
Chen H, Ning J, Hu H, He H. Distribution of the compression and expansion of morbidity in 194 countries and territories, 1990–2016: The role of income inequality. Sociol Health Illn. 2023; Apr 13. https://doi.org/10.1111/1467-9566.13645. Online ahead of print.
Tetzlaff F, Epping J, Sperlich S, Tetzlaff J. Widening income inequalities in life expectancy? Analysing time trends based on German health insurance data. J Epidemiol Community Health. 2020;74:592–7.
Fors S, Wastesson JW, Morin L. Growing income-based inequalities in Old-Age Life Expectancy in Sweden, 2006–2015. Demography. 2021;58:2117–38.
Kadefors R, Nilsson K, Ostergren PO, Rylander L, Albin M. Social inequality in working life expectancy in Sweden. Z Gerontol Geriatr. 2019;52(Suppl 1):52–61.
Riekhoff AJ, Kuitto K. Educational differences in extending working lives. Trends in effective exit ages in 16 European countries. Helsinki; 2022: Finnish Centre for Pensions, Finnish Centre for Pensions Studies no 02/2022 Available at: https://urn.fi/URN:ISBN978-951-691-345-5. (Accessed 10 July 2023).
Plana-Ripoll O, Weye N, Knudsen AK, Hakulinen C, Madsen KB, Christensen MK, et al. The association between mental disorders and subsequent years of working life: a Danish population-based cohort study. Lancet Psychiatry. 2023;10:30–9.
Hale JM, Dudel C, Lorenti A. Cumulative disparities in the dynamics of working poverty for later career U.S. Workers (2002–2012). Socius. 2021;7. https://doi.org/10.1177/2378023120987332. Accessed 27 Jan 2024.
Acknowledgements
This review was conducted as a part of The Exposome Project for Health and Occupational Research (EPHOR) project funded by the European Union’s Horizon 2020 research and innovation programme under grant agreement number 874703 (SS, KU, ISM and TL). Additional support was provided by Strategic Research Council, grant number 345170 (TL and SS). Christian Dudel was supported by grants to the Max Planck – University of Helsinki Center from the Max Planck Society, the Jane and Aatos Erkko Foundation, the Faculty of Social Sciences at the University of Helsinki, and the Cities of Helsinki, Vantaa, and Espoo. The funders have no involvement in the conducting, writing and submission of the review.
Funding
This work was supported by the European Union’s Horizon 2020, grant agreement number 874703 (SS, KU, ISM and TL) and Strategic Research Council, grant number 345170 (TL and SS). Christian Dudel was supported by grants to the Max Planck – University of Helsinki Center from the Max Planck Society, the Jane and Aatos Erkko Foundation, the Faculty of Social Sciences at the University of Helsinki, and the Cities of Helsinki, Vantaa, and Espoo. The funders have no involvement in the conducting, writing and submission of the review.
Author information
Authors and Affiliations
Contributions
All authors are responsible for the conception of the study and contributed to the development of design. S.S screened all citation, reviewed full-text articles and extracted the data. A.d.W reviewed full-text selected articles. All authors verified the data extraction form. S.S synthesized the results and drafted the manuscript. All authors provided important intellectual contribution and guidance throughout the development of the manuscript. All authors contributed, edited and approved the final version of this manuscript. S.S and A.d.W acted as guarantors.
Corresponding author
Ethics declarations
Ethics approval and consent to participate
Not applicable.
Consent for publication
Not applicable.
Competing interests
The authors declare no competing interests.
Additional information
Publisher’s Note
Springer Nature remains neutral with regard to jurisdictional claims in published maps and institutional affiliations.
Supplementary Information
Rights and permissions
Open Access This article is licensed under a Creative Commons Attribution 4.0 International License, which permits use, sharing, adaptation, distribution and reproduction in any medium or format, as long as you give appropriate credit to the original author(s) and the source, provide a link to the Creative Commons licence, and indicate if changes were made. The images or other third party material in this article are included in the article's Creative Commons licence, unless indicated otherwise in a credit line to the material. If material is not included in the article's Creative Commons licence and your intended use is not permitted by statutory regulation or exceeds the permitted use, you will need to obtain permission directly from the copyright holder. To view a copy of this licence, visit http://creativecommons.org/licenses/by/4.0/. The Creative Commons Public Domain Dedication waiver (http://creativecommons.org/publicdomain/zero/1.0/) applies to the data made available in this article, unless otherwise stated in a credit line to the data.
About this article

Cite this article
Solovieva, S., de Wind, A., Undem, K. et al. Socioeconomic differences in working life expectancy: a scoping review. BMC Public Health 24, 735 (2024). https://doi.org/10.1186/s12889-024-18229-y
Received:
Accepted:
Published:
DOI: https://doi.org/10.1186/s12889-024-18229-y