
Abstract
Background
Internationally, the Patient Health Questionnaire-9 (PHQ-9) is commonly used to assess the frequency and severity of depressive symptoms. However, psychometric properties of the Norwegian version of the PHQ-9 have only been assessed in adolescents. We present normative data for women and an evaluation of the psychometric properties (internal consistency, convergent validity, and factor structure) of the Norwegian PHQ-9 among women with and without eating disorders (ED).
Methods
In this case-control study, a total of 793 females aged 18–78 years (mean 30.39; SD 9.83) completed an online self-report assessment. Measures included the ED100K and Eating Disorder Examination Questionnaire (EDE-Q) to assess ED psychopathology, and the Generalized Anxiety Disorder (GAD) scale and Difficulties in Emotion Regulation Scale Short Form (DERS-SF) to assess symptoms of anxiety and emotion regulation deficits. Participants were categorized into three groups, i.e., previous ED (19.7%, n = 148), current ED (36.3%, n = 272), and no history of ED (44.0%, n = 330), based on self-reported scores on the ED 100 K and the EDE-Q.
Results
Mean PHQ-9 total score for those with a previous history of ED was 10.67 (SD 6.33), for those with a current ED 16.61 (SD 5.84), and for those with no lifetime history of ED 6.83 (SD 5.58). Excellent internal consistency was demonstrated by Cronbach’s alpha’s for individuals with a previous ED (.88), for individuals with a current ED (.86), and for individuals with no history of ED (.88). Acceptable convergent validity was indicated based on significant correlations between the PHQ-9 and GAD-7 and DERS-SF. Confirmatory Factor Analyses revealed a mediocre fit for a one-factor structure of the PHQ-9, regardless of diagnostic status.
Conclusions
The psychometric properties of the Norwegian version of the PHQ-9 are acceptable across females with and without ED, and the PHQ-9 can be recommended for use in clinical ED settings and for people without mental disorders.
Background
Depression is a common and serious mood disorder characterized by persistent feeling of sadness and hopelessness, loss of interest in previously enjoyed interests [1], and emotion regulation difficulties [2]. Commonly reported comorbid conditions include chronic somatic illness such as inflammatory bowel disease [3], diabetes [4], cardiovascular disease [5], and psoriasis [6], as well as psychiatric illness, including substance abuse [7], anxiety [8], and eating disorders (ED) [9]. ED are characterized by restricted or dysregulated food intake, distorted body image, and preoccupation with food, weight, and shape [1]. While general population prevalence estimates of depression vary from 17 to 31% [10], prevalence estimates of depression among individuals with ED have been reported to be as high as 75% [11]. However, estimates vary considerably depending on methodological approaches [12]. Depressive disorders are among the leading causes of worldwide burden, and are the second leading cause of years lived with disability [13]. Detection and treatment of depression is thus a public health priority.
Structured or semi-structured diagnostic interviews are designed to accurately determine psychiatric diagnoses, but require significant time and resources to conduct. In contrast, self-report assessment tools demand fewer resources to adopt and are easier to administer and score. Brief self-report questionnaires are an efficient way to screen individuals who score above a predetermined cut-off and may be in need of further clinical attention. Also, screening measures may be appropriate to use as an initial stage one in epidemiological studies prior to stage two diagnostic interviews. The high rates of chronicity and disability associated with depression [14] underscore the benefit of early screening and detection. A range of different self-report assessment tools have been used to measure symptoms and severity of depression, including Hospital Anxiety and Depression Scale (HAD) [15], the Beck Depression Inventory (BDI) [16], and the Patient Health Questionnaire-9 (PHQ-9) [17]. A recent systematic review investigated specificity and sensitivity of instruments used to grade severity of depression, and found that out of twenty reviewed instruments, the PHQ-9 was one of only three measures fulfilling the minimum criteria for sensitivity and specificity, with a reported sensitivity of 88% and specificity of 78% for the cut-off score of ≥10 [18]. This cut-off was established by the developers using an independent structured mental health professional interview as the criterion standard [17].
The PHQ-9 consists of nine items that measure depression symptoms and severity [19, 20]. Mixed findings have been reported with regard to factor structure. Whereas some studies have supported the originally established one-factor solution [21], other studies suggest a two-factor solution, with one cognitive/affective- and one somatic factor [22]. A previous Norwegian study of adolescents [23] supported a one-factor structure in a confirmatory factor analysis (CFA), but this has not yet been confirmed among Norwegian adults. As the PHQ-9 is extensively used in both clinical and research settings for psychiatric assessment, proper validation of different versions is important to make sure that the same construct is measured. Despite its widespread use in both clinical and research settings in Norway, only one prior study has investigated the psychometric properties of the PHQ-9 [23]. This study adapted the PHQ-9 to adolescents by shortening the time reference from fourteen to seven days. This underscores the need to confirm the psychometric properties of the Norwegian version of the PHQ-9 among adults to allow for comparisons across international studies. A recent study using PHQ-9 among college women who screened positive for an ED reported moderate depression across different ethnic groups, indicating that comorbid ED and depression can present in various ethnic groups [24]. Including patient samples (e.g., ED) in this effort will aid in determining whether the psychometric properties of the PHQ-9 extend beyond healthy individuals. Considering the high comorbidity between ED and depression, validation of the Norwegian PHQ-9 is needed for both clinical ED samples and controls [9]. Also, many symptoms of depression overlap with those of ED (e.g. weight loss, appetite), and it is therefore important to specifically investigate psychometric properties of the PHQ-9 in currently ill ED samples. In addition to ED psychopathology, depression is associated with emotion regulation difficulties and anxiety [25,26,27]. In their systematic review, Sloan et al. [28] found evidence for emotion regulation as a transdiagnostic treatment construct across various psychopathologies, including anxiety, depression, and eating disorders. Specifically, Fowler et al. [29] reported good construct validity of the DERS based on moderate correlations with depression and anxiety.
We investigated the psychometric properties of the Norwegian version of the PHQ-9 in adults with and without a lifetime ED diagnosis. Specifically, we investigated the internal consistency and convergent validity, attempted to confirm a one-factor structure, and present normative data. Convergent validity was explored by examining correlations with other theoretically related constructs, e.g. anxiety, ED psychopathology, and emotion regulation. We hypothesized that the Norwegian PHQ-9 would exhibit acceptable psychometric properties across ED diagnostic status.
Methods
Design and procedure
This cross-sectional case-control study is part of the Eating Disorders: Genes & Environment (EDGE) project, which investigates genetic and environmental risk factors for the development of ED. All Norwegian residents over the age of 16 years were eligible for participation. Individuals with a lifetime history (current or past) of an ED were invited to participate, as well as individuals without a lifetime history of an ED. Thus, a deliberate effort was made to recruit a diverse sample consisting of individuals with and without ED. There were no additional inclusion/exclusion criteria for our group of individuals with no history of ED. Therefore, controls may have mental health issues not directly assessed in our study. This strategy was intended; we did not want a “super healthy” control group; which runs the risk of maximizing between-group differences and reduce the validity of our findings. However, we note that the control group did score significantly lower across all psychopathologies assessed (ED, depression, anxiety). Participants were recruited through specialized ED treatment units across Norway, user-organizations for ED, online/social media platforms (e.g. websites, Facebook), and flyers and posters at Norwegian universities in the Oslo area. All participants completed an online assessment battery, collected between June 2019 and January 2020. The study was approved by the Regional Ethics Committee in Norway (project id: 2017/1606), and all participants provided informed consent.
Participants
The sample consisted of 793 females aged 18–78 years, with a mean age of 30.39 years (SD 9.83). Mean BMI was 24.14 kg/m2 (SD 6.44). Based on self-report using the ED100K (see description below), a total of 19.7% of the participants had a previous history of the DSM-5 (1) ED diagnoses anorexia nervosa (AN), bulimia nervosa (BN), or binge eating disorder (BED), 36.3% of the participants were classified as having a current ED, and 44% of the participants had no history of ED. Among individuals with a current ED, 31.3% (n = 85) were classified as having AN, and 35.7% (n = 97) were classified as having BN/BED. BN and BED are combined due to difficulties of separating the two diagnoses, mainly due to diagnostic lifetime cross-over. Among individuals with a previous ED, a total of 43.9% (n = 65) of the participants had AN, and 35.8% (n = 53) had BN/BED. Participants were classified as “current ED” if they a) have a lifetime history of DSM-5 AN, BN, or BED on the ED100K; and b) have current ED symptoms (AN: BMI < 18.5 or frequent fasting; BN: episodes of binge eating and compensatory behaviors; BED: binge-eating episodes) on the ED100K; and c) score above the Norwegian EDE-Q cut-off (2.5) [30]; or d) have a lifetime history of ED and report currently receiving treatment for an ED (see description of ED100K and EDE-Q below). Individuals with ED were grouped into two groups; one comprising those with a previous but not current ED, and the other comprising those with a current ED. Groups differed significantly with respect to age and BMI (p > .01), in addition to completed education (Χ2[4] = 14.97, p = .005) and employment status (Χ2[4] = 31.92, p < .001). Follow-up tests revealed that individuals with EDs were more likely to have lower education and to be unemployed (including on sick leave or welfare). These effects were driven by the individuals who were currently ill; while the recovered ED group had similar education and employment status to controls. In addition to these two groups of cases, a third control group consisted of individuals with no lifetime history of ED. Thus the sample was divided into three different groups depending on diagnostic status; current ED, previous ED and no ED. To ease readability, these three groups are sometimes referred to as individuals with and/or without ED. Participant characteristics for cases and controls are shown in Table 1.
Measures
A Norwegian translation and adaptation of the ED100K self-report measure [31] was utilized to assess lifetime history of AN, BN, and BED according to DSM-5 criteria. This measure contains approximately 84 items probing lifetime frequency, duration, and severity of core ED symptoms, including binge-eating, compensatory behaviors, and weight history, as well as age when these features first emerged (i.e. age of onset). Responses are recorded using several formats, designed to clearly capture ED features fulfilling DSM-5 criteria. Due to the retrospective design of this study, and the significant cross-over between the different ED types, a considerable proportion of our sample had a history of several ED diagnoses and subtypes (e.g. AN and BN). Because of this, we did not perform additional analyses according to ED diagnoses or subtypes, as the resulting sample sizes would be too small for our psychometric investigation. The ED100K has previously been validated against the Structured Clinical Interview for DSM-5 (SCID), which has documented good predictive validity [31]. In our study, a total of 74% of individuals classified as having a current ED reported to have received ED treatment. For individuals classified with a previous ED or with no lifetime ED, the number of participants reporting to have received ED treatment was 68.2 and 3.3% respectively. This further supports the validity of the ED100K. Self-reported data on weight and height were used to calculate body mass index (BMI).
The Patient Health Questionnaire-9 (PHQ-9) [17] consists of nine items and assesses depression symptoms the previous fourteen days. Responses are scored on a Likert scale ranging from 0 (not at all) to 3 (nearly every day). A predetermined cut-off of ≥10 is recommended for screening purposes. In addition to a total score, categories are defined to indicate severity of depression symptoms: none (total score ranging from 0 to 4), mild (total score ranging from 5 to 9), moderate (total score ranging from 10 to 14), moderately severe (total score ranging from 15 to 19), and severe (total score ranging from 20 to 27) [17]. The PHQ-9 was adequately translated and adapted to Norwegian through a translation-back-translation approach, in line with recommendations [19].
The Generalized Anxiety Disorder (GAD-7) scale [32], validated in Norwegian [33], was used to assess symptoms of anxiety. The GAD-7 is a self-report measure of anxiety consisting of seven items, and answers range from 0 (not at all) to 3 (nearly every day). Excellent internal consistency was found in the present study for participants with a previous ED (α = .90), current ED (α = .87), and no history of ED (α = .87).
Eating Disorder Examination – Questionnaire (EDE-Q) assessed ED psychopathology. The EDE-Q consists of the four subscales eating restraint, eating concern, shape concern, and weight concern. As the literature provides mixed support for these subscales [34,35,36], the present study reports the overall global score only [34]. Answers are ranged from 0 (least frequent/severe) to 6 (most frequent/severe). Excellent internal consistency was found in the present study for participants with a previous ED (α = .93), current ED (α = .90), and no history of ED (α = .95).
The Difficulties in Emotion Regulation Scale Short Form (DERS-SF) [37] is a widely used self-report measure of emotion regulation deficits. The DERS-SF consists of 13 items, which is summed to produce a total score. Answers range from 1 (almost never) to 5 (almost always). Excellent internal consistency was found in the present study for participants with a previous ED (α = .85), current ED (α = .85), and no history of ED (α = .86).
Statistical analyses
Pearson correlation analyses were carried out to investigate convergent validity; i.e., to assess whether the PHQ-9 total score correlated with other constructs hypothesized to be associated with depression, such as symptoms of anxiety (GAD-7 score) and ED (EDE-Q global score). In line with Cohen [38], correlations of .10 to .29 were interpreted as small, .30 to .49 as medium and .50 to 1.0 as large. Furthermore, due to violating the ANOVA assumptions of equal variance, a non-parametric Kruskal-Wallis H test was conducted to compare PHQ-9 scores across levels of ED groups (current/previous ED cases versus comparisons). Interquartile range (IQR) was calculated for the three groups. Mann-Whitney U tests were performed for post-hoc analyses, with alpha level .017 subsequent to Bonferroni correction (.05/3) for multiple comparisons. Effect sizes (r) were calculated and classified using Cohen’s classification, with .01 as small effect, .06 as a medium effect, and .14 as a large effect. Cronbach’s alpha was calculated to indicate internal consistency for the PHQ-9 scale, and confirmatory factor analysis (CFA) was used to seek confirmation of the original one-factor solution as reported by Kroenke et al. [17], and confirmed among Norwegian adolescents [23].
We used maximum likelihood estimation in the CFA. The current analytic approach was undertaken in two phases. First, a CFA-model was fitted to the data. The second phase involved the use of multiple indicators, multiple causes (MIMIC) modeling to investigate whether the latent factor mediates the effect of the observed severity group on the latent construct of the PHQ-9 in those with and without eating disorder and to investigate differential item functioning (DIF). DIF occurs when an item on a test or questionnaire has different measurement properties for one group of people versus another, irrespective of group-mean differences on the variable under study. We tested for differential item functioning, by comparing the fit of the model using log-likelihood tests, in different conditions [39].
In a MIMIC-approach, a direct path to the latent construct indicates the effects of the group contrast. Following a similar procedure as in previous work [33], multiple indices were used to evaluate the models. Different indices provide different information (i.e., absolute fit, fit adjusting for model parsimony, fit relative to a null model), and more indices give a more conservative and reliable evaluation of the model fit [40]. The chi-square distribution for goodness of fit evaluates the difference between the observed data and model prediction. For the comparative fit index [CFI [41];] and the Tucker-Lewis Index [TLI [42];], a value of 0.95 suggests acceptable fit. For root mean square error of approximation [RMSEA [43];], values in the range of 0.00 to 0.05 indicate close fit, those between 0.05 and 0.08 indicate fair fit, and those between 0.08 and 0.10 indicate mediocre fit. RMSEA values above 0.10 indicate poor fit. Standardized root mean square residual (SRMR) is an absolute measure of fit and is defined as the standardized difference between the observed correlation and the predicted correlation. A value below 0.08 is generally considered a good fit [41].
The CFA was conducted using mplus version 8, whereas IBM SPSS statistics version 25 was used for the remaining analyses.
Results
Normative data
Mean PHQ-9 total scores were calculated for the three diagnostic groups, resulting in a mean score of 10.67 (SD 6.33) for those with a previous history of ED, 16.61 (SD 5.84) for those with a current ED, and 6.83 (SD 5.58) for those with no lifetime history of ED. Proportion of participants falling within the different severity categories (none, mild, moderate, moderately severe, and severe) are illustrated in Table 2. Briefly, 12.7% of participants with no lifetime history of ED fell within the two most severe categories (total PHQ-9 score of 15 or above; moderately severe and severe depression symptoms). For participants with a previous or current ED, these rates were 29 and 63.9%, respectively. A total of 52.8% of the total sample scored above the PHQ-9 cut-off score of ≥10. When analyzing separately according to diagnostic status, 53.4% of individuals with a previous ED scored above the cut-off, 86.4% among individuals with a current ED, and 26.1% of participants with no lifetime history of ED scored above the cut-off score. Item-level mean scores are presented in Table 3.
A Kruskal-Wallis H test revealed a statistically significant difference in PHQ-9 scores between the groups, Χ2(2) = 274.27, p < .001 (Table 4), with a mean rank PHQ-9 score of 244.8 for individuals with no lifetime history of ED (IQR = 3–10), 368.0 for individuals with previous ED (IQR = 5–15), and 538.21 for individuals with a current ED (IQR = 12–21). Mann-Whitney U tests were performed for post-hoc analyses, and statistically significant differences in PHQ-9 total scores were revealed in all pairwise comparisons (see Table 4 for details).
Internal consistency of the PHQ-9
Excellent internal consistency was indicated by Cronbach’s alphas for the total sample (.92), for individuals with a previous ED (.88), for individuals with a current ED (.86), and for individuals with no history of ED (.88).
Convergent validity
Convergent validity was indicated by positive significant correlations with the GAD-7, EDE-Q, and DERS-SF total scores; constructs expected to be associated with depression. Correlation analyses showed that the PHQ-9 and GAD-7 were significantly associated in the total sample (.81, p < .001). Moreover, the PHQ-9 was correlated with the EDE-Q global score (.71, p < .001) and the DERS-SF total score (.76, p < .001). When separated by diagnostic group, the PHQ-9 score was associated with GAD-7 (.79, p < .001), EDE-Q (.38, p < .001), and DERS-SF (.63, p < .001) among participants with a previous ED. For participants with a current ED, PHQ-9 was associated with GAD-7 (.64), EDE-Q (.61), and DERS-SF (.64), all p’s < .001. Finally, the corresponding correlations for individuals with no lifetime history of ED were .81 (p < .001), .53 (p < .001), and .70 (p < .001). Correlations between these constructs, in addition to age, and BMI, are illustrated in Table 5, separated by groups.
Factor structure
The one-factor model of PHQ-9 provided a poor fit for the sample (χ2 28[N = 762]. 302.85; p = 0.00; CFI = .93; TLI = .91; RMSEA = 0.113; [0.102–0.125]; SRMR = 0.089. Thus, the one-factor solution was not confirmed. However, when evaluating the modification indices, evidence of correlated residuals for items 1 and 2 where found, similar to other studies [44]. Thus, the CFA was specified again by freely estimating the error covariances of these item one and item two (see Fig. 1). The revised model gave a better model fit; however, the fit indices were still mediocre (χ2 27[N = 762]. 211.188; p = 0.00; CFI = .95; TLI = .94; RMSEA = 0.095; [0.08–0.11]; SRMR = 0.107. Since the fit was mediocre, a two-factor solution proposed in the literature with cognitive and somatic symptoms was investigated [45]. The two-factor solutions gave somewhat better model-fit (χ2 27[N = 762]. 170.654; p = 0.00; CFI = .96; TLI = .95; RMSEA = 0.084; [0.07–0.10]; SRMR = 0.130), but the factors were highly correlated (r = 0.93) as previously reported [44], thus we proceeded with the one-factor solution.
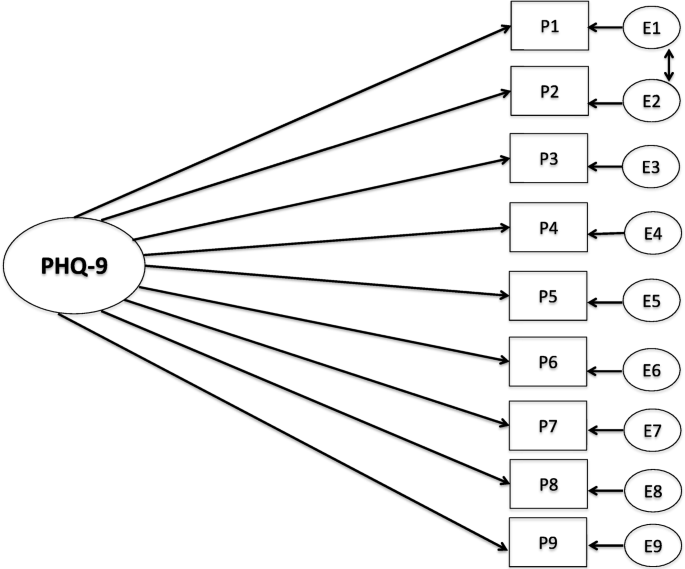
Confirmatory factor analysis of the PHQ-9. P1 = Lack of interest, P2 = Depressed, P3 = Sleep, P4 = Energy, P5 = Appetite, P6 = Feeling bad, P7 = Concentrating, P8 = Speaking slowly/restless, P9 = Suicidal thoughts. E = residuals
The response indicators defining the one-factor model reported in Fig. 1 were inserted in the entire MIMIC model. The contrast variable represented those with and without ED and was regressed on the latent construct (PHQ-9). The MIMIC model indicated a worse fit than the respecified one-factor CFA-model: (χ2 35[N = 762]. 316.219; p = 0.00; CFI = .93; TLI = .92; RMSEA = 0.103; [0.09–0.11]; SRMR = 0.150). Thus, including a covariate in the measurement model, indicating ED or not, did not improve the model fit. Our MIMIC model confirms that patients without ED were more likely to have lower scores on the PHQ-9 (− 1.02, p = < 0.001) than patients with a history of or current ED. Every item was tested for uniform DIF with all other items presumed DIF-free. This was accomplished by regressing one item at a time on the grouping variable. A full model (every items DIF-free) was compared to a more constrained model using log-likelihood tests, where one of the items were regressed to the grouping variable. The results indicated that the items were invariant in those with and without ED.
Discussion
The overarching aim of this study was to investigate the psychometric properties of the Norwegian version of the PHQ-9 in a female adult sample with and without a lifetime history of ED. The results suggest that the psychometric properties are generally good, with excellent internal consistency and good convergent validity across diagnostic status. CFA revealed that a one-factor model of the PHQ-9 was the solution with the best fit to the data, though the fit was mediocre. No evidence of DIF was found based between those with and without ED. The results indicate that level of depression measured with PHQ-9 can be compared between such groups.
Psychometric properties
The internal consistency of the Norwegian version of the PHQ-9 was excellent among adult females, with Cronbach’s alphas between .86–.92 for the different ED groups. This is similar to results from the previous Norwegian adolescent study (Cronbach’s alpha of .86 for the total sample and .88 for girls only) [23], as well as other studies among adult (male and female) samples [17, 45], all reporting Cronbach’s alphas between .79 and .89. Thus, reported internal consistency was similar across gender in these studies. However, it should be noted that this does not necessarily mean that the results in the current study can be generalized to males. Furthermore, the PHQ mean score in our study was positively and strongly associated with ED psychopathology, emotion regulation difficulties, and anxiety. These are constructs theoretically related to depression, thereby indicating convergent validity [25, 26, 28]. While scores on PHQ-9 showed moderate to large correlations with scores on ED psychopathology and emotion regulation, associations between scores on depression and anxiety were large. Although the meaningfulness of separating the constructs of anxiety and depression can be debated, here it supports satisfactory convergent validity of the Norwegian translation of the PHQ-9.
A one-factor model of the PHQ-9 was the solution with the best fit to the data, even though the fit was mediocre. The one-factor model exhibit strong factor loading (0.63–0.86) and high internal consistency (.86–89). This contrasts with some aspects of the existing literature [21], including a Norwegian study of adolescents [23], yet other studies have reported a two-factor structure [22], including a somatic and a cognitive/affective factor. These contradictory factor structure findings may reflect sample differences, although analyses of measurement invariance indicate that PHQ-9 is a reliable and valid measure across demographic groups [21, 44]. Furthermore, it has been argued that since the factors in the two-factor structure are highly correlated (.86), it is of limited value to distinguish them [44]. Additionally, the PHQ-9 is a brief, nine-item measure designed to effectively screen for depression, which could suggest that using the total score of the PHQ-9 to indicate depression severity may be beneficial when using the measure clinically and in research.
Normative data
Normative data were also presented, demonstrating higher PHQ-9 mean scores in the ED groups compared to those with no lifetime ED. Though elevated scores may be expected among individuals with a previous ED, it is worth noting that the PHQ-9 mean score of the individuals with no ED history in our study is considerably higher than that reported among representative nationwide population-based samples from other studies, such as Germany [46], the USA [22], and South Korea [45]. Mean scores for males and females in these studies typically range from 2.5 to 4.5, though females tend to score somewhat higher than males. There were no exclusion criteria for our group of individuals with no history of ED with the exception of lifetime history of ED. It is therefore possible that individuals in this group have other mental health problems. Supporting this, 18.6% of the individuals in the comparison group reported currently receiving mental health treatment, although this does not necessarily signal the presence of a psychiatric disorder. This could indicate that our sample of people with no ED history is not as healthy as those in larger population studies that strive for super healthy controls. Notably, the Norwegian adolescent study reported similar norms to the current Norwegian adult study, with a mean score of 6.89 (SD 5.13) in adolescent females [23]. It can therefore not be ruled out that differences in normative data across studies reflect cultural differences in symptomatology or reporting; however, this cannot be concluded based on our data.
Other studies of clinical samples of individuals with ED have reported PHQ-9 mean scores falling in the same range as the past- and current ED groups in the present study [47, 48]. For example, Hayes et al. [47] reported normative data in study of adolescents and adults (93% females) with ED receiving treatment with a partial hospitalization and intensive outpatient program. Baseline PHQ-9 mean score was 12.79 (SD 6.91), dropping to 8.12 (SD 6.91) post treatment. Furthermore, Rose et al. [48] reported PHQ-9 mean scores in adults (44 females and 3 males) with ED in primary care pre and post CBT for ED (mean number of sessions 17). Baseline mean was 13.5 (SD 5.48), post treatment was 7.42 (SD 6.38). Based on these studies, it may seem like baseline PHQ-9 mean scores of ED clinical samples resemble those of the two clinical groups in the present study (mean scores 10 in the previous ED group and 16 in the current ED group), whereas post-treatment scores in the clinical studies fall closer to the group with no lifetime ED in the present study. These studies consisted of predominantly female samples, but Hayes et al. reported that gender was not a significantly moderator for any of the outcome measures.
Furthermore, with regard to prevalence, a total of 53.4% with a previous ED, and 86.4% of individuals with a current ED, scored above the PHQ-9 depression screening cut-off score of 10 in the present study. As expected, the proportion of individuals with no lifetime ED history scoring above cut-off, was considerably lower at 26.1%. However, these scores are still noticeably higher than the German population data [46], reporting that 5.6% of all participants scored above the cut-off of 10. As noted above, it cannot be determined whether these differences relate to cultural-, selection-, or other factors. Whereas the national German population study had a representative registered-based sample, our study mainly utilized online recruitment. Such various recruitment approaches may affect the samples attained, thereby potentially bias the results. It is a possible that cut-off thresholds may need to be culturally adapted. To achieve this, two-stage studies are needed.
Our findings suggest the Norwegian version of the PHQ-9 is a reliable and valid measure that can be used to assess depression symptoms among female individuals with ED. This is important as depression symptoms often co-occur with ED, and monitoring such symptoms may be of importance to assess treatment response. Moreover, our normative data showed that depression scores were elevated among recovered individuals who have a history of an ED. This has implications for the interpretation of PHQ-9 scores among such individuals. Because symptoms of depression overlap with those of ED (e.g. weight loss, appetite), future studies should evaluate whether the traditional PHQ-9 cut-off thresholds are equally valid for ED populations.
Although this study is strengthened by a large sample with and without ED, it is limited by the use of self-report data to ascertain lifetime ED diagnoses. Also, we cannot rule out that our online recruitment procedure may have affected the results. Differences across the different ED diagnoses were not addressed. Though the psychometric properties of the Norwegian translation of the PHQ-9 are found to be good among females, diagnostic interviews are required to determine diagnoses. Also, males are not included in the study. This limits the generalizability across genders and confidence in gender-specific norms. Finally, another measure of depression was not included, which would have strengthened evidence in favor of the construct validity of the PHQ-9.
Conclusions
The results indicate that the Norwegian version of the PHQ-9 is psychometrically sound among females across different ED diagnostic group status and females with no lifetime ED. This suggests that PHQ-9 can be used in ED clinical settings as well as in the general Norwegian population to assess depression symptoms and severity [14].
Availability of data and materials
The datasets used and/or analyzed during the current study are available from the corresponding author on reasonable request.
Abbreviations
- PHQ:
-
Patient health questionnaire
- EDE-Q:
-
Eating disorder examination questionnaire
- GAD:
-
Generalized anxiety disorder
- DERS-SF:
-
Difficulties in emotion regulation scale short form
- ED:
-
Eating disorders
- CFA:
-
Confirmatory factor analysis
- EDGE:
-
Eating disorders genetic and environment
- DSM:
-
Diagnostic and statistical manual for mental disorders
- AN:
-
Anorexia nervosa
- BN:
-
Bulimia nervosa
- BED:
-
Binge eating disorder
- BMI:
-
Body mass index
- IQR:
-
Interquartile range
- ANOVA:
-
Analyses of variance
- SD:
-
Standard deviation
References
American Psychiatric Association. The Diagnostic and Statistical Manual of Mental Disorders: DSM-5. 5th Edition ed. Washington DC: American Psychiatric Association; 2013.
Visted E, Vøllestad J, Nielsen MB, Schanche E. Emotion regulation in current and remitted depression: a systematic review and meta-analysis. Front Psychol. 2018;9:756.
Neuendorf R, Harding A, Stello N, Hanes D, Wahbeh H. Depression and anxiety in patients with inflammatory bowel disease: a systematic review. J Psychosom Res. 2016;87:70–80.
Wisting L, Skrivarhaug T, Dahl-Jørgensen K, Rø Ø. Prevalence of disturbed eating behavior and associated symptoms of anxiety and depression among adult males and females with type 1 diabetes. J Eat Disord. 2018;6(1):28.
Cohen BE, Edmondson D, Kronish IM. State of the art review: depression, stress, anxiety, and cardiovascular disease. Am J Hypertens. 2015;28(11):1295–302.
Koo J, Marangell LB, Nakamura M, Armstrong A, Jeon C, Bhutani T, et al. Depression and suicidality in psoriasis: review of the literature including the cytokine theory of depression. J Eur Acad Dermatol Venereol. 2017;31(12):1999–2009.
Groenman AP, Janssen TWP, Oosterlaan J. Childhood psychiatric disorders as risk factor for subsequent substance abuse: a meta-analysis. J Am Acad Child Adolesc Psychiatry. 2017;56(7):556–69.
Johnson D, Dupuis G, Piche J, Clayborne Z, Colman I. Adult mental health outcomes of adolescent depression: a systematic review. Depress Anxiety. 2018;35(8):700–16.
Puccio F, Fuller-Tyszkiewicz M, Ong D, Krug I. A systematic review and meta-analysis on the longitudinal relationship between eating pathology and depression. Int J Eat Disord. 2016;49(5):439–54.
Levis B, Yan XW, He C, Sun Y, Benedetti A, Thombs BD. Comparison of depression prevalence estimates in meta-analyses based on screening tools and rating scales versus diagnostic interviews: a meta-research review. BMC Med. 2019;17(1):65.
Godart N, Radon L, Curt F, Duclos J, Perdereau F, Lang F, et al. Mood disorders in eating disorder patients: prevalence and chronology of ONSET. J Affect Disord. 2015;185:115–22.
Godart NT, Perdereau F, Rein Z, Berthoz S, Wallier J, Jeammet P, et al. Comorbidity studies of eating disorders and mood disorders. Critical review of the literature. J Affect Disord. 2007;97(1–3):37–49.
Ferrari AJ, Charlson FJ, Norman RE, Patten SB, Freedman G, Murray CJ, et al. Burden of depressive disorders by country, sex, age, and year: findings from the global burden of disease study 2010. PLoS Med. 2013;10(11).
Friedrich MJ. Depression is the leading cause of disability around the world. Jama. 2017;317(15):1517.
Zigmond AS, Snaith RP. The hospital anxiety and depression scale. Acta Psychiatr Scand. 1983;67(6):361–70.
Beck AT, Ward CH, Mendelson M, Mock J, Erbaugh J. An inventory for measuring depression. ArchGenPsychiatry. 1961;4:561–71.
Kroenke K, Spitzer RL, Williams JB. The PHQ-9: validity of a brief depression severity measure. J Gen Intern Med. 2001;16(9):606–13.
Pettersson A, Bostrom KB, Gustavsson P, Ekselius L. Which instruments to support diagnosis of depression have sufficient accuracy? A systematic review. Nordic J Psychiatry. 2015;69(7):497–508.
Spitzer RL, Kroenke K, Williams JB. Validation and utility of a self-report version of PRIME-MD: the PHQ primary care study. Primary care evaluation of mental disorders. Patient health questionnaire. Jama. 1999;282(18):1737–44.
Spitzer RL, Williams JB, Kroenke K, Hornyak R, McMurray J. Validity and utility of the PRIME-MD patient health questionnaire in assessment of 3000 obstetric-gynecologic patients: the PRIME-MD patient health questionnaire obstetrics-gynecology study. Am J Obstet Gynecol. 2000;183(3):759–69.
Keum BT, Miller MJ, Inkelas KK. Testing the factor structure and measurement invariance of the PHQ-9 across racially diverse U.S. college students. Psychol Assess. 2018;30(8):1096–106.
Patel JS, Oh Y, Rand KL, Wu W, Cyders MA, Kroenke K, et al. Measurement invariance of the patient health questionnaire-9 (PHQ-9) depression screener in U.S. adults across sex, race/ethnicity, and education level: NHANES 2005-2016. Depress Anxiety. 2019;36(9):813–23.
Burdzovic Andreas J, Brunborg GS. Depressive symptomatology among Norwegian adolescent boys and girls: the patient health Questionnaire-9 (PHQ-9) psychometric properties and correlates. Front Psychol. 2017;8:887.
Ferrari AJ, Charlson FJ, Norman RE, Patten SB, Freedman G, Murray CJ, Whiteford HA. Burden of depressive disorders by country, sex, age, and year: findings from the global burden of disease study 2010. PLoS Med. 2013;10(11):e1001547.
Dryman MT, Heimberg RG. Emotion regulation in social anxiety and depression: a systematic review of expressive suppression and cognitive reappraisal. Clin Psychol Rev. 2018;65:17–42.
Mallorquí-Bagué N, Vintró-Alcaraz C, Sánchez I, Riesco N, Agüera Z, Granero R, et al. Emotion regulation as a transdiagnostic feature among eating disorders: cross-sectional and longitudinal approach. Eur Eat Disord Rev. 2018;26(1):53–61.
Prefit AB, Cândea DM, Szentagotai-Tătar A. Emotion regulation across eating pathology: a meta-analysis. Appetite. 2019;143:104438.
Sloan E, Hall K, Moulding R, Bryce S, Mildred H, Staiger PK. Emotion regulation as a transdiagnostic treatment construct across anxiety, depression, substance, eating and borderline personality disorders: a systematic review. Clin Psychol Rev. 2017;57:141–63.
Fowler JC, Charak R, Elhai JD, Allen JG, Frueh BC, Oldham JM. Construct validity and factor structure of the difficulties in emotion regulation scale among adults with severe mental illness. J Psychiatr Res. 2014;58:175–80.
Rø Ø, Reas DL, Stedal K. Eating disorder examination questionnaire (EDE-Q) in Norwegian adults: discrimination between female controls and eating disorder patients. Eur Eat Disord Rev. 2015;23(5):408–12.
Thornton LM, Munn-Chernoff MA, Baker JH, Juréus A, Parker R, Henders AK, et al. The anorexia nervosa genetics initiative (ANGI): overview and methods. Contemporary Clin Trials. 2018;74:61–9.
Spitzer RL, Kroenke K, Williams JB, Löwe B. A brief measure for assessing generalized anxiety disorder: the GAD-7. Arch Intern Med. 2006;166(10):1092–7.
Johnson SU, Ulvenes PG, Øktedalen T, Hoffart A. Psychometric properties of the general anxiety disorder 7-item (GAD-7) scale in a heterogeneous psychiatric sample. Front Psychol. 2019;10:1713.
Byrne SM, Allen KL, Lampard AM, Dove ER, Fursland A. The factor structure of the eating disorder examination in clinical and community samples. Int J Eat Disord. 2010;43(3):260–5.
Grilo CM, Reas DL, Hopwood CJ, Crosby RD. Factor structure and construct validity of the eating disorder examination-questionnaire in college students: further support for a modified brief version. Int J Eat Disorders. 2015;48(3):284–9.
White HJ, Haycraft E, Goodwin H, Meyer C. Eating disorder examination questionnaire: factor structure for adolescent girls and boys. Int J Eat Disord. 2014;47(1):99–104.
Kaufman EA, Xia M, Fosco G, Yaptangco M, Skidmore CR, Crowell SE. The difficulties in emotion regulation scale short form (DERS-SF): validation and replication in adolescent and adult samples. J Psychopathol Behav Assess. 2016;38(3):443–55.
Cohen J. Statistical Power Analysis for the Behavioural Sciences. 2 ed. Hillsdale,NJ:1988; 1988.
Woods CM, Oltmanns TF, Turkheimer E. Illustration of MIMIC-model DIF testing with the schedule for nonadaptive and adaptive personality. J Psychopathol Behav Assess. 2009;31(4):320.
Brown TA. Confirmatory factor analysis for applied research: Guilford publications; 2015.
Hu L, Bentler PM. Cutoff criteria for fit indexes in covariance structure analysis: conventional criteria versus new alternatives. Struct Equ Model Multidiscip J. 1999;6(1):1–55.
Schumacker RE, Lomax RG. A beginner's guide to structural equation modeling: psychology press; 2004.
Browne MW, Cudeck R. Alternative ways of assessing model fit. In: Bollen KA, Long JS, editors. Testing structural equation models. Beverly Hills: Sage; 1993. p. 136–62.
González-Blanch C, Medrano LA, Muñoz-Navarro R, Ruíz-Rodríguez P, Moriana JA, Limonero JT, et al. Factor structure and measurement invariance across various demographic groups and over time for the PHQ-9 in primary care patients in Spain. PLoS One. 2018;13(2):e0193356.
Shin C, Ko YH, An H, Yoon HK, Han C. Normative data and psychometric properties of the patient health Questionnaire-9 in a nationally representative Korean population. BMC Psychiatry. 2020;20(1):194.
Kocalevent RD, Hinz A, Brahler E. Standardization of the depression screener patient health questionnaire (PHQ-9) in the general population. Gen Hosp Psychiatry. 2013;35(5):551–5.
Hayes NA, Welty LJ, Slesinger N, Washburn JJ. Moderators of treatment outcomes in a partial hospitalization and intensive outpatient program for eating disorders. Eat Disord. 2019;27(3):305–20.
Rose C, Waller G. Cognitive-behavioral therapy for eating disorders in primary care settings: does it work, and does a greater dose make it more effective? Int J Eat Disord. 2017;50(12):1350–5.
Acknowledgements
The authors would like to thank all the participants for their willingness to contribute to this study, and to the Norwegian user organizations ROS/SPISFO for their support and assistance.
Funding
This study (via Dr. Bang) is funded by the South-Eastern Norway Health Authority (#2017083). Dr. Bulik acknowledges funding from the Swedish Research Council (Vetenskapsrådet, award: 538–2013-8864). None of the funding bodies have had any role in the design, data collection, data analysis, interpretation of data or writing of the manuscript.
Author information
Authors and Affiliations
Contributions
LW contributed to the data collection, analyzed the data, and prepared the manuscript. SUJ led the translation of the PHQ-9 to Norwegian, analyzed data, and contributed to the manuscript. CMB contributed to the conception and planning of the study, and contributed to the manuscript. OAA contributed to the conception and planning of the study, contributed to the EDGE data collection, and to the manuscript. ØR contributed to the conception and planning of the study, and to the manuscript. LB is the primary investigator of the study, was responsible for the conception and planning of the study, received grants, conducted the data collection and data preparation, and contributed to the manuscript. All authors read and approved the final manuscript.
Corresponding author
Ethics declarations
Ethics approval and consent to participate
The study was approved by the Regional Ethics Committee in Norway (project id: 2017/1606). All participants signed informed consent to participate.
Consent for publication
Not applicable.
Competing interests
CM Bulik reports: Shire (grant recipient, Scientific Advisory Board member); Idorsia (consultant); Pearson (author, royalty recipient). The remaining authors report no conflict of interest.
Additional information
Publisher’s Note
Springer Nature remains neutral with regard to jurisdictional claims in published maps and institutional affiliations.
Supplementary Information
Rights and permissions
Open Access This article is licensed under a Creative Commons Attribution 4.0 International License, which permits use, sharing, adaptation, distribution and reproduction in any medium or format, as long as you give appropriate credit to the original author(s) and the source, provide a link to the Creative Commons licence, and indicate if changes were made. The images or other third party material in this article are included in the article's Creative Commons licence, unless indicated otherwise in a credit line to the material. If material is not included in the article's Creative Commons licence and your intended use is not permitted by statutory regulation or exceeds the permitted use, you will need to obtain permission directly from the copyright holder. To view a copy of this licence, visit http://creativecommons.org/licenses/by/4.0/. The Creative Commons Public Domain Dedication waiver (http://creativecommons.org/publicdomain/zero/1.0/) applies to the data made available in this article, unless otherwise stated in a credit line to the data.
About this article

Cite this article
Wisting, L., Johnson, S.U., Bulik, C.M. et al. Psychometric properties of the Norwegian version of the Patient Health Questionnaire-9 (PHQ-9) in a large female sample of adults with and without eating disorders. BMC Psychiatry 21, 6 (2021). https://doi.org/10.1186/s12888-020-03013-0
Received:
Accepted:
Published:
DOI: https://doi.org/10.1186/s12888-020-03013-0