
Abstract
Background
To develop and validate a peritumoral vascular and intratumoral radiomics model to improve pretreatment predictions for pathologic complete responses (pCRs) to neoadjuvant chemoradiotherapy (NAC) in patients with triple-negative breast cancer (TNBC).
Methods
A total of 282 TNBC patients (93 in the primary cohort, 113 in the validation cohort, and 76 in The Cancer Imaging Archive [TCIA] cohort) were retrospectively included. The peritumoral vasculature on the maximum intensity projection (MIP) from pretreatment DCE-MRI was segmented by a Hessian matrix-based filter and then edited by a radiologist. Radiomics features were extracted from the tumor and peritumoral vasculature of the MIP images. The LASSO method was used for feature selection, and the k-nearest neighbor (k-NN) classifier was trained and validated to build a predictive model. The diagnostic performance was assessed using the ROC analysis.
Results
One hundred of the 282 patient (35.5%) with TNBC achieved pCRs after NAC. In predicting pCRs, the combined peritumoral vascular and intratumoral model (fusion model) yields a maximum AUC of 0.82 (95% confidence interval [CI]: 0.75, 0.88) in the primary cohort, a maximum AUC of 0.67 (95% CI: 0.57, 0.76) in the internal validation cohort, and a maximum AUC of 0.65 (95% CI: 0.52, 0.78) in TCIA cohort. The fusion model showed improved performance over the intratumoral model and the peritumoral vascular model, but not significantly (p > 0.05).
Conclusion
This study suggested that combined peritumoral vascular and intratumoral radiomics model could provide a non-invasive tool to enable prediction of pCR in TNBC patients treated with NAC.
Find the latest articles, discoveries, and news in related topics.Introduction
Triple-negative breast cancer (TNBC) is characterized by the lack of the estrogen receptor (ER), progesterone receptor (PR), and human epidermal growth factor receptor 2 (HER2). TNBC, which accounts for 12–15% of all mammary tumors, has a worse outcome compared with other breast cancer subtypes [1]. Currently, neoadjuvant chemotherapy (NAC) is the standard method used to prevent systemic relapse in TNBC patients with locally advanced disease. A pathologic complete response (pCR) to NAC is considered a surrogate marker for improved disease-free survival and overall survival [2]. Although TNBC is the most chemotherapy-responsive tumor of all breast cancer subtypes, there is a high risk of recurrence and high rates of visceral and central nervous metastases in TNBC patients not achieving pCR [3]. To avoid the toxicity of ineffective treatments, it is essential to stratify patients into appropriate treatment groups before the early treatment stages.
Dynamic contrast-enhanced magnetic resonance imaging (DCE-MRI), which depicts and characterizes morphologic and kinetic profiles of tumors and the disorganized, leaky vasculature, is the preferred imaging modality in the NAC setting [4]. Furthermore, radiomics analysis involving computer-based extraction of a large number of quantitative features from DCE-MRI has been shown to improve pCR prediction [5]. Most previous radiomics studies have focused on extracting features from tumor [6,7,8]. Mazurowski et al. [9] and Wang et al. [10] that evaluated features extracted from tumor-associated background parenchyma enhancement (BPE) in the context of NAC for breast cancer showed an association between this peritumoral radiomics and pCR. In addition, one published study showed that the radiomic descriptor of intratumoral and peritumoral regions on pretreatment DCE-MRI were associated with treatment responses in breast cancer [11]. These evidences indicate that valuable outcome-related information can be found outside of the tumor tissue. Angiogenesis, the biological process in which new blood vessels grow from pre-existing vasculature to provide oxygen and nutrients to tumors, plays a pivotal role in tumor responses to chemotherapy [12]. The exceptionally variable vasculature (in size, shape, and architecture) generates heterogeneous blood flow and limited perfusion throughout the tumor and is essential for cancer proliferation and likely, treatment responses. Therefore, peritumoral vascular and intratumoral features may potentially predict pCR in breast cancer.
In the present study, we aimed to develop and validate a peritumoral vascular and intratumoral radiomics model from pretreatment DCE-MRI to predict pCR in patients with TNBC undergoing surgery after NAC.
Materials and methods
Patients
The retrospective study was approved by the institutional review board of Fudan University Shanghai Cancer Center, and the need to obtain informed consent was waived. In this multicohort study, radiomics analysis was applied to three independent cohorts. A total of 328 women patients diagnosed with breast cancer histologically and TNBC immunohistochemically, and who received complete NAC with no prior treatments, underwent breast MRI before the start of NAC, and underwent surgery after NAC, were included in this study. The exclusion criteria included the following: (a) patients with a prior history of malignance (n = 8), (b) patients without pretreatment MRI or post-operative pathology (n = 23), (c) patients with poor qualities or motion artifacts on DCE-MRI (n = 4), (d) patients with marked BPE on DCE-MRI (n = 10), (e) and patients without obvious peritumoral vessel on DCE-MRI (n = 1) (Fig. 1). Finally, the dataset from our center between February 1, 2016 and May 31, 2019 was used as the primary cohort and consisted of 93 patients (mean age, 49 years; range 26–75 years). The dataset from our center between June 1, 2019 and February 26, 2021 was used as the internal validation cohort and consisted of 113 patients (mean age, 47 years; range 25–72 years). The other dataset from “Duke-Breast-Cancer-MRI” of The Cancer Imaging Archive (TCIA) [13] was used as the external validation cohort and consisted of 76 patients (mean age, 49 years; range 24–73 years).
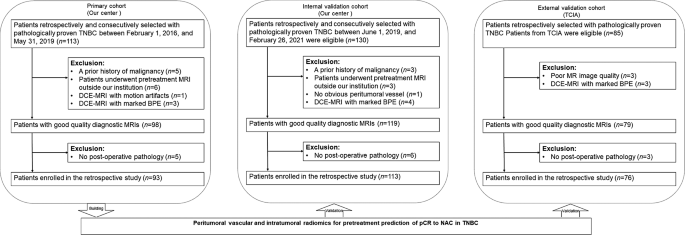
Flowchart of the study population
In the primary and internal validation cohorts, ER, PR, HER2, Ki-67 index expression patterns, and axillary lymph node metastatic assessments were obtained from histopathologic reports of core biopsies performed before NAC administration. The immunohistochemical assessment of ER, PR, and HER2 was performed using the standard methods as previously reported [14]. In those tumors that were classified as 2+, HER2 genetic testing was confirmed by fluorescence in situ hybridization.
Neoadjuvant chemotherapy regimen and response assessment
In the primary and internal validation cohorts, the chemotherapy regimens included epirubicin/cyclophosphamide followed by docetaxel (EC followed by T), docetaxel/carboplatin (TCb), and EC. The median number of NAC cycles was six (range, 4–8). The mean interval between the end of NAC and surgery was 10 days (range, 3–27 days). There were no details of NAC regimens in TCIA cohort. pCR was determined by microscopic examination of the excised tumor and lymph nodes after the completion of NAC and defined as no invasive or noninvasive residual in breast or axillary nodes (ypT0 ypN0) [15].
MRI protocols
The detailed parameters of DCE-MRI acquisition of all cohorts can be found in Appendix E1 in the Supplementary Material. In the primary and internal validation cohorts, all breast MR examinations were performed within 14 days before the start of NAC. DCE-MRI was performed using a fat-suppressed T1-weighted 3D fast spoiled gradient-echo sequence before and five times continuously. The first postcontrast phase was performed twenty seconds after a bolus injection of a gadolinium contrast agent (Magnevist, Bayer HealthCare Pharmaceuticals Inc.). The injections were performed with an automatic injector (OptiStar® Elite, Liebel-Flarsheim) at a dose of 0.1 mmol per kilogram of body weight and rate of 2 ml/sec, followed by a 20 mL saline flush. The subtraction and axial MIP images were generated automatically after acquisition.
In TCIA dataset, the contrast agents included Gadavist, Magnevist, and Multihanc with the volume of 10–20 ml. The subtraction and axial MIP images were manually calculated by the radiologist (TX, 5 years of experience).
Tumor segmentation and peritumoral vessel segmentation
All MR images were reviewed by two breast radiologists (TX, 5 years of experience; and QZ, 11 years of experience), who were blinded to the results of the treatment outcomes. For patients with multifocal or multicentric tumors, the tumors with the largest size and the ipsilateral vessel were segmented and analyzed on the basis of the axial MIP of the first postcontrast phase.
Tumor segmentation on the MIP image was conducted manually by the breast radiologist (TX, 5 years of experience). The region of interest (ROI) was delineated to include the entire tumor by using a free open-source software package (ITK-SNAP, version 3.8.0; http://itk-snap.org). If there was overlap between the index tumor and the peritumoral vessel in the axial MIP image, the intersection was removed using the eraser tool. The illustration for tumor segmentation can be found in Appendix E2 in the Supplementary Material.
The enhancement and segmentation of peritumoral vessel were performed by the eigenvalue analysis of the multiscale Hessian-based filter, which showed simultaneous noise and background suppression and vessel enhancement in MIP images [16]. The details of the multiscale Hessian-based filter method and peritumoral vessel segmentation by algorithm can be found in Appendix E3 and E4 in the Supplementary Material. The segmentation of peritumoral vessel were performed with the Python programming language (Scikit-image package, v. 3.6, Python Software Foundation, https://www.python.org/). Then, the peritumoral vasculature by algorithm segmentation was loaded to ITK-SNAP again, and a senior breast radiologist (QZ, 11 years of experience) performed manual editing by painting missing voxels and erasing incorrect voxels to get the final peritumoral vasculature. The manual vessel editing procedure took approximately 4 min per case. The flowchart and illustration for the vessel segmentation procedures are shown in Figs. 2 and 3.
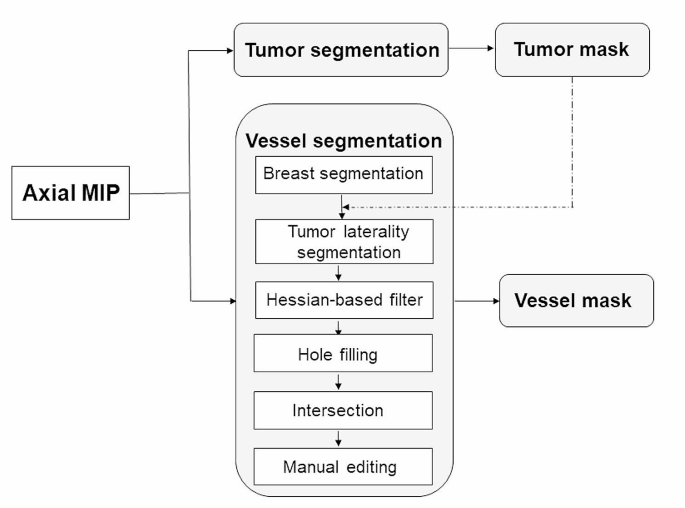
Flowchart of the tumor and peritumoral vessel segmentation procedure. Tumor and peritumoral vessel segmentations were performed on the axial maximum intensity projection (MIP) of the first postcontrast phase. After breast segmentation, the lateral breast index tumor was segmented according to the tumor location. Peritumoral vessel on the MIP image was segmented using a multiscale Hessian-based filter. Additionally, the peritumoral vasculature by algorithm segmentation was generated via the intersection of the lateral tumor breast mask and the binary vessel segmentation region after reducing small gaps and filling holes. Finally, the vessel mask was identified via manual editing
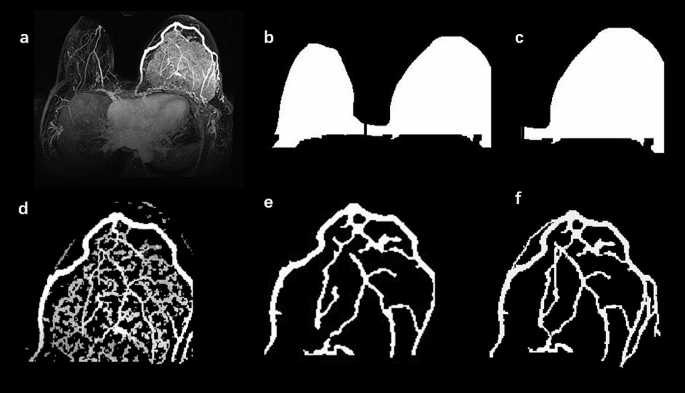
An illusion of vessel segmentation. (a) The axial maximum intensity projection (MIP) image in one patient. After the anatomic breast segmentation was performed (b), the tumor laterality was segmented according to the tumor location (c). Peritumoral vessel in the MIP image were enhanced and segmented with a multiscale Hessian-based filter (d). After hole filling and intersection steps were performed, peritumoral vasculature by algorithm segmentation was identified (e). The final vessel mask was identified via manual editing (f)
The final peritumoral vasculature, checked and edited by the breast radiologist (QZ, 11 years of experience), represented the reference standard. To evaluate the performance of vessel detection by algorithm segmentation, the correct-detection rate, incorrect-detection rate, and missed-detection rate were computed (Appendix E5 in the Supplementary Material).
Radiomic feature extraction
After tumor and peritumoral vessel were segmented, the shape, statistical and textural features were extracted on MIP images using the PyRadiomics Python package [17]. For the tumor and peritumoral vessel detected on the MIP images, we extracted radiomics features, including 10 shape features, 19 first-order statistical features, and 70 texture features. Furthermore, we extracted 356 wavelet features (i.e., LL, LH, HL, HH) for each tumor. Wavelet features provide representative transformed domain information regarding intensity and textural features by decomposing the original image in low and high frequencies [18]. Finally, 455 features quantifying intratumoral characteristics and 99 features quantifying peritumoral vascular characteristics were obtained.
Radiomic feature selection and model development
All the radiomics features were scaled to a range of [0, 1] by using a minimum-maximum scaler. Then, the least absolute shrinkage and selection operator (LASSO) configured recursive feature elimination (RFE) method was applied to select features for the intratumoral model, peritumoral vascular model, individually. And only the training dataset was used to train the LASSO feature selector. The k-nearest neighbor (k-NN) classifier was used to train and test the radiomics models for predicting pCR to NAC. The k-NN (k = 5) technique was trained based on the primary cohort, and then tested in the internal and external validation cohorts.
After building the tumor features-based prediction model and vessel features-based prediction model, an information fusion method was applied to fuse the prediction scores generated by the two models to improve the model performance [19]. The information fusion method included the minimum, maximum, and weighting average of the fusion.
Statistical analysis
Comparisons between the patient groups were employed with the Chi-square test or Fisher’s test for qualitative variables and the Student’s t-test or Mann-Whitney U test for quantitative variables. The areas under the receiver operating characteristic (ROC) curves (AUCs) were assessed and compared among the intratumoral model, peritumoral vascular model, and fusion model using the DeLong method [20]. Statistical analyses and radiomics analyses were performed with the Python programming language (v. 3.6, Python Software Foundation, https://www.python.org/). In our implementation, we utilized the default parameters provided by the Python packages for building the machine-learning classifier. Regarding the min-max normalization used in our method, it was applied consistently to maintain the scale of variables across the dataset. p\(<\)0.05 was considered statistically significant.
Results
Patients and pathologic complete responses
In total, 282 patients with TNBC were finally enrolled in this study. The clinical pathologic characteristics of patients from all cohorts are listed in Table 1.
A hundred of 282 patients (35.5%) achieved pCRs after NAC. The pCR rates in the primary cohort, internal validation cohort, and TCIA cohort were 36.6%, 38.9%, and 29.0%, respectively. With regard to clinicopathologic characteristics, no differences between the pCR and non-pCR groups in all cohorts were found in terms of the axillary status, Ki-67 expression, rim enhancement sign, or chemotherapy regimen (p > 0.05). Patients who achieved pCR in the primary cohort had greater premenopausal status, and had smaller tumor sizes than those who did not (p = 0.012, 0.022, respectively). Meanwhile, pCR was found to be significantly associated with clinical stage, tumor size and enhancement pattern in the internal validation cohort (p = 0.042, 0.024, 0.018, respectively).
Feature extraction
The overall performance of vessel identification was evaluated on all cohorts (Table 2). Vessel segmentation examples of 2 representative patients are shown in Fig. 4.

Examples of vessel segmentation in two representative patients are shown. The upper row shows a patient with triple-negative breast cancer (TNBC) who did not achieve a pathologic complete response (pCR); the lower row shows a patient with TNBC who achieved a pCR. (a) and (d) are maximum intensity projection (MIP) images. (b) and (e) are peritumoral vessel segmented by algorithm and intratumoral segmentation. (c) and (f) are peritumoral vessel edited by the radiologist and intratumoral segmentation
Eight tumor features and nigh peritumoral vessel features were selected from initial feature pool were included for further analysis. Detailed information on selected features is shown in Table 3.
Performance of radiomics models
The AUCs and ROC curves of the radiomics analyses in all cohorts are shown in Table 4. Other relevant classification metrics including accuracy, precision, recall, sensitivity, and specificity are shown in Appendix E6 in the Supplementary Material.
The peritumoral vascular model resulted in an AUC ranging from 0.61 to 0.77: primary cohort, 0.77 (95% confidence interval [CI]: 0.69, 0.83); internal validation cohort, 0.65 (95% CI: 0.54, 0.73); TCIA cohort, 0.61 (95% CI: 0.47, 0.73). Meantime, the intratumoral model yielded an AUC ranging from 0.61 to 0.75: primary cohort, 0.75 (95% CI: 0.66, 0.81); internal validation cohort, 0.64 (95% CI: 0.53, 0.73); TCIA cohort, 0.61 (95% CI: 0.47, 0.74). There were no statistically significant differences in each cohort of AUCs using intratumoral features or peritumoral vascular features (p > 0.05).
The fusion model yielded the highest AUC of 0.82 (95% CI: 0.75, 0.88) in the primary cohort, and the highest AUC of 0.67 (95% CI: 0.57, 0.76) in the internal cohort and the highest AUC of 0.65 (95% CI: 0.52, 0.78) in TCIA cohort (Table 5; Fig. 5). The fusion model showed improved performance over the intratumoral model and the peritumoral vascular model, but not significantly (p > 0.05).

Receiver operating characteristic (ROC) curves generated using the three different radiomics models in the primary (a), internal validation (b), and TCIA (c) cohorts. The models included one that only used peritumoral vessel features (green), one that only used tumor features (blue), and the best fusion model (red)
Discussion
In this study, we developed and validated a radiomics model that incorporated peritumoral vascular and intratumoral features extracted from pretreatment MIP images to predict pCRs to NAC in patients with TNBC. The proposed radiomics model provides new insights into the biological characteristics of TNBC and the early prediction of its pathologic responses to NAC.
Identifying patients not likely to benefit from NAC before treatment could enable tailored individual patient therapies, especially patients with TNBC, which has been known to display the highest distant metastatic rates and lowest overall survival of all breast cancer subtypes. Previous studies have shown that the prediction of pCRs to NAC varied across biological subtypes, indicating the need for specific radiomics models [3, 15]. A radiomics model dedicated to a specific biological subtype could create more reproducible and robust classification results [21].
Previous studies using intratumoral texture features extracted from DCE-MRI yielded AUCs of 0.64–0.68 for the early prediction of pCR in patients with TNBC [7, 22] and were in accordance with those in our study using texture features extracted from 2D MIP. The all intratumoral texture features selected were obtained from wavelet images, which are high-dimensional features that cannot be perceived by humans but hold more detailed information about tumors and are more sensitive when predicting pCRs [7, 23]. Although MIPs miss the proportion of tumor intensity, MIPs integrated with a DCE-MRI protocol can reveal not only the visualization of enhancing tumor but also the tumor-associated vasculature in the clinical scenario, and simplify the workflow to perform the extraction of tumor and peritumoral vasculature in the only one image. To the best of our knowledge, MIPs have never been proposed for feature extractions. The potential association between MIP-derived tumor features and pCR should be further investigated in future studies.
Tumor angiogenesis is essential for the growth, invasion, and metastasis of tumors. Overexpression of vascular endothelial growth factor (VEGF) has been extensively investigated to be a key player in the formation of tumor neovasculature with many abnormal features [24]. Compared with ER-positive breast cancer, TNBC has a higher degree of VEGF, an avid stimulator of angiogenesis, which is closely correlated with the risk of distant metastases [25]. This angiogenic activity constitutes the basis for the detection and differentiation of breast cancer using DCE-MRI. MIPs from DCE-MRI can assess angiogenic activity and are considered a promising noninvasive investigational tool. Studies focusing on the use of peritumoral vessel to evaluate the response of patients with breast cancer to NAC have been reported [26, 27]. These studies assessed quantitative differences in the number and volume of peritumoral vessels before and after NAC and showed that vessel changes could serve as an early indicator to predict pathologic responses.
In our study, we performed Hessian-based algorithm to segment the tumor-associated vessels from the axial MIPs of the first postcontrast phase where the greatest lesion conspicuity with the lowest background parenchymal enhancement were demonstrated, as well as the best “angiographic effect” for both arteries and veins [28]. Hessian-based algorithm showed correct-detection rates of 83.1-89.8%, incorrect-detection rates of 20.1-27.2%, and missed-detection rates of 10.2-16.9%, which are similar to those in previous studies with the same algorithm [29, 30]. The incorrect-detection rates were mainly caused by linearly distributed BPE, as well as subtraction artifacts along the breast skin. The missed-detection rates were mainly due to low-signal vascular pixels identified by the radiologist but not detected by the algorithm. Furthermore, the senior radiologist checked and edited the vasculature segmented by the algorithm to get the final peritumoral vasculature for the further radiomics feature extraction. The best-performing vessel features were all from gray level dependence matrix (GLDM) quantifying gray level dependencies in an image. There features may indicate more heterogeneous of abnormal angiogenic vessels surrounding tumors demonstrating non-pCRs [31]. A higher level of abnormal vasculature and the possibility of more discontinuities in the convoluted vasculature might constrict the delivery of chemotherapeutic drugs to tumors, thereby resulting in worse treatment responses [32].
Peritumoral vascular model of TNBC on pretreatment MIP images demonstrated a similar classification performance to that of intratumoral model. Furthermore, a combined peritumoral vascular and intratumoral signature resulted in improved performance, albeit the difference was not significant. These findings suggest that peritumoral vascular radiomics based on MIP might provide a preliminary success for treatment responses in patients with TNBC. However, the performance of our model in the external validation cohort was observed to be subpar. Factors such as differences in patient demographics and treatment protocols likely contributed to this discrepancy. Moving forward, in future studies, addressing these limitations and refining the model through additional validation steps will be paramount to enhancing its reliability and applicability in real-world clinical settings.
For this study, we acknowledge the following limitations. First, the models in the retrospective study did not used these certain imaging-related features, such as tumor size and enhancement pattern, which exhibited a positive correlation with pCR prediction in one or two cohorts. Further prospective studies will explore these imaging-based features to enhance the performance of the pCR prediction model. Second, we extracted tumor features from a single representative 2D MIP image, which might not provide a comprehensive assessment of whole-tumor heterogeneity. Also, the vasculature segmented from the 2D MIP image could give distorted measures. Specifically, we used the axial MIP image to extract peritumoral vascular and intratumoral features because the MIP image revealed not only tumor enhancements but also tumor vasculature, making the interpretation and analysis simpler than when using full-study DCE-MRI images. We are currently exploring 3D tumor (including necrosis or excluding necrosis) and vascular segmentation on 3D-subtracted postcontrast images [33]. Third, the evaluation of peritumoral vessels was not compared with vessels on the contralateral normal breast in our study. Further studies evaluating vessels of the contralateral normal breast are needed. Finally, MR contrast agent, MR devices, scanning parameters such as spatial resolution of images, and different phases of the menstrual cycle have effects on the segmentation of peritumoral vessels and so on the performance of peritumoral vascular radiomics analysis.
Conclusions
The peritumoral vascular and intratumoral radiomics based on pretreatment MIP images from DCE-MRI can be used to predict pCR to NAC in TNBC patients. This strategy of radiomics analysis could provide a potential approach to assist in understanding the biologic behavior, pretreatment planning, and response prediction of TNBC.
Data availability
The datasets used and/or analysed during the current study are available from the corresponding author upon reasonable request.
Abbreviations
- AUC:
-
Areas under the curve
- BPE:
-
Background parenchyma ehancement
- DCE-MRI:
-
Dynamic contrast-enhanced magnetic resonance imaging
- GLDM:
-
Gray level dependence matrix
- k-NN:
-
k-nearest neighbor
- LASSO:
-
Least absolute shrinkage and selection operator
- MIP:
-
Maximum intensity projection
- NAC:
-
Neoadjuvant chemotherapy
- pCR:
-
Pathologic complete response
- RFE:
-
Recursive feature elimination
- ROC:
-
Receiver operating characteristic
- TNBC:
-
Triple-negative breast cancer
References
Dent R, Trudeau M, Pritchard KI, et al. Triple-negative breast cancer: clinical features and patterns of recurrence. Clin Cancer Res. 2007;13:4429–34.
Liedtke C, Mazouni C, Hess KR, et al. Response to neoadjuvant therapy and long-term survival in patients with triple-negative breast cancer. J Clin Oncol. 2008;26:1275–81.
Cortazar P, Zhang L, Untch M, et al. Pathological complete response and long-term clinical benefit in breast cancer: the CTNeoBC pooled analysis. Lancet. 2014;384:164–72.
Dialani V, Chadashvili T, Slanetz PJ. Role of imaging in neoadjuvant therapy for breast cancer. Ann Surg Oncol. 2015;22:1416–24.
Gillies RJ, Kinahan PE, Hricak H. Radiomics: images are more than pictures, they are data. Radiology. 2016;278:563–77.
Park VY, Kim EK, Kim MJ, Yoon JH, Moon HJ. Perfusion parameters on breast dynamic contrast-enhanced MRI are Associated with Disease-specific survival in patients with triple-negative breast Cancer. AJR Am J Roentgenol. 2017;208:687–94.
Liu Z, Li Z, Qu J, et al. Radiomics of Multiparametric MRI for Pretreatment Prediction of Pathologic Complete Response to neoadjuvant chemotherapy in breast Cancer: a Multicenter Study. Clin Cancer Res. 2019;25:3538–47.
Cain EH, Saha A, Harowicz MR, Marks JR, Marcom PK, Mazurowski MA. Multivariate machine learning models for prediction of pathologic response to neoadjuvant therapy in breast cancer using MRI features: a study using an independent validation set. Breast Cancer Res Treat. 2019;173:455–63.
Mazurowski MA, Zhang J, Grimm LJ, Yoon SC, Silber JI. Radiogenomic analysis of breast cancer: luminal B molecular subtype is associated with enhancement dynamics at MR imaging. Radiology. 2014;273:365–72.
Wang J, Kato F, Oyama-Manabe N, et al. Identifying Triple-negative breast Cancer using background parenchymal enhancement heterogeneity on dynamic contrast-enhanced MRI: a pilot Radiomics Study. PLoS ONE. 2015;10:e0143308.
Braman NM, Etesami M, Prasanna P, et al. Intratumoral and peritumoral radiomics for the pretreatment prediction of pathological complete response to neoadjuvant chemotherapy based on breast DCE-MRI. Breast Cancer Res. 2017;19:57.
Hanahan D, Folkman J. Patterns and emerging mechanisms of the angiogenic switch during tumorigenesis. Cell. 1996;86:353–64.
Saha A, Harowicz MR, Grimm LJ, et al. A machine learning approach to radiogenomics of breast cancer: a study of 922 subjects and 529 DCE-MRI features. Br J Cancer. 2018;119:508–16.
Goldhirsch A, Winer EP, Coates AS, et al. Personalizing the treatment of women with early breast cancer: highlights of the St Gallen International Expert Consensus on the primary therapy of early breast Cancer 2013. Ann Oncol. 2013;24:2206–23.
von Minckwitz G, Untch M, Blohmer JU, et al. Definition and impact of pathologic complete response on prognosis after neoadjuvant chemotherapy in various intrinsic breast cancer subtypes. J Clin Oncol. 2012;30:1796–804.
Vignati A, Giannini V, Carbonaro LA, et al. A new algorithm for automatic vascular mapping of DCE-MRI of the breast: clinical application of a potential new biomarker. Comput Methods Programs Biomed. 2014;117:482–8.
van Griethuysen JJM, Fedorov A, Parmar C, et al. Computational Radiomics System to Decode the Radiographic phenotype. Cancer Res. 2017;77:e104–7.
Laine A, Fan J. Texture classification by wavelet packet signatures. IEEE Trans Pattern Anal Mach Intell. 1993;15:1186–91.
Gong J, Liu JY, Jiang YJ, Sun XW, Zheng B, Nie SD. Fusion of quantitative imaging features and serum biomarkers to improve performance of computer-aided diagnosis scheme for lung cancer: a preliminary study. Med Phys. 2018;45:5472–81.
DeLong ER, DeLong DM, Clarke-Pearson DL. Comparing the areas under two or more correlated receiver operating characteristic curves: a nonparametric approach. Biometrics. 1988;44:837–45.
Granzier RWY, van Nijnatten TJA, Woodruff HC, Smidt ML, Lobbes MBI. Exploring breast cancer response prediction to neoadjuvant systemic therapy using MRI-based radiomics: a systematic review. Eur J Radiol. 2019;121:108736.
Golden DI, Lipson JA, Telli ML, Ford JM, Rubin DL. Dynamic contrast-enhanced MRI-based biomarkers of therapeutic response in triple-negative breast cancer. J Am Med Inf Assoc. 2013;20:1059–66.
Nie K, Shi L, Chen Q, et al. Rectal Cancer: Assessment of Neoadjuvant Chemoradiation Outcome based on Radiomics of Multiparametric MRI. Clin Cancer Res. 2016;22:5256–64.
Hoeben A, Landuyt B, Highley MS, Wildiers H, Van Oosterom AT, De Bruijn EA. Vascular endothelial growth factor and angiogenesis. Pharmacol Rev. 2004;56:549–80.
Linderholm BK, Hellborg H, Johansson U, et al. Significantly higher levels of vascular endothelial growth factor (VEGF) and shorter survival times for patients with primary operable triple-negative breast cancer. Ann Oncol. 2009;20:1639–46.
Martincich L, Bertotto I, Montemurro F, et al. Variation of breast vascular maps on dynamic contrast-enhanced MRI after primary chemotherapy of locally advanced breast cancer. AJR Am J Roentgenol. 2011;196:1214–8.
Wu LA, Chang RF, Huang CS, et al. Evaluation of the treatment response to neoadjuvant chemotherapy in locally advanced breast cancer using combined magnetic resonance vascular maps and apparent diffusion coefficient. J Magn Reson Imaging. 2015;42:1407–20.
Sardanelli F, Iozzelli A, Fausto A, Carriero A, Kirchin MA. Gadobenate dimeglumine-enhanced MR imaging breast vascular maps: association between invasive cancer and ipsilateral increased vascularity. Radiology. 2005;235:791–7.
Lin M, Chen JH, Nie K, Chang D, Nalcioglu O, Su MY. Algorithm-based method for detection of blood vessels in breast MRI for development of computer-aided diagnosis. J Magn Reson Imaging. 2009;30:817–24.
Vignati A, Giannini V, Bert A, et al. A fully automatic multiscale 3-dimensional hessian-based algorithm for vessel detection in breast DCE-MRI. Invest Radiol. 2012;47:705–10.
Sun C, Wee WG. Neighboring gray level dependence matrix for texture classification. Computer vision. Graphics Image Process. 1983;23:341–52.
Viens P, Jacquemier J, Bardou VJ, et al. Association of angiogenesis and poor prognosis in node-positive patients receiving anthracycline-based adjuvant chemotherapy. Breast Cancer Res Treat. 1999;54:205–12.
Wu C, Pineda F, Hormuth DA 2nd, Karczmar GS, Yankeelov TE. Quantitative analysis of vascular properties derived from ultrafast DCE-MRI to discriminate malignant and benign breast tumors. Magn Reson Med. 2019;81:2147–60.
Acknowledgements
Not applicable.
Funding
This study has received funding by the National Natural Science Foundation of China (grant number, 82071878) and Shanghai Science and Technology Innovation Action Plan Medical Innovation Research Project (grant number, 21Y11910200).
Author information
Authors and Affiliations
Contributions
TX and JG contributed to study design and manuscript editing. TX contributed to data collection and analysis. QZ contributed to imaging evaluation. SW contributed to clinical studies. CW contributed to manuscript editing. JG contributed to the study design, data analysis and manuscript editing. WP and YG contributed to the study design and imaging evaluation. All authors reviewed the manuscript.
Corresponding authors
Ethics declarations
Ethics approval and consent to participate
The study complied with the Declaration of Helsinki guidelines and declaration.
Consent for publication
Not applicable.
Competing interests
The authors declare no competing interests.
Additional information
Publisher’s Note
Springer Nature remains neutral with regard to jurisdictional claims in published maps and institutional affiliations.
Electronic supplementary material
Below is the link to the electronic supplementary material.
Rights and permissions
Open Access This article is licensed under a Creative Commons Attribution 4.0 International License, which permits use, sharing, adaptation, distribution and reproduction in any medium or format, as long as you give appropriate credit to the original author(s) and the source, provide a link to the Creative Commons licence, and indicate if changes were made. The images or other third party material in this article are included in the article’s Creative Commons licence, unless indicated otherwise in a credit line to the material. If material is not included in the article’s Creative Commons licence and your intended use is not permitted by statutory regulation or exceeds the permitted use, you will need to obtain permission directly from the copyright holder. To view a copy of this licence, visit http://creativecommons.org/licenses/by/4.0/. The Creative Commons Public Domain Dedication waiver (http://creativecommons.org/publicdomain/zero/1.0/) applies to the data made available in this article, unless otherwise stated in a credit line to the data.
About this article

Cite this article
Xie, T., Gong, J., Zhao, Q. et al. Development and validation of peritumoral vascular and intratumoral radiomics to predict pathologic complete responses to neoadjuvant chemotherapy in patients with triple-negative breast cancer. BMC Med Imaging 24, 136 (2024). https://doi.org/10.1186/s12880-024-01311-7
Received:
Accepted:
Published:
DOI: https://doi.org/10.1186/s12880-024-01311-7