
Abstract
Background
Providing the photosynthesis factory for plants, chloroplasts are critical for crop biomass and economic yield. However, chloroplast development is a complicated process, coordinated by the cross-communication between the nucleus and plastids, and the underlying biogenesis mechanism has not been fully revealed. Variegation mutants have provided ideal models to identify genes or factors involved in chloroplast development. Well-developed chloroplasts are present in the green tissue areas, while the white areas contain undifferentiated plastids that are deficient in chlorophyll. Unlike albino plants, variegation mutants survive to maturity and enable investigation into the signaling pathways underlying chloroplast biogenesis. The allelic variegated mutants in barley, grandpa 1 (gpa1), have long been identified but have not been genetically characterized.
Results
We characterized and genetically analyzed the grandpa1.a (gpa1.a) mutant. The chloroplast ultrastructure was evaluated using transmission electron microscopy (TEM), and it was confirmed that chloroplast biogenesis was disrupted in the white sections of gpa1.a. To determine the precise position of Gpa1, a high-resolution genetic map was constructed. Segregating individuals were genotyped with the barley 50 k iSelect SNP Array, and the linked SNPs were converted to PCR-based markers for genetic mapping. The Gpa1 gene was mapped to chromosome 2H within a gene cluster functionally related to photosynthesis or chloroplast differentiation. In the variegated gpa1.a mutant, we identified a large deletion in this gene cluster that eliminates a putative plastid terminal oxidase (PTOX).
Conclusions
Here we characterized and genetically mapped the gpa1.a mutation causing a variegation phenotype in barley. The PTOX-encoding gene in the delimited region is a promising candidate for Gpa1. Therefore, the present study provides a foundation for the cloning of Gpa1, which will elevate our understanding of the molecular mechanisms underlying chloroplast biogenesis, particularly in monocot plants.
Background
As the characteristic organelle in plant cells, the chloroplast is critical for plant photosynthesis and has a significant impact on biomass and economic yield. An increasing number of studies have revealed that chloroplasts also make important contributions to plant immunity through the synthesis of secondary metabolites and defense phytohormones, such as reactive oxygen species, nitric oxide, jasmonic acid, and salicylic acid [1, 2]. To restrict pathogen infection, chloroplasts can navigate to the penetration site and directly suppress host cell invasion [3]. Therefore, the understanding of chloroplast biogenesis is necessary to meet the increasing food demand under rising population pressure.
Chloroplasts are differentiated from undeveloped plastids, which contain undifferentiated vesicles and lack stacked thylakoids (grana), the mounting-platform for chlorophyll. Chloroplast biogenesis is highly complex, being orchestrated by anterograde (nucleus to chloroplast) and retrograde (chloroplast to nucleus) signaling [4, 5]. More than 95% of the ∼3000 proteins found in chloroplasts are encoded by nuclear genes and imported into chloroplast following synthesis in the cytosol, suggesting that chloroplast development is predominantly controlled by the nuclear genome [6]. Therefore, identification and functional characterization of such nuclear genes is important to understand the regulatory mechanisms underlying chloroplast biosynthesis. Variegation mutants have provided ideal models to identify genes or factors involved in chloroplast development [7]. Well-developed chloroplasts are present in the green tissue areas, while the white areas contain undifferentiated plastids that are deficient in chlorophyll. Unlike albino plants, variegation mutants survive to set seed and enable investigation of cross-communication between the nucleus and plastids.
Two representative Arabidopsis variegation mutants, immutans (im) and variegated 2 (var2), have been characterized and provided fundamental perspectives to the understanding of chloroplast biogenesis in plants [8,9,10,11,12]. The im mutant is caused by loss-of-function of a nuclear-encoded plastid terminal oxidase (PTOX), normally present in the thylakoid membranes. This plastoquinol oxidase also has homology to the alternative oxidase (AOX) in mitochondria [8, 9]. The VAR2 gene, also known as Filamentous temperature-sensitive H2 (FtsH2), encodes a chloroplast-targeting ATP-dependent zinc metalloprotease homologous to the E. coli FtsH [13]. Both IM and VAR2 play roles in photoprotection and in regulation of redox state of the photosynthetic electron transport chain [8, 10, 14, 15]. Lack of these proteins resulted in photodamaged/photooxidized plastids under high light, particularly in the white sections. Moreover, FtsH-mediated proteolysis is involved in retrograde signaling activated by ROS [16].
The green sections containing competent chloroplasts in variegation mutants may indicate the existence of compensatory mechanisms to escape the defect of mutation. Suppressor screening in the im and var2 backgrounds has identified a few second-site mutations restoring the variegation phenotype. Suppressors of im include a thylakoid membrane protein (Chlororespiratory reduction 2–2, Crr2–2) and a plant combinatorial and modular protein (PCMP) family member (Proton Gradient Regulation 5, PGR5) [17]. The PCMP family is closely related to pentatricopeptide repeat (PPR) proteins functioning in the editing and maturation of organellar RNA. Both Crr2–2 and PGR5 are also required for alternative electron transport pathways that alleviate photodamage during chloroplast biogenesis and photosynthesis [18]. Most of the identified var2 suppressors are involved in chloroplast translation or rRNA processing and editing, such as a chloroplast-localized pseudouridine synthase (Suppressor of Variegation1, SVR1), a ClpR1 subunit of the chloroplast ClpP/R protease (SVR2), a chloroplast translation initiation factor 2 (Fu-gaeri1, FUG1), a chloroplast translation elongation factor EF-G (Snow Cotyledon 1, SCO1), and a PPR protein (SVR7) [19]. Although variegated mutants and suppressor screening enabled the cloning of many genes involved in chloroplast development, there are still major gaps in the knowledge of chloroplast biogenesis and the variegation mechanism.
Due to the difference in chloroplast development between monocotyledonous and dicotyledonous plants, variegation mutants of monocots exhibit striping phenotype with alternating white and green bands on the leaf. Barley (Hordeum vulgare subsp. vulgare) is the fourth most important cereal crop which is used as feed grain, human food, and raw material for the malting and brewing industry. It is also a valuable model monocot for plant genomics research. Chemical- and radiation-mediated mutagenesis has created abundant genetic material for barley improvement and genomic research (http://www.nordgen.org/). Introgression of characterized mutations from various sources into the common background, Bowman, has generated a series of near-isogenic lines (NILs) with single mutated alleles, providing a powerful tool for rapid gene identification [20]. Several variegated mutants have been identified but few have been genetically characterized [21], including the allelic mutants of grandpa (gpa or gp) identified in 1940s [22,23,24].
An allelism test and linkage study with morphological markers anchored the Gpa gene onto the long arm of chromosome 2 (2HL) [20, 25]. However, the genetic control of the gpa mutants has not been investigated. The gpa1.a allele was caused by a spontaneous mutation in cultivar Lyallpur (GSHO 519), and it was introduced into the Bowman background with introgression [20]. Using BW397, a NIL of Bowman carrying the gpa1.a mutation, we characterized and finely mapped the Gpa1 gene in the present study. It was revealed that chloroplast biogenesis is defective at the white stripes in the mutant, and the Gpa1 gene is located in a gene cluster functionally related to photosynthesis or chloroplast differentiation. One gene in the delimited region codes for a putative PTOX homologous to IM of Arabidopsis, and we found that a large deletion occurring to this gene totally disrupted its function in BW397. Therefore, this PTOX-encoding gene was considered as a promising candidate for Gpa1. The high-resolution genetic map provided here lays the foundation for the cloning of this gene, which will further our understanding of molecular mechanisms underlying chloroplast biosynthesis.
Results
Phenotype characterization of the gpa1 mutant
Normally, the seedlings of gpa1 have an albino first leaf and display chlorosis at the tip of the second leaf (Fig. 1a). A striped pattern then develops with expansion of the second leaf (Fig. 1a and b). Striping occasionally occurs on the third and subsequent leaves. Consistent with the visual difference, chemical analysis also indicated that levels of chlorophyll a, b and total in striped leaves of BW397 were significantly lower than that of WT Bowman plants (Fig. 1c). An adult BW397 plant produces albino or striped flag leaf, spike, awns and even anthers (Fig. 1d and Additional Fig. 1), and the mutant is much shorter than WT (Fig. 1d). The mutants display reduced fertility with an average of 4 seeds/spike compared to 18 seeds/spike in WT (Fig. 1e). Seed size of BW397, measured as 100-seed weight, is only 3/4 that of the WT’s (Fig. 1f). In addition to the striped leaf phenotype, the gpa1 mutation causes a systemic effect on barley growth and development.

Phenotypic comparison between Bowman and BW397. Albino and striped leaves were observed on BW397 seedlings (a and b), chlorophyll-deficiency was confirmed by chemical analysis with four replications (c). With a smaller plant size, flowering BW397 produced albino or striped flag leaf, spike, and awns (d). Seed/spike (determined with 20 spikes, e) and seed weight (5 replications, f) of mutant was significantly reduced. Chl, chlorophyll; chla, chlorophyll a; chlb, chlorophyll b. Scale bars in A and B, 5 mm; Scale bar in D, 10 cm
To confirm the striped phenotype is associated with defects in chloroplast biogenesis, we compared the chloroplast ultrastructure of Bowman and BW397 using transmission electron microscopy (TEM) (Fig. 2). As expected, numerous normal chloroplasts with well-organized thylakoids are developed in the WT cells (Fig. 2a and b). Thylakoids are arranged in grana stacks, which are connected by stroma lamellae (Fig. 2c). On the contrary, BW397 cells in the albino sections contain few undeveloped plastids (Fig. 2d). Lamellae, acting like the skeleton in a normal chloroplast, is not well developed in the mutant (Fig. 2d, e, and f). Stacked grana and thylakoid membranes are also missing in these undifferentiated plastids (Fig. 2e and f). Therefore, chloroplast biogenesis in the white stripes of BW397 is abolished by the gpa1 mutation.
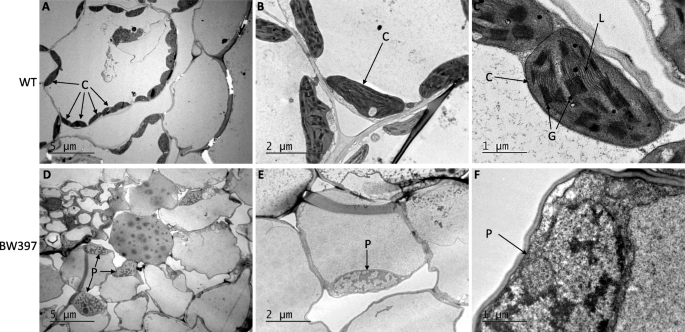
Chloroplast ultrastructure observed with a transmission electron microscope. Functional chloroplasts are well organized in the WT cells (A-C). Chloroplast are not developed in the white section of BW397 (a). Lamellae and stacked grana are missing in these undifferentiated plastids (b, c). C, chloroplast; G, grana; L, lamellae, P, plastid
Genetic mapping of Gpa1
A total of 510 F2 plants derived from the cross between Bowman and BW397 were used for genetic mapping of Gpa1. Of those, 133 were striped, while the remaining 377 F2 plants exhibited normal green leaf color. The segregation ratio of striped/green fits 1:3 (χ2 = 0.316, df = 1, and P = 0.57), suggesting that the gpa1 mutation is monofactorial recessive. As an immediate strategy for gene localization and marker discovery, SNP array analysis was used to genotype 48 F2 plants (24 striped and 24 green) together with the parental lines. As the Gpa1 gene was anchored to 2H [20], we focused on the SNPs on 2H and identified 1013 polymorphic markers on this chromosome (Additional Table 1).
Initial genotype analysis of 48 F2 progeny revealed that the Gpa1 gene was located in ~ 5.56 Mb region flanked by two array SNPs, JHI-Hv50k-2016-139,629 and JHI-Hv50k-2016-142,540 (Additional Table 1). To increase the resolution of mapping, we enriched this region with SSR markers previously co-located to the stripped phenotype [20], known SNPs on 2H consensus map [26], and specific 50 k markers within this region (Table 1). The analysis of an additional 104 F2 progeny genotyped with these markers further delimited the Gpa1 gene between M4 and M6 (Fig. 3a). When we enlarged the segregating population to 510 F2 plants, the Gpa1 region was narrowed down to a 410-kb region by M19 and M8 (Fig. 3b), where one co-segregating SNP, M20, was identified.

Genetic and physical mapping of the Gpa1 locus. Genetic mapping was conducted sequentially with 104 (a) and 510 (b) F2 individuals. Gpa1 is located on 2H, delimited to an ~ 0.7 cM region between markers M19 and M8 (b). Total of 15 protein-coding genes were identified in the Gpa1 region spanning ~ 400 kb (c). Numbers above the linkage group indicate the number of recombination breakpoints separating the marker from Gpa1. The maps are drawn to scale. M, marker; G, gene
Physical localization of Gpa1
Fifteen putative protein-coding genes were identified in the fine-mapping interval according to the reference genome assembly [27] (Table 2). Of them, three putatively encode acyl-protein thioesterase 1-like proteins (HORVU.MOREX.r2.2HG0177100/G1, HORVU.MOREX.r2.2HG0177110/G2, and HORVU.MOREX.r2.2HG0177120/G3), and one each for EH domain-containing protein 1 (HORVU.MOREX.r2.2HG0177170/G4), ethylene-responsive transcription factor (HORVU.MOREX.r2.2HG0177180/G6), FAD-binding Berberine family protein (HORVU.MOREX.r2.2HG0177170/G7), and choline transporter-related family protein (HORVU.MOREX.r2.2HG0177310/G15). A gene cluster functionally related to photosynthesis or organelle biogenesis was also identified in the Gpa1 region, including 4 blue copper genes with high similarity (HORVU.MOREX.r2.2HG0177210/G7, HORVU.MOREX.r2.2HG0177220/G9, HORVU.MOREX.r2.2HG0177230/G10, and HORVU.MOREX.r2.2HG0177250/G12), one DNA topoisomerase gene (HORVU.MOREX.r2.2HG0177240/G11), and 2 genes encoding putative PTOXs with homology to alternative oxidase (HORVU.MOREX.r2.2HG0177260/G13 and HORVU.MOREX.r2.2HG0177270/G14).
Blue copper protein function as an electron shuffler in electron transfer reactions, such as biological nitrogen fixation, respiration and photosynthesis. Structure analysis indicated the putative blue copper proteins, G7, G9, G10, and G12, in the Gpa1 region contain a domain identified in plastocyanin, the long-range electron carrier between photosystems II and I [28]. Alternative oxidase is involved in the regulation of redox state of the electron transport chain in organelles [8, 9, 18]. Particularly, the putative coding product of G14 shares high homology with IM (AT4G22260), the plastid terminal oxidase in Arabidopsis [8, 9]. Therefore, G14 was named HvPTOX hereafter. For the G11 gene, two different products, one PPR protein and one DNA gyrase, were predicted in the sense and antisense strand, respectively (Additional Fig. 2). The putative introns of the DNA gyrase gene contain coding exons in the reverse complementary strand for the predicted PRR gene, and vice versa (Additional Fig. 2). The EST match for the putative DNA gyrase was identified (FD525137), but we did not find ESTs for the predicted PPR from the available databases. DNA gyrase or topoisomerase has been linked to regulation of DNA replication and transcription during chloroplast biogenesis [29]. Although lacking EST matches, the predicted PPR protein is highly homologous to SVR7, one of the suppressors of the Arabidopsis var2 mutation [19]. Therefore, members of this functionally related gene cluster were selected for further analysis.
Selection of the Gpa1 candidate
The four blue copper proteins within this region share at least 75% sequence identity, and the coding products of G9 and G12 vary by only one amino acid (aa) substitution. We speculated that these blue copper proteins may function redundantly, and mutation on one gene may not result in apparent phenotype change. Moreover, the AOX encoded by G13 is incomplete, and was eliminated from further analysis. Using Bowman, BW397, Lyallpur and its isogenic mutant GSHO 519, we focused on identifying sequence polymorphism between the gene alleles in G11 and G14 (HvPTOX).
Although a few SNPs were detected between the Bowman and Morex alleles of G11, Bowman, BW397, GSHO 519 and Lyallpur share identical genomic sequences including the coding region. This suggested that G11 might not be one of the candidates for Gpa1.
Gene prediction and EST matches (DK626738, DK619131, BF626913, RUS39D06w and HB15J15r) showed that HvPTOX contains 10 coding exons and 9 introns (Fig. 4a). The full-length coding region was successfully amplified in Bowman and Lyallpur, but not in mutants of BW397 and GSHO519 (Fig. 4b, Additional Table 2). We only obtained the 3′ region of the coding sequence in the mutants (Fig. 4b, Additional Table 2). To capture the full length of HvPTOX, we conducted FPNI-PCR to acquire the coding sequence at the 5′ region. Sequencing of the product derived from FPNI-PCR indicated that the first three and almost half of the fourth exon were missing in the mutated allele. However, the sequence proximal to the fourth exon of HvPTOX in BW397 cannot be aligned to the assembled reference genome, and it is not homologous to any known protein coding sequences or transposable elements.
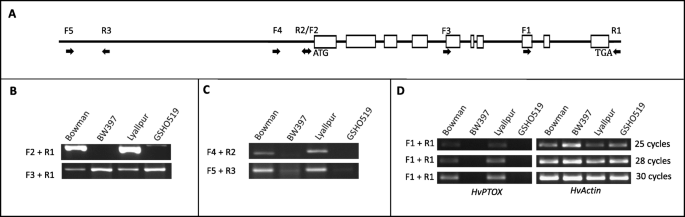
Gene structure and mutation analysis of the HvPTOX gene. The coding region of HvPTOX contains 10 exons (rectangles) and 9 introns (straight lines) (a). Various primers indicated with arrows (a) were used to analyze the mutated allele, and the primer sequences were included in Additional Table 2. Full-length of the coding region could not be obtained with the primer combination of F2 and R1 in mutants, but half of that at the 3′ was successfully amplified with primers F3 and R1 (b). The promoter (F4 and R2) and a region at the 2.5 kb upstream of the start codon (F5 and R3) were deleted altogether in mutants (c). RT-PCR analysis with 25, 28 and 30 PCR cycles failed to detect the expression of Hvptox in mutants. Actin was used as the internal control. The original gel images were included in Additional Figs. 3 and 4
To determine if the gene mutation was caused by insertion or deletion, we designed more markers at the potential promoter and far-upstream regions (2.5 kb upstream of the start codon) of HvPTOX. Our result indicated that those markers were all missing in mutants (Fig. 4c). In line with the deletion of the promoter, RT-PCR confirmed that HvPTOX was not expressed in mutants (Fig. 4d). Its expression in mutants could not be detected even with 30 PCR cycles, in contrast to the expression abundance indicated by the 25 cycles in wild types (Fig. 4d). Quantitative real-time PCR (qRT-PCR) also revealed that the expression of gpa1 is significantly suppressed in mutants (Additional Fig. 5). Although the size of the deletion was unknown, HvPTOX structure, expression and thus function was totally disrupted in mutants. Therefore, the HvPTOX gene (G4/HORVU.MOREX.r2.2HG0177270) was selected as a strong candidate. The identity of Gpa1 still needs to be further verified in homologous or heterologous systems.
Discussion
Plant chloroplast biogenesis is important for biomass and economic yield. Variegation mutants provide an ideal model to understand the development of functional chloroplasts. The allelic mutants of gpa has long been identified, but their genetic basis underlying variegation remains unknown. In the present study, we characterized the chloroplast ultrastructure of the gpa1.a mutant and localized the corresponding locus. The lack of chlorophyll in the white stripes of the mutant is caused by the interruption of chloroplast biogenesis. The Gpa1 gene was delimited within a 410-kb region containing a cluster of functionally related genes. A genomic deletion in the PTOX-encoding gene in mutants abolished its gene function, suggesting it is a promising candidate for Gpa1.
Many functionally related genes are distributed nonrandomly throughout the genome as functional clusters in eukaryotes [30]. In plants, many biosynthetic gene clusters for secondary metabolism have been identified [31]. Those clusters may have arose from recruitment of genes from elsewhere in the genome through duplication and neofunctionalization, but not by horizontal gene transfer from prokaryotes [32]. From an evolutionary perspective, the physical clustering of functionally related genes may facilitate coordinated gene expression and prevent the breakup of co-adapted alleles during recombination [32, 33]. The cluster members in the Gpa1 region may target chloroplast for photosynthesis or chloroplast development. However, their actual functional roles require further investigation. Using CRISPR technology to knock out the clustered genes individually will possibly solve this puzzling question.
Although G11 may not be Gpa1, it is interesting to discover if two different genes are derived from the same genomic fragment. Eukaryotic operon-like transcription has been observed, and one mRNA can be translated to several separate products in the cytoplasm [34, 35]. However, there have been no reports for two independent genes harbored on reverse complementary strands. The lack of EST matches for the PRR-coding gene suggests that it may not be a true gene, but this conclusion needs to be confirmed with rapid amplification of cDNA ends (RACE).
The PTOX protein encoded by G14 shares high identity with IM in Arabidopsis. The variegation mutant im in Arabidopsis and the orthologous ghost mutant in tomato both display the loss of PTOX caused defect in chloroplast biosynthesis [9, 36]. It was discovered that PTOX functions as a terminal oxidase in controlling the redox state of the plastoquinone (PQ) pool in developing and mature thylakoids [37, 38]. PTOX is involved in transferring electrons from plastoquinol (PQH2) to molecular oxygen, forming water and PQ [38]. The role in regulation of the redox state of the photosynthetic apparatus makes PTOX crucial for a growing number of biochemical pathways, such as the desaturation reactions in carotenoid biosynthesis, chlororespiration, PSI cyclic electron flow, and photoprotection [37, 39, 40].
Biosynthesis of carotenoid is impaired in the im mutant due to the lack of phytoene desaturation (PDS), and the intermediate phytoene is accumulated in the white sections of leaves [8, 9]. The white areas of im might accumulate white photodamaged plasmids due to the lack of photoprotective carotenoid [10]. It was also demonstrated that the redox state of the PQ pool may control chloroplast biogenesis as a potent initiator of retrograde signaling [37, 41]. Under these scenarios, the predicted HvPTOX (HORVU.MOREX.r2.2HG0177270) in the Gpa1 region was designated a strong candidate. This series of gpa mutants were identified almost 80 years ago, and fine localization of Gpa1 in this study has provided candidates for functional validation, facilitating cloning of this long-elusive gene.
Conclusions
In summary, we have characterized and genetically mapped the gpa1.a mutation causing a variegation phenotype in barley. Our results indicate that chloroplast biogenesis is defective in white sections of the mutant, and the gpa1 mutation imposes a systemic effect on barley growth and development. The Gpa1 gene was mapped to chromosome 2H within a 410 kb region. In addition, we have shown that Gpa1 is harbored in a gene cluster functionally related to photosynthesis or the chloroplast. Further studies have indicated that a genomic deletion disrupts the expression and function of the PTOX-encoding gene, G14/HORVU.MOREX.r2.2HG0177270. Therefore, the present study paves the way for the cloning of Gpa1, which will improve our understanding of the molecular mechanisms underlying chloroplast biogenesis.
Methods
Plant materials
An F2 segregating population derived from the cross between Bowman (wild type) and BW397 (the gpa1.a mutant) was used for genetic mapping of the Gpa1 gene. The gpa1.a mutation was donated by GSHO519 carrying the genetic background of Lyallpur. Seeds of Bowman, BW397, GSHO519 and Lyallpur were obtained from the USDA-ARS National Plant Germplasm System (NPGS). A total of 510 F2 plants were used to generate a genetic map. All plants together with parents were grown in a greenhouse under a 16 h light/8 h dark photoperiod at 25 °C. Phenotyping was conducted at the 1st leaf stage and repeated at the boot stage. Phenotype of F2 recombinants delimiting the Gpa1 region was confirmed with 30 F3 individuals.
DNA extraction
DNA was extracted according to the CTAB protocol [42]. Around 100 mg leaf samples were collected from plants at the three-leaf stage and quantified using a NanoDrop spectrophotometer (NanoDrop 8000, Thermo Fisher Scientific) according to the manufacturer’s instructions. The final concentration was adjusted to 100 ng/uL for PCR application.
SNP genotyping and marker development
Forty-eight F2s (24 each for wild type and stripped) and parental lines were first genotyped with a barley 50 k iSelect SNP Array [43]. Marker positions are based on the barley pseudo-molecule assembly of Morex V1 [44]. Genotype calling was performed with the de novo calling algorithm in GenomeStudio (Illumina). Clusters of polymorphic SNPs were inspected and manually adjusted if necessary. The linked SNPs were used to develop semi-thermal asymmetric reverse PCR (STARP) markers to genotype the F2 population [45]. PCR was conducted in a 10 μl reaction volume with Taq DNA polymerase (New England Biolab) according to the manufacturer’s instructions. Sequences of priming element-adjustable primer (PEA-primer) 1 and 2 are 5′-AGCTGGTT-SP9-GCAACAGGAACCAGCTATGAC-3′ and 5′-ACTGCTCAAGAG-SP9-GACGCAAGTGAGCAGTATGAC-3′, respectively [45]. The thermal amplification program followed a touchdown protocol as described previously [45, 46]. Stained with GelRed™ nucleic acid stain (MilliporeSigma), amplicons were analyzed with 6% polyacrylamide gel which was imaged using a Typhoon™ FLA 9500 variable mode laser scanner (GE Healthcare Life Sciences, Marlborough, MA). The markers used in the present study are listed in Table 1.
Physical mapping and gene prediction
The genome sequences of barley cv Morex v2 and Golden Promise v1 were used for marker localization and physical mapping [27, 47, 48]. Gene predication and annotation was conducted with the programs of FGENESH and Pfam 32.0, respectively [49, 50]. Gene annotation was also confirmed with the BLASTP program.
Gene expression analysis
Gene expression analysis was conducted with semi-quantitative reverse transcription (RT)-PCR and quantitative real-time PCR (qRT-PCR). RNA isolated from leaves of booting plants was used for gene analysis and cDNA sequencing. RNA was extracted using the NucleoSpin RNA Plant kit (Macherey-Nagel, Düren, Germany). First-strand cDNA was synthesized using M-MLV Reverse Transcriptase (Invitrogen). The PCR amplification was conducted in a 20 μl reactions containing 2 μl cDNA (equivalent to 50 ng of total RNA), 2 μl of each gene-specific primer (2.5 μM), 10 μl of water, 0.5 unit Taq DNA Polymerase (New England Biolabs), 2 μl dNTPs (2.5 μM) and 2 μl of 10 x Standard Taq reaction buffer (New England Biolabs). The actin gene was used as a control. PCR primers were as follows: HvActin, 5′-GAGCACGGTATCGTAAGCAACTG-3′ and 5′-CCTGTTCATAATCAAGGGCAACG-3′; HORVU.MOREX.r2.2HG0177270, F1: 5′-CCAGCTCCAGAGGTGGCTGT-3′, R1: 5′- CAGCGCTCTAGCACGGAGGT-3′.
Fluorescent qRT-PCR was performed with three replications using the 7500 Fast Real-Time PCR system (Applied Biosystems, Grand Island, NY, USA). Amplification was conducted in a 10 μl reaction volume containing 2 μL cDNA (equivalent to 50 ng of total RNA), 1.5 μL of each gene-specific primer (2.5 μM), and 5 μL of SYBR Select Master Mix (Applied Biosystems). The actin gene was used as the internal control for real-time analysis and was amplified with primers 5′-AACTATGTTCCCAGGTATCGC-3′ and 5′-GACTCGTCGTACTCATCCTTG-3′. Primers 5′-GAAACTACCAGCTCCAGAGG-3′ and 5′-GCGTTTGACATGCCTTCATC-3′ were used to target Gpa1 gene expression. Amplification conditions used were the same as described previously [51].
Chlorophyll measurement
Chlorophyll contents were measured by spectrophotometric determination with 4 replications [52]. Briefly, 0.2 g fresh leaf tissue of wild type and mutant plants at booting stage was collected and soaked in 5 ml of 95% ethanol in the dark for 48 h. After 5 min of centrifugation at 3000 rpm, the residual plant debris was removed. Supernatant was measured with a spectrophotometer (Beckman DU 7400) at 663 nm for chlorophyll a and 645 nm for chlorophyll b.
Fusion primer and nested integrated PCR (FPNI-PCR)
FPNI-PCR was performed for chromosome walking to identify the unknown genomic region [53]. Gene-specific primers used for primary, secondary and tertiary PCR respectively are, GSP1, 5′-CTGCACTCAATAGGCAGGGTGT-3′; GSP2, 5′-ACCGAGTCGCAACCAGCCTT-3′; and GSP3, 5′-TTGCCACCCAACGCCTGACA-3′. Nine fusion arbitrary degenerate primers (FP1–9) and FP-specific primers (FSP1 and FSP2) were designed according to Wang et al. (2011). LA Taq (Takara Bio USA Inc., Mountain View, CA) was used in the first round of PCR. The 20 μl reactions consisted of 10 μM FP primer and 2 μM GSP1 with all other reagent concentrations following the recommended LA Taq protocol. The primary round of PCR in the FPNI-PCR procedure includes high stringency PCR cycles (94 °C for 10 s, 62 °C for 30 s, 72 °C for 2 m, repeated two times), followed by one low stringency PCR cycle (94 °C for 15 s, 25 °C for 1 min, 28 °C ramping up 0.2C/sec for 3 min, and 72 °C 2:30 min). This high and low stringency cycle pattern was repeated six times. The primary round of PCR was finished with another two high stringency cycles followed by one cycle of 94 °C for 10 s, 44 °C for 30 s, 72 °C for 2 min, and a final extension with 72 °C for 5 min. The PCR product was diluted to one half and used as template for the next round of PCR. Phusion Hot Start Flex Polymerase (NEB, Ipswich, MA) was used for both secondary and tertiary rounds of PCR in 20 μl reactions containing 10 μM of FSP primer, 2 μM of GSP primer and all other reagents with the recommended concentrations by the manufacturer’s protocol. A 1/40 dilution of the secondary round PCR product was used as template for the tertiary round of PCR. Samples were visualized on 1% agarose gel stained with ethidium bromide under UV illumination, and amplified bands were extracted and purified using a QIAquick Gel Extraction Kit (Qiagen, Hilden, Germany) for sequencing.
Transmission electron microscopy analysis
Leaf samples collected from Bowman and BW397 plants at the booting stage were fixed with 2.5% glutaraldehyde in 0.1 M sodium phosphate buffer, pH 7.35 (Tousimis Research Corporation, Rockville, MD) at 4 °C. Sample pretreatment and section preparation followed the protocol described in [54]. Stained with lead citrate for two minutes, dried sections on copper grids were visualized on a JEOL JEM-100CX II electron microscope (JEOL Inc., Peabody, MA).
Availability of data and materials
All data generated or analyzed during this study are included in this published article and its supplementary information files. Sequence data from this article can be found at figshare with the digital object identifier (DOI) https://doi.org/10.6084/m9.figshare.14153465.v1.
Abbreviations
- gpa1 :
-
grandpa 1
- im :
-
immutans
- var2 :
-
variegated 2
- PTOX:
-
Plastid terminal oxidase
- AOX:
-
Alternative oxidase
- FtsH2 :
-
Filamentous temperature-sensitive H2
- Crr2–2:
-
Chlororespiratory Reduction 2–2
- PGR5:
-
Proton Gradient Regulation 5
- PPR:
-
Pentatricopeptide repeat
- SVR:
-
Suppressor of Variegation
- FUG1:
-
Fu-gaeri1
- SCO1:
-
Snow Cotyledon 1
- TEM:
-
Transmission electron microscopy
- STARP:
-
Semi-thermal asymmetric reverse PCR
- FPNI-PCR :
-
Fusion primer and nested integrated PCR
- FP:
-
Fusion arbitrary degenerate primer
- FSP:
-
FP-specific primers
- NPGS:
-
National Plant Germplasm System
References
Kretschmer M, Damoo D, Djamei A, Kronstad J. Chloroplasts and plant immunity: where are the fungal effectors? Pathogens. 2019;9(1):19.
Serrano I, Audran C, Rivas S. Chloroplasts at work during plant innate immunity. J Exp Bot. 2016;67(13):3845–54.
Toufexi A, Duggan C, Pandey P, Savage Z, Segretin ME, Yuen LH, Gaboriau DCA, Leary AY, Khandare V, Ward AD, et al. Chloroplasts navigate towards the pathogen interface to counteract infection by the Irish potato famine pathogen. bioRxiv. 2019;10:1101.
Nott A, Jung HS, Koussevitzky S, Chory J. Plastid-to-nucleus retrograde signaling. Annu Rev Plant Biol. 2006;57:739–59.
Jung HS, Chory J. Signaling between chloroplasts and the nucleus: can a systems biology approach bring clarity to a complex and highly regulated pathway? Plant Physiol. 2010;152(2):453–9.
Li HM, Chiu CC. Protein transport into chloroplasts. Annu Rev Plant Biol. 2010;61:157–80.
Yu F, Fu A, Aluru M, Park S, Xu Y, Liu H, Liu X, Foudree A, Nambogga M, Rodermel S. Variegation mutants and mechanisms of chloroplast biogenesis. Plant Cell Environ. 2007;30(3):350–65.
Wu D, Wright DA, Wetzel C, Voytas DF, Rodermel S. The IMMUTANS variegation locus of Arabidopsis defines a mitochondrial alternative oxidase homolog that functions during early chloroplast biogenesis. Plant Cell. 1999;11(1):43–55.
Carol P, Stevenson D, Bisanz C, Breitenbach J, Sandmann G, Mache R, Coupland G, Kuntz M. Mutations in the Arabidopsis gene IMMUTANS cause a variegated phenotype by inactivating a chloroplast terminal oxidase associated with phytoene desaturation. Plant Cell. 1999;11(1):57–68.
Foudree A, Putarjunan A, Kambakam S, Nolan T, Fussell J, Pogorelko G, Rodermel S. The mechanism of variegation in immutans provides insight into chloroplast biogenesis. Front Plant Sci. 2012;3:260.
Suzuki CK, Rep M, van Dijl JM, Suda K, Grivell LA, Schatz G. ATP-dependent proteases that also chaperone protein biogenesis. Trends Biochem Sci. 1997;22(4):118–23.
Takechi K, Sodmergen MM, Motoyoshi F, Sakamoto W. The YELLOW VARIEGATED (VAR2) locus encodes a homologue of FtsH, an ATP-dependent protease in Arabidopsis. Plant Cell Physiol. 2000;41(12):1334–46.
Chen M, Choi Y, Voytas DF, Rodermel S. Mutations in the Arabidopsis VAR2 locus cause leaf variegation due to the loss of a chloroplast FtsH protease. Plant J. 2000;22(4):303–13.
Zhang D, Kato Y, Zhang L, Fujimoto M, Tsutsumi N, Sodmergen SW. The FtsH protease heterocomplex in Arabidopsis: dispensability of type-B protease activity for proper chloroplast development. Plant Cell. 2010;22(11):3710–25.
Kato Y, Miura E, Ido K, Ifuku K, Sakamoto W. The variegated mutants lacking chloroplastic FtsHs are defective in D1 degradation and accumulate reactive oxygen species. Plant Physiol. 2009;151(4):1790–801.
Wang L, Kim C, Xu X, Piskurewicz U, Dogra V, Singh S, Mahler H, Apel K. Singlet oxygen- and EXECUTER1-mediated signaling is initiated in grana margins and depends on the protease FtsH2. Proc Natl Acad Sci U S A. 2016;113(26):E3792–800.
Sakamoto W, Zaltsman A, Adam Z, Takahashi Y. Coordinated regulation and complex formation of yellow variegated1 and yellow variegated2, chloroplastic FtsH metalloproteases involved in the repair cycle of photosystem II in Arabidopsis thylakoid membranes. Plant Cell. 2003;15(12):2843–55.
Okegawa Y, Kobayashi Y, Shikanai T. Physiological links among alternative electron transport pathways that reduce and oxidize plastoquinone in Arabidopsis. Plant J. 2010;63(3):458–68.
Liu X, Yu F, Rodermel S. An Arabidopsis pentatricopeptide repeat protein, SUPPRESSOR OF VARIEGATION7, is required for FtsH-mediated chloroplast biogenesis. Plant Physiol. 2010;154(4):1588–601.
Druka A, Franckowiak J, Lundqvist U, Bonar N, Alexander J, Houston K, Radovic S, Shahinnia F, Vendramin V, Morgante M, et al. Genetic dissection of barley morphology and development. Plant Physiol. 2011;155(2):617–27.
Li M, Hensel G, Mascher M, Melzer M, Budhagatapalli N, Rutten T, Himmelbach A, Beier S, Korzun V, Kumlehn J, et al. Leaf variegation and impaired chloroplast development caused by a truncated CCT domain gene in albostrians barley. Plant Cell. 2019;31(7):1430–45.
Ehrenberg L, Gustafsson A, Lundquist U. Viable mutants induced in barley by ionizing radiations and chemical mutagens. Hereditas. 1961;47:243–82.
Matchett RW, Pollock BM, Robertson DW. The "grandpa" gene: a chlorophyll mutation in Hordeum species. J Hered. 1968;59:279–82.
Immer FR, Henderson MT. Linkage studies in barley. Genetics. 1943;28(5):419–40.
Matchett RW, Nass HG, Robertson DW. Inheritance and linkage studies with the grandpa gene in barley, Hordeum vulgare L. Can J Genet Cytol. 1971;13:489–98.
Muñoz-Amatriaín M, Moscou MJ, Bhat PR, Svensson JT, Bartoš J, Suchánková P, Šimková H, Endo TR, Fenton RD, Lonardi S, et al. An improved consensus linkage map of barley based on flow-sorted chromosomes and single nucleotide polymorphism markers. The Plant Genome. 2011;4(3):238–49.
Beier S, Himmelbach A, Colmsee C, Zhang XQ, Barrero RA, Zhang Q, Li L, Bayer M, Bolser D, Taudien S, et al. Construction of a map-based reference genome sequence for barley, Hordeum vulgare L. Sci Data. 2017;4:170044.
Hohner R, Pribil M, Herbstova M, Lopez LS, Kunz HH, Li M, Wood M, Svoboda V, Puthiyaveetil S, Leister D, et al. Plastocyanin is the long-range electron carrier between photosystem II and photosystem I in plants. Proc Natl Acad Sci U S A. 2020;117(26):15354–62.
Pfalz J, Pfannschmidt T. Essential nucleoid proteins in early chloroplast development. Trends Plant Sci. 2013;18(4):186–94.
Cera A, Holganza MK, Hardan AA, Gamarra I, Eldabagh RS, Deschaine M, Elkamhawy S, Sisso EM, Foley JJt, Arnone JT. Functionally related genes cluster into genomic regions that coordinate transcription at a distance in Saccharomyces cerevisiae. mSphere. 2019;4(2):e00063–19.
Hen-Avivi S, Savin O, Racovita RC, Lee WS, Adamski NM, Malitsky S, Almekias-Siegl E, Levy M, Vautrin S, Berges H, et al. A metabolic gene cluster in the wheat W1 and the barley Cer-cqu loci determines beta-diketone biosynthesis and glaucousness. Plant Cell. 2016;28(6):1440–60.
Nutzmann HW, Scazzocchio C, Osbourn A. Metabolic gene clusters in eukaryotes. Annu Rev Genet. 2018;52:159–83.
Ben-Shahar Y, Nannapaneni K, Casavant TL, Scheetz TE, Welsh MJ. Eukaryotic operon-like transcription of functionally related genes in Drosophila. Proc Natl Acad Sci U S A. 2007;104(1):222–7.
Blumenthal T. Operons in eukaryotes. Brief Funct Genomic Proteomic. 2004;3(3):199–211.
Kominek J, Doering DT, Opulente DA, Shen XX, Zhou X, DeVirgilio J, Hulfachor AB, Groenewald M, McGee MA, Karlen SD, et al. Eukaryotic acquisition of a bacterial operon. Cell. 2019;176(6):1356–66 e1310.
Josse EM, Simkin AJ, Gaffe J, Laboure AM, Kuntz M, Carol P. A plastid terminal oxidase associated with carotenoid desaturation during chromoplast differentiation. Plant Physiol. 2000;123(4):1427–36.
Kambakam S, Bhattacharjee U, Petrich J, Rodermel S. PTOX mediates novel pathways of electron transport in etioplasts of Arabidopsis. Mol Plant. 2016;9(9):1240–59.
Peng L, Shimizu H, Shikanai T. The chloroplast NAD(P) H dehydrogenase complex interacts with photosystem I in Arabidopsis. J Biol Chem. 2008;283(50):34873–9.
Peltier G, Cournac L. Chlororespiration. Annu Rev Plant Biol. 2002;53:523–50.
Rumeau D, Peltier G, Cournac L. Chlororespiration and cyclic electron flow around PSI during photosynthesis and plant stress response. Plant Cell Environ. 2007;30(9):1041–51.
Pfannschmidt T, Brautigam K, Wagner R, Dietzel L, Schroter Y, Steiner S, Nykytenko A. Potential regulation of gene expression in photosynthetic cells by redox and energy state: approaches towards better understanding. Ann Bot. 2009;103(4):599–607.
Murray MG, Thompson WF. Rapid isolation of high molecular weight plant DNA. Nucleic Acids Res. 1980;8(19):4321–5.
Bayer MM, Rapazote-Flores P, Ganal M, Hedley PE, Macaulay M, Plieske J, Ramsay L, Russell J, Shaw PD, Thomas W, et al. Development and evaluation of a barley 50k iSelect SNP array. Front Plant Sci. 2017;8:1792.
Mascher M, Gundlach H, Himmelbach A, Beier S, Twardziok SO, Wicker T, Radchuk V, Dockter C, Hedley PE, Russell J, et al. A chromosome conformation capture ordered sequence of the barley genome. Nature. 2017;544(7651):427–33.
Long YM, Chao WS, Ma GJ, Xu SS, Qi LL. An innovative SNP genotyping method adapting to multiple platforms and throughputs. Theor Appl Genet. 2017;130(3):597–607.
Faris JD, Overlander ME, Kariyawasam GK, Carter A, Xu SS, Liu Z. Identification of a major dominant gene for race-nonspecific tan spot resistance in wild emmer wheat. Theor Appl Genet. 2020;133(3):829–41.
Mascher M: Pseudomolecules and annotation of the second version of the reference genome sequence assembly of barley cv. Morex [Morex V2]. e!DAL - Plant Genomics and Phenomics Research Data Repository (PGP), IPK Gatersleben, Seeland OT Gatersleben, Corrensstraße 3, 06466, Germany 2019.
Schreiber M, Mascher M, Wright J, Padmarasu S, Himmelbach A, Heavens D, Milne L, Clavijo BJ, Stein N, Waugh R. A genome assembly of the barley 'transformation reference' cultivar golden promise. G3 (Bethesda). 2020;10(6):1823–7.
Bateman A, Coin L, Durbin R, Finn RD, Hollich V, Griffiths-Jones S, Khanna A, Marshall M, Moxon S, Sonnhammer EL, et al. The Pfam protein families database. Nucleic Acids Res. 2004;32(Database issue):D138–41.
Solovyev V, Salamov A. The gene-finder computer tools for analysis of human and model organisms genome sequences. Proc Int Conf Intell Syst Mol Biol. 1997;5:294–302.
Yu X, Qin Q, Wu X, Li D, Yang S. Genetic and physical localization of the gene controlling leaf pigmentation pattern in Medicago truncatula. G3 (Bethesda). 2020;10(11):4159–65.
Arnon DI. Copper enzymes in isolated chloroplasts. Polyphenoloxidase in Beta Vulgaris. Plant Physiol. 1949;24(1):1–15.
Wang Z, Ye S, Li J, Zheng B, Bao M, Ning G. Fusion primer and nested integrated PCR (FPNI-PCR): a new high-efficiency strategy for rapid chromosome walking or flanking sequence cloning. BMC Biotechnol. 2011;11:109.
Rajamohan A, Rinehart JP, Foster SP, Leopold RA. Permeability barriers to embryo cryopreservation of Pectinophora gossypiella (Lepidoptera: Gelechiidae). J Econ Entomol. 2013;106(2):855–61.
Acknowledgments
The authors thank Xiaohong (Sherry) Jiang and Madison Skadberg for technical assistance, the NDSU Electron Microscopy Center Core Facility for the help on TEM analysis, and USDA-ARS NPGS for providing the seeds of Bowman, BW397, Morex, Lyallpur and GSHO519.`
Funding
This research was funded by the US Department of Agriculture–Agriculture Research Service (USDA-ARS) Current Research Information System (CRIS) Project 3060–21000-038-00D. The funders had no role in the experiment design, data analysis, or preparation of the manuscript.
Author information
Authors and Affiliations
Contributions
SY designed the experiments. SY and MO constructed the populations. MO, and JF performed the marker assay. SY, MO, and JF analyzed the data. SY wrote the first draft of the manuscript, and all authors commented on previous versions of the manuscript. All authors read and approved the final manuscript.
Corresponding author
Ethics declarations
Ethics approval and consent to participate
Not applicable.
Consent for publication
Not applicable.
Competing interests
The authors declare that they have no competing interests.
Additional information
Publisher’s Note
Springer Nature remains neutral with regard to jurisdictional claims in published maps and institutional affiliations.
Supplementary Information
Additional file 1: Figure 1
Phenotypic comparison between Bowman and BW397. The BW397 mutant produces white anthers (A), spike, awns and flag leaf (B). Figure 2 Gene prediction with the genomic sequence of G11.One PPR protein and DNA gyrase were predicated in sense and antisense strand, respectively. Exons were indicated with rectangles, and straight lines for introns. E, exon; I, intron. The gene structures are drawn to scale. Figure 3 The original gel image cropped for Fig. 4band c. Samples were arranged in the following order (from left to right): Bowman, BW397, Lyallpur and GSHO519. The full-length coding region (F2 + R1, shown in Fig. 4b) and the putative promoter (F4 + R2, shown in Fig. 4c) could not be amplified in mutants, but half of the coding sequence at the 3′ was successfully obtained with primers F3 and R1 (Fig. 4b) in all genotypes. A length polymorphism of 35 bp was detected between promoters (F4 + R2) of Bowman and Lyallpur, which was confirmed by sequencing. A genomic region at 2.5 kb upstream of the start codon (F5 and R3, shown in Fig. 4c) were not amplified in mutants, either. The cropped areas were indicated with white dashed rectangles. Figure 4 The original gel image of RT-PCR cropped for Fig. 4d. RT-PCR analysis with 25, 28 and 30 PCR cycles failed to detect the expression of Hvptox in mutants. Actin was used as the internal control. Samples were arranged in the following order (from left to right): Bowman, BW397, Lyallpur and GSHO519. The cropped areas were indicated with white dashed rectangles. Figure 5 Quantitative real-time PCR (qRT-PCR) analysis of Gpa1 alleles.
Additional file 2: Table 1
SNP genotyping of 31 F2s and their parental lines with the barley 50 k iSelect SNP Array. G-1 to G-16 are F2s with normal phenotype, and g-1 to g-15 are variagated F2s. Genotypes for called SNPs were converted to the codes of pink “A”, green “B”, yellow “H” and blank “-”. The WT paent Bowman confers the pink ‘A’ genotype, “B” for the mutant BW397, “H” for heterozygous, and missing data as “-”. The flankeding SNPs, JHI-Hv50k-2016-139,629 and JHI-Hv50k-2016-142,540, were highlighted in yellow. Table 2. Primers used for the analysis of HvPTOX alleles.
Rights and permissions
Open Access This article is licensed under a Creative Commons Attribution 4.0 International License, which permits use, sharing, adaptation, distribution and reproduction in any medium or format, as long as you give appropriate credit to the original author(s) and the source, provide a link to the Creative Commons licence, and indicate if changes were made. The images or other third party material in this article are included in the article's Creative Commons licence, unless indicated otherwise in a credit line to the material. If material is not included in the article's Creative Commons licence and your intended use is not permitted by statutory regulation or exceeds the permitted use, you will need to obtain permission directly from the copyright holder. To view a copy of this licence, visit http://creativecommons.org/licenses/by/4.0/. The Creative Commons Public Domain Dedication waiver (http://creativecommons.org/publicdomain/zero/1.0/) applies to the data made available in this article, unless otherwise stated in a credit line to the data.
About this article

Cite this article
Yang, S., Overlander, M. & Fiedler, J. Genetic analysis of the barley variegation mutant, grandpa1.a. BMC Plant Biol 21, 134 (2021). https://doi.org/10.1186/s12870-021-02915-9
Received:
Accepted:
Published:
DOI: https://doi.org/10.1186/s12870-021-02915-9