
Abstract
Background
Plant cell walls participate in all plant-environment interactions. Maintaining cell wall integrity (CWI) during these interactions is essential. This realization led to increased interest in CWI and resulted in knowledge regarding early perception and signalling mechanisms active during CWI maintenance. By contrast, knowledge regarding processes mediating changes in cell wall metabolism upon CWI impairment is very limited.
Results
To identify genes involved and to investigate their contributions to the processes we selected 23 genes with altered expression in response to CWI impairment and characterized the impact of T-DNA insertions in these genes on cell wall composition using Fourier-Transform Infrared Spectroscopy (FTIR) in Arabidopsis thaliana seedlings. Insertions in 14 genes led to cell wall phenotypes detectable by FTIR. A detailed analysis of four genes found that their altered expression upon CWI impairment is dependent on THE1 activity, a key component of CWI maintenance. Phenotypic characterizations of insertion lines suggest that the four genes are required for particular aspects of CWI maintenance, cell wall composition or resistance to Plectosphaerella cucumerina infection in adult plants.
Conclusion
Taken together, the results implicate the genes in responses to CWI impairment, cell wall metabolism and/or pathogen defence, thus identifying new molecular components and processes relevant for CWI maintenance.
Background
Plant cell walls are involved in all interactions between plants and their environment. Examples include pathogen infection or exposure to drought, where wall composition and structure change to prevent water loss, pathogen susceptibility or at least limit further pathogen spread [1, 2]. These changes of the walls are exemplified by reinforcement with Callose during infection or modifications of pectic polysaccharides to prevent water loss during exposure to drought stress [3, 4]. Cell walls are extremely plastic, undergoing dynamic changes to enable plant cells to expand and differentiate during growth and development [5]. Controlled deposition of cellulose microfibrils through interactions between cellulose synthases and microtubules during cell expansion exemplify the changes in cell wall organization, permitting tightly controlled cell expansion [6, 7]. Deposition of suberin and lignin during formation of the Casparian strip in pericycle cells of the primary root exemplifies modifications of cell walls during cell differentiation [8,9,10]. These examples illustrate processes active during plant-environment interactions and development, enabling cell walls to fulfill their respective biological functions.
How do cell walls perform these various functions, which sometimes involve opposite performance requirements, while simultaneously maintaining their functional integrity? The available evidence supports the existence of a dedicated mechanism, which is monitoring the functional integrity of the plant cell wall and initiates adaptive changes in cellular and cell wall metabolism to maintain cell wall integrity (CWI) [11,12,13,14,15]. Studies of the mode of action of the CWI maintenance mechanism often investigate the responses to cell wall damage (CWD), which can be generated by cell wall degrading enzymes (cellulase, pectinase etc.) or compounds like isoxaben (ISX) [16]. ISX inhibits specifically cellulose production during primary cell wall formation in elongating plant cells [17,18,19]. Established responses to CWD include growth inhibition involving cell cycle arrest, changes in the levels of phytohormones like jasmonic acid (JA), salicylic acid (SA) and cytokinins (CKs) as well as changes in cell wall composition involving pectic polysaccharides, lignin and Callose deposition [20,21,22,23,24].
The available evidence implicates receptor-like kinases (RLK) like MALE DISCOVERER 1-INTERACTING RECEPTOR LIKE KINASE 2 (MIK2), FEI1, FEI2, THESEUS 1 (THE1) and FERONIA (FER) in CWI maintenance [16, 25,26,27,28]. THE1 and FER belong to the Catharanthus roseus RLK1-like kinase (CrRLK1L) family, which has 17 members. These RLKs consist of an intracellular Serine / Threonine-kinase domain, a transmembrane domain and an extracellular domain exhibiting similarity to the malectin domain originally identified in Xenopus laevis [29]. Currently it is not clear if malectin domains in CrRLK1Ls are either required for binding to cell wall epitopes, mediate protein-protein interaction or actually do both [28, 30,31,32,33,34,35]. FER is required during gametophytic and root hair development, salt stress, JA signaling and coordination between abscisic acid- (ABA) and JA-based signaling processes [28, 36,37,38,39,40,41,42]. MIK2 and THE1 are required for root development, CWD-induced lignin and phytohormone production as well as resistance to the root pathogen Fusarium oxysporum [16, 25, 27, 33]. FEI1 and FEI2 have been originally identified through their impact on seedling root growth on medium containing 4.5% sucrose and subsequently implicated in a cell wall signaling pathway involving the SALT OVERLY SENSITIVE5 (SOS5) and FEI2 [43,44,45]. In parallel, ion-channels, like MID1-COMPLEMENTING ACTIVITY 1 (MCA1) and MECHANOSENSITIVE CHANNEL OF SMALL CONDUCTANCE-LIKE 2 (MSL2) and 3 (MSL3) were shown to contribute to activation of CWD-induced responses in plants [16, 23]. MCA1 was originally identified through its´ ability to partially complement a MID1/CCH1- deficient Saccharomyces cerevisiae strain [46]. In yeast MID1/CCH1 form a plasma membrane-localized stretch-activated calcium channel required both for mechano-perception and CWI maintenance (Levin, 2011). CWD-induced responses in plants (like in yeast cells) seem also to be sensitive to turgor manipulation [11, 47]. The reason being that in Arabidopsis thaliana seedlings, exposed simultaneously to ISX and mild hyperosmotic conditions, most of the CWD-induced responses are suppressed in a concentration dependent manner [16, 48]. The early signals generated seem to be conveyed to downstream response mediators through changes in production of reactive oxygen species (ROS) and phytohormones (JA/SA/CKs) [23, 24]. Enzymes implicated in ROS production upon CWI impairment are NADPH-oxidases like RESPIRATORY BURST OXIDASE HOMOLOGUE (RBOH) D/F (after ISX-treatment) or RBOH H/J during pollen tube development [49]. NADPH-oxidase activity in turn can be regulated via calcium binding, differential phosphorylation involving kinases controlled by changes in calcium levels (CALCINEURIN INTERACTING KINASE 26, CIPK26), activated in response to pathogen infection through phosphorylation involving BOTRYTIS INDUCED KINASE 1 (BIK1) or controlled via RHO GTPases, a ROPGEF and FER [37, 50, 51].
This abbreviated overview of molecular components active during plant CWI maintenance illustrates the increase in knowledge regarding putative CWI sensors and early signal transduction elements in recent years. Whilst it is fascinating to know about early CWD perception and signaling processes we also need to understand how signals generated lead to changes in cell wall composition and structure to dissect the mode of action of the CWI maintenance mechanism thoroughly. This is of particular interest in the context of targeted modification of biomass quality and improvement of food crop performance since the CWI maintenance mechanism seems to be an important component of cell wall plasticity [52, 53]. Cell wall plasticity in turn has been discussed as the root cause for the apparently limited success of efforts aimed at optimizing biomass quality that have been achieved so far [52].
We wanted to identify additional components and molecular processes, which are mediating responses to CWD and adaptive changes in cell wall metabolism. To achieve these aims we selected candidate genes using microarray-based expression profiling data deriving from ISX-treated Arabidopsis seedlings. FTIR spectroscopy was then used to identify candidate genes where insertions lead to cell wall changes on the seedling level. We performed in depth studies for four genes to validate the approach. These studies involved confirming that gene expression is responsive to ISX, determining if expression is controlled by THE1 and investigating how loss-of-function alleles for these genes affect cell wall composition in adult plants, resistance to the necrotrophic pathogen Plectosphaerella cucumerina and responses to ISX-induced CWD impairing CWI.
Results
Identification of candidate genes
Previously, we have performed time course experiments to characterize the response of Arabidopsis seedlings to ISX-induced CWD [48]. Affymetrix ATH1 microarrays were used to detect changes in transcript levels up to 36 h after start of ISX treatment. The phenotypic characterization of seedlings detected lignin deposition in root tips and enhanced JA production after 4–6 h of ISX-treatment [48]. Based on these results we hypothesized that genes exhibiting transcriptional changes after 4 h might be involved in CWD responses (phytohormone and lignin production) as well as cell wall modifying processes in general. Analysis of the microarray derived expression data suggested that the transcript levels of several hundred genes change after 4 h of exposure to ISX. We used public expression data (www.genevestigator.com) to identify genes exhibiting differential expression after 4 h of ISX treatment and elevated expression in tissue types where cell wall modification or production occurs preferentially (primary root elongation zone and expanding hypocotyl). To determine whether these candidates are involved in cell wall related processes, we decided to perform a pilot study characterizing the phenotypes of T-DNA insertion lines for 23 candidate genes. Supporting information Table 1 (Additional file 1: Table S1) lists the 23 candidate genes with their database annotations, the probe sets representing the genes on the Affymetrix ATH1 microarray and insertion lines used for characterization. Table S2 summarizes the microarray-derived expression data for the 23 candidate genes generated in the original time course expression profiling experiments. Additional file 1: Figure S1 illustrates the putative transcript levels of the candidate genes in different tissues / organs using the Genevestigator database. The Genevestigator-derived expression data suggest that several candidate genes are involved in cellular and biological processes, which affect or involve plant cell wall metabolism.
FTIR-based analysis detects cell wall phenotypes in mutant seedlings
Performing detailed cell wall analysis for insertion lines in 23 candidate genes would be time consuming and possibly not very efficient. Previously, FTIR has been successfully used as an efficient approach to classify Arabidopsis mutants with altered cell wall architecture [58]. We used this approach as foundation to facilitate identification of insertions in candidate genes leading to changes in cell wall composition or structure in Arabidopsis seedlings. FTIR spectra were collected for analysis from total cell wall material derived from 6 days-old, liquid culture grown Col-0 seedlings or seedlings with T-DNA insertions in the candidate genes. Initially only Col-0 samples were characterized to establish the variability observed in controls. Subsequently, twice the standard deviation of the Col-0 variability was used as a cut-off to identify insertions in candidate genes causing significant changes in the FTIR spectra. Based on this criterium FTIR spectra for 17 of the 23 insertion lines analyzed seemed to exhibit significant differences (Additional file 1: Figure S2). Pronounced differences were observed for seedlings with insertions in At5g24140 (SQUALENE MONOOXYGENASE2, SQP2, [59]) and At5g49360 (BETA-XYLOSIDASE1, ATBXL1, [60]), At1g07260 (UGT71C3, [61]), At1g74440 [62], At2g35730 [55, 63], At3g13650 (DIRIGENT PROTEIN 7, DIR7, [54]) and At4g33300 (ACTIVATED DISEASE RESISTANCE-LIKE 1, ADR1-L1, [64]) in the 1740–1600 cm− 1 and 1200–950 cm− 1 areas (Additional file 1: Figure S2a). These are supposedly characteristic for cellulose, elements of pectic polysaccharides (including alkyl esters in pectin as well as other esters, [59, 60, 65, 66] 2015). Insertion lines for At2g41820 (PHLOEM INTERCALATED WITH XYLEM / TRACHEARY ELEMENT DIFFERENTIATION INHIBITORY FACTOR RECEPTOR-CORRELATED 3, PXC3, [57]), At3g11340 (UDP GLYCOSYLTRANSFERASE 76B1, UGT76B1, [67]), At4g33420 (PEROXIDASE 47, PRX47, [68]), At4g35630 (PHOSPHOSERINE AMINO-TRANSFERASE 1, PSAT 1, [69]), At5g48460 (FIMBRIN 2, ATFIM2, [70]), At5g47730 (SEC14-HOMOLOGUE 19, SFH19, [56, 71]), At5g65390 (ARABINOGALACTAN PROTEIN 7, AGP7, [72]), At3g16560, At2g02950 (PHYTOCHROME KINASE SUBSTRATE1, PKS1) [73], At2g13790 (SOMATIC EMBRYOGENESIS RECEPTOR KINASE 4, SERK4) [74], exhibited apparent differences in the 1367–1200 cm− 1 area supposedly characteristic for C-H vibrations and CH2-bending in cellulose and hemicelluloses as well as bending of O-H groups in pyranose rings of pectins (Additional file 1: Figure S2b, [66]). The FTIR spectra for the other lines examined did not exhibit differences to Col-0 controls (Additional file 1: Figure S2c). The results from the FTIR-based analysis of the insertion lines suggested that cell wall composition or structure could be affected in seedlings with insertions for 17 of the 23 candidate genes examined. The insertions seemed to have distinct effects on cell wall composition / structure based on their apparent separation into three groups.
Four candidate genes are selected for more detailed characterization
We selected four candidate genes for a more detailed analysis (At3g13650, At2g35730, At5g47730 and At2g41820, Table 1) because of the limited knowledge available regarding their biological functions and the four insertions leading to two qualitatively different FTIR phenotypes. This enabled us to determine also if insertion lines resulting in similar FTIR cell wall phenotypes on the seedling level exhibit similar cell wall phenotypes on the adult plant level. While At3g13650 and At2g35730 FTIR-spectra (orange, yellow) seemed to deviate from Col-0 controls mainly in areas characteristic for cellulose and certain types of pectins, At5g47730 and At2g41820 spectra (green, blue) deviated mainly in areas characteristic for cellulose elements, hemicelluloses and pectins (Fig. 1, numbers highlight wavenumbers diagnostic for certain bands in the spectra according to [66]). These four genes were classified as WALL STRESS RESPONSE genes or WSRs. At3g13650 (WSR1, DIR7) belongs to a family of disease resistance responsive proteins, which have been implicated in lignan biosynthesis and formation of the casparian strip [10, 54]. Analysis of the available data suggests that At2g35730 (WSR2) is expressed in the female gametophyte and encodes a heavy metal transport / detoxification superfamily protein [55, 63]. Protein homology suggests that At5g47730 (WSR3, SFH19) is related to SEC14 proteins from S. cerevisiae, which have been implicated in polarized vesicle transport [71]. At2g41820 (WSR4, PXC3) encodes a putative leucine-rich repeat receptor kinase, belonging to a family where other members have been implicated in organization of secondary vascular tissue [57].

Overview of average FTIR spectra from Col-0, wsr1–1, wsr2–1, wsr3–1 and wsr4–1 seedlings. The grey dotted line represents the average spectrum of Col-0 (grey y-axis label). The different colored lines for wsr1–1 (orange), wsr2–1 (yellow), wsr3–1 (green) and wsr4–1 (blue) show the difference spectra obtained by subtraction of respective mutant average spectra from the Col-0 average spectrum (black y-axis label). Black lines indicate 2 x SD for Col-0 derived material. Numbers in red indicate bands in the infrared spectra of plant cell wall material acting as indicators for certain classes of cell wall polysaccharides. For comparison with the full set of mutants see Additional file 1: Figure S2
Quantitative gene expression analysis confirms transcriptomics results and suggests THE1 is controlling WSR gene expression
DNA microarray-based expression analysis of Arabidopsis seedlings suggested that the transcript levels of the WSR genes are changing in response to ISX treatment (Table S2). To confirm this, we performed time course experiments and transcript levels of the four genes were determined through quantitative reverse transcription – polymerase chain reaction (qRT - PCR) in mock- or ISX-treated seedlings. The transcript levels of WSR1, 2 and 3 increased after 4 h of ISX treatment and remained elevated compared to mock controls (Fig. 2a). Transcript levels of WSR4 were reduced after an initial transient increase. To establish if expression of the WSR genes is controlled by the THE1-mediated CWI maintenance mechanism, we investigated WSR transcript levels in THE1 loss (the1–1) - or gain-of-function (the1–4) seedlings [25, 75]. In ISX-treated Col-0 seedlings WSR1, 2 and 3 transcript levels were increased while WSR4 seemed slightly reduced after 8 hours (Fig. 2b). WSR1 transcript levels were not increased in the1–1 seedlings but the increase was enhanced in the1–4. WSR2 transcript levels changed in the1–1 seedlings as in Col-0 while the increase was enhanced in the1–4. Increases in WSR3 expression were apparently slightly reduced in the1–1 seedlings compared to Col-0 while the increase was again more pronounced in the1–4 than in ISX-treated Col-0 seedlings. Decrease of WSR4 expression seemed absent in the1–1 compared to ISX-treated Col-0 seedlings and was enhanced in ISX-treated the1–4 seedlings. In conclusion, both DNA microarray and qRT-PCR expression analyses showed that transcript levels of WSR1, 2 and 3 increased while WSR4 decreased in ISX-treated seedlings over time. WSR transcript levels seem to be influenced to different degrees by changes in THE1 activity with increased THE1 activity affecting all WSR genes while decreased THE1 activity seems to affect particularly strongly WSR1.
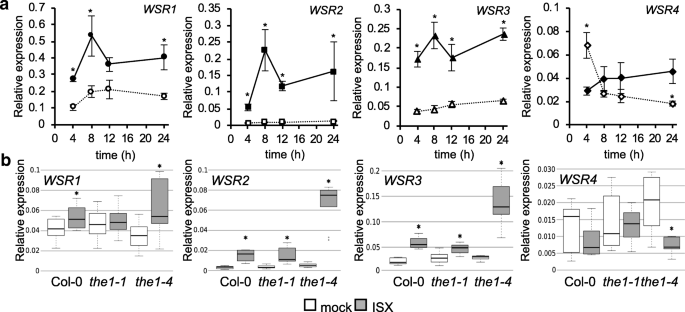
Candidate gene expression profiling in seedlings exposed to cellulose biosynthesis inhibition. a Gene expression of WSR1, 2, 3 and 4 in Col-0 seedlings at the indicated time points after mock (DMSO; empty symbols, dotted lines) or ISX (filled symbols, solid lines) treatment according to qRT-PCR analysis. Values were normalized to ACT2 and represent means from 3 independent experiments (one replicate per experiment with multiple seedlings pooled for each replicate). Error bars indicate SD. Asterisks indicate statistically significant differences (*p < 0.05) to mock controls according to Student‘s t test. b Transcript levels of WSR1, 2, 3 and 4 in Col-0, the1–1 and the1–4 seedlings mock (DMSO) or ISX-treated for 8 h. Values were normalized to ACT2 and represent means from 3 independent experiments (n = 8–9). Asterisks indicate statistically significant differences to mock controls according to Student‘s t test (*p < 0.05). The boxes in the boxplot indicate interquartile range (IQR, between 25th and 75th percentile) and the black line in the middle of the box marks the median. The whiskers indicate data points furthest from the median, if they are still within 1.5xIQR from the closest quartile. The data points outside this range are plotted individually
Identification of knockout and knockdown alleles for WSR genes
Using knockout (KO) or knockdown (KD) alleles generated through T-DNA insertions is a well-established and successful method to characterize genes of interest [76]. We identified two independent T-DNA insertion lines for each of the four genes using the Arabidopsis Gene Mapping Tool (http://signal.salk.edu/cgi-bin/tdnaexpress). Plants homozygous for the insertions were isolated using PCR-based genotyping as well as insertion positions in the individual gene and their effects on transcript levels determined. For WSR1 the first insertion is located in the 5′ (wsr1–1, Salk_046217) and the second (wsr1–2, Salk_092919) in the 3′ untranslated region of the gene (Additional file 1: Figure S3a). The insertions in WSR2 were mapped to the first intron (wsr2–2, Salk_123509) and the third exon (wsr2–1, Salk_058271) (Additional file 1: Figure S3b). For WSR3 the insertions were located either in the promoter region (wsr3–2, SALK_079548) or in the 10th intron (wsr3–1, SALK_039575) (Additional file 1: Figure S3c). In the wsr4–2 (SALK_121365) allele the insertion is located in the 1st while the one giving rise to the wsr4–1 (SALK_082484) allele is located in the 2nd exon (Additional file 1: Figure S3d). To determine if the insertions affect transcript levels of the genes, we performed qRT-PCR using total RNA isolated from mock-treated 7 days-old seedlings. These experiments identified four bona fide KO- (wsr2–1, wsr2–2, wsr3–1, wsr4–2) and four KD-alleles (wsr1–1, wsr1–2, wsr3–2 and wsr4–1) for the candidate genes (Additional file 1: Figure S3a-d).
Responses to ISX-induced CWD are modified in seedlings with insertions in WSR1 or 4
ISX-induced CWD leads to lignin deposition in seedling root tips as well as increased JA and SA production [20, 21, 48]. Here we investigated if the KO / KD alleles isolated for the candidate genes affect these responses by performing experiments with mock or ISX-treated seedlings in liquid culture. After treating the seedlings for 7 hours we measured both JA and SA levels (Fig. 3a, b). In ISX-treated wsr4–2 seedlings, we detected reduced production of JA while SA levels were lower in wsr1–2 seedlings. Lignin was detected after 24 h of ISX treatment using phloroglucinol and quantified using image analysis [16]. Mock-treated seedling roots did not show any lignin deposition (Additional file 1: Figure S4). After ISX-treatment, we detected a significant reduction in lignification of wsr4–2 seedlings (Fig. 4, Additional file 1: Figure S4). These results suggested that WSR1 and 4 might be involved in the response to ISX-induced CWD.
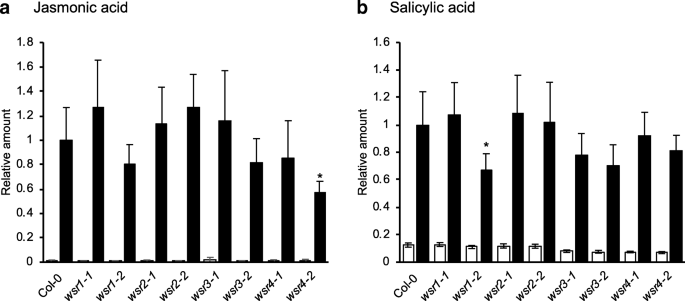
Relative jasmonic acid and salicylic acid accumulation in wsr seedlings after ISX treatment. a Jasmonic acid and (b) salicylic acid were quantified in Col-0, wsr1–1, wsr1–2, wsr2–1, wsr2–2, wsr3–1, wsr3–2, wsr4–1 and wsr4–2 seedlings after 7 h of mock (DMSO; empty bars) or ISX (filled bars) treatment. Bars represent mean values from 3 to 4 independent experiments and error bars indicate SD. Asterisks indicate statistically significant differences to the ISX-treated wild type according to Student‘s t test (*p < 0.05)
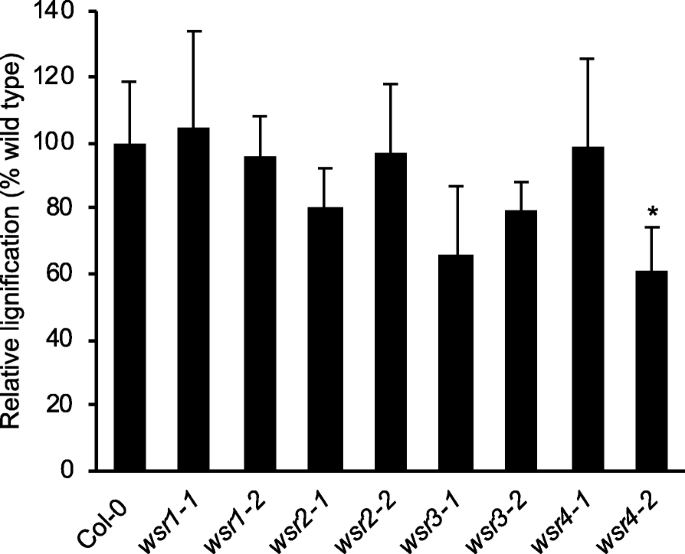
Relative lignification in wsr root tips after ISX treatment. Lignification in root tips of Col-0, wsr1–1, wsr1–2, wsr2–1, wsr2–2, wsr3–1, wsr3–2, wsr4–1 and wsr4–2 seedlings was quantified after 24 h of ISX treatment. Bars represent mean values from 3 independent experiments and error bars indicate SD. Asterisks indicate statistically significant differences to the wild type according to Student‘s t test (*p < 0.05)
WSR1, 2, 3 and 4 contribute to cell wall formation during stem growth
To determine whether the genes of interest affect cell wall metabolism in general, the levels of cellulose, uronic acids and neutral cell wall sugars were determined in cell wall preparations from rosette leaves and mature stems of Col-0 and wsr mutant plants. The mutant plants did not exhibit any pronounced growth phenotypes compared to Col-0 plants (Additional file 1: Figure S5). Here, we only investigated the strongest KO or KD allele for each candidate gene. We detected a reduction in cellulose content only in leaves of wsr4–2 plants compared to Col-0 (Fig. 5a). Our quantification of cellulose in mature stems detected increased amounts in wsr1–2 and wsr2–1, while cellulose was reduced in wsr4–2 stems (Fig. 5b). Analysis of lignin content in stems of adult plants did not detect any differences between Col-0 and mutant plants (Additional file 1: Figure S6). Analysis of neutral cell wall sugars and uronic acids in leaves detected only for the low-abundant glucuronic acid in wsr1–2 significant differences to Col-0 controls (Fig. 6a). In stem-derived material, we observed enhanced levels of rhamnose and xylose in wsr1–2 (Fig. 6b). In wsr3–1 stems, fucose, rhamnose, arabinose and galactose contents were elevated. In wsr4–2 glucose amounts were reduced while mannose was slightly enhanced compared to Col-0 controls. To summarize, our cell wall analyses detected differences in cellulose and different neutral cell wall sugar contents with effects detected most pronounced in stems. The similarities and variability observed regarding cell wall phenotypes suggest that the different genes may be involved in distinct but also overlapping aspects of cell wall metabolism in adult plants.
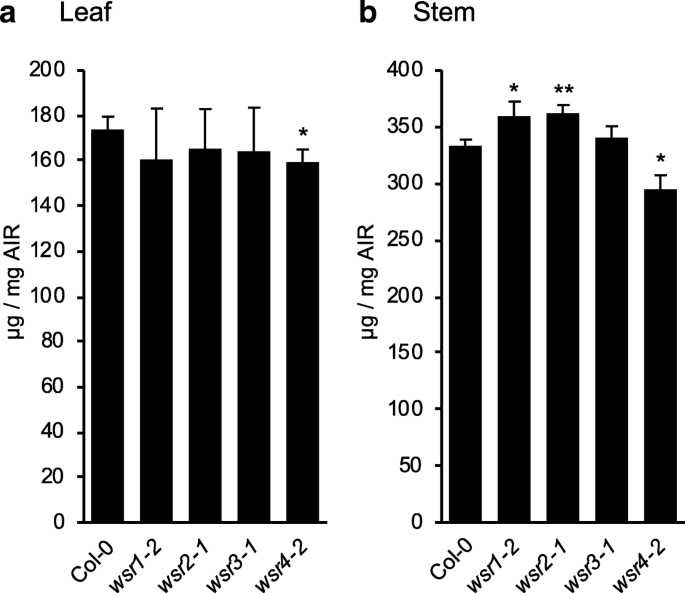
Cellulose content in adult wsr plants. Cellulose content was quantified in cell wall preparations from 5 weeks-old Col-0, wsr1–2, wsr2–1, wsr3–1 and wsr4–2 plants. a Leaf cellulose, (b) stem cellulose. Bars represent mean values and error bars indicate SD (n = 4). Asterisks indicate statistically significant differences to the wild type according to Student‘s t test (*p < 0.05; **p < 0.01)

Cell wall matrix monosaccharide composition in adult wsr plants. Relative amounts of the monosaccharides Fucose, Rhamnose, Arabinose, Galactose, Glucose, Xylose, Mannose, Galacturonic acid and Glucuronic acid were quantified in cell wall matrix hydrolysates of 5 weeks-old Col-0, wsr1–2, wsr2–1, wsr3–1 and wsr4–2 plants. a Leaf monosaccharides, (b) stem monosaccharides. Bars represent mean values and error bars indicate SD (n = 4). Asterisks indicate statistically significant differences to the wild type according to Student’s t test (*p < 0.05; **p < 0.01)
Plants with insertions in WSR1 exhibit pathogen response phenotypes
It has been shown previously that the CWI monitoring RLKs THE1 and MIK2 affect pathogen susceptibility [27]. Here we investigated if the mutations in WSR genes also affect the outcome of plant-pathogen interactions by inoculating adult plants carrying insertions in the four genes with the necrotrophic fungus Plectosphaerella cucumerina BMM (PcBMM) and quantifying fungal biomass 5 days post inoculation (Fig. 7). Arabidopsis Gβ 1 (agb1–1) and irregular xylem 1 (irx1–6) plants were included as controls since they exhibit reduced (agb1–1) or enhanced resistance (irx1–6) to PcBMM infection [77, 78]. Fungal growth on infected wsr2–1, 3–1 and 4–2 plants was similar to Col-0 controls. However, growth was significantly enhanced on wsr1–2 plants, suggesting that reduction of WSR1 gene expression affects resistance to PcBMM infection and implicating this gene in disease resistance.
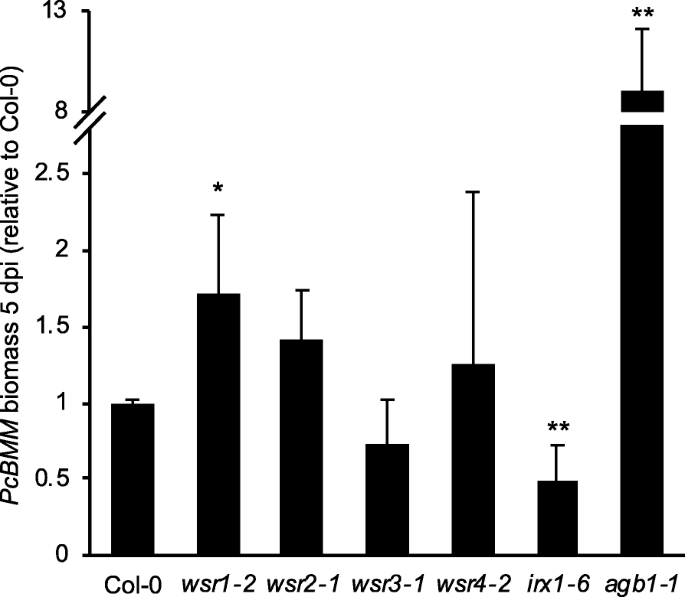
Relative susceptibility of wsr plants to Plectosphaerella cucumerina. Three weeks-old Col-0, wsr1–2, wsr2–1, wsr3–1, wsr4–2, irx1–6 (resistance control) and agb1–1 (susceptibility control) plants were infected with the necrotrophic leaf pathogen isolate PcBMM. The relative fungal biomass was determined 5 days post infection (dpi) by qPCR analysis of the PcBMM β-tubulin gene. Bars represent mean values and error bars indicate SD (n = 4–6). Asterisks indicate statistically significant differences to the wild type accoding to Student‘s t test (*p < 0.05; **p < 0.01).
Discussion
In plants a mechanism is existing, which monitors and maintains the functional integrity of the cell walls [12, 14]. This mechanism seems to exhibit similarities to the one described in S. cerevisiae and is capable of detecting CWD and initiating adaptive changes in cellular and cell wall metabolism to maintain the functional integrity of the wall [11]. Understanding of the molecular mechanisms underlying CWD perception and the signaling cascades involved in regulating the CWD response in plants is increasing [16, 28]. However, our knowledge of the genes and molecular processes bringing about changes in cell wall metabolism in response to CWD and their function during growth and development is very limited. Here, we have determined if we can identify genes both mediating responses to CWD in seedlings and cell wall metabolism in adult plants by combining transcriptomics data from ISX-treated seedlings with FTIR-based cell wall analysis of seedlings carrying T-DNA insertions in candidate genes identified from the transcriptomics data. This approach identified 17 genes (out of 23 original candidates), where T-DNA insertions in the candidate genes seem to lead to cell wall defects based on FTIR results. The functions of these genes, belonging to different gene families, are often not well-understood (Additional file 1: Table S1). Very little is known about the biological function of At1g74440 beyond that it encodes an ER membrane protein. The gene has been implicated in biotic and abiotic stress responses mediated by Plant Natriuretic Peptides (PNPs) based on co-expression with AtPNP-A [62]. ATFIM2 encodes a protein belonging to the Fimbrin family and seems to modulates the organization of actin filaments [70]. SQE2 encodes a squalene epoxidase converting squalene into oxidosqualene, which forms the precursor of all known angiosperm cyclic triterpenoids [59]. Triterpenoids are required for production of membrane sterols and brassinosteroids. PSAT1 encodes an amino transferase required for serine biosynthesis taking place in the chloroplast [69]. Serine biosynthesis in turn is required during photorespiration, a prerequisite for carbohydrate metabolism and plant growth. While AGPs have been implicated in cell wall remodeling, very little information is available regarding the specific function of AGP7 in this context [72]. AtBXL1 encodes an enzyme acting during vascular differentiation as a β-D-xylosidase while acting as an α-L-arabinofuranosidase during seed coat development [60]. PRX47 encodes a putative peroxidase, is apparently expressed in differentiating vascular tissue in seedling roots and stems and involved in lignification [68]. UGT71C3 and UGT76B1 encode UDP-glycosyltransferases (UGTs), which have been implicated in glycosylation of phytohormones and / or metabolites during the response to biotic and abiotic stress [61]. UGT76B1 in particular seems to glycosylate isoleucic acid, which is required for coordination of SA- and JA-based defence responses active during infection by pathogens like Pseudomonas syringae and Alternaria brassicicola [67]. ADR1-L1 encodes a coiled-coil nucleotide-binding leucine-rich repeat protein and forms an important element of the effector-triggered immunity in plants [64, 79]. Reviewing the available knowledge provides further evidence that several of the genes are probably required for processes relevant for cell wall (PRX47, ATBXL1, AGP7), membrane (SQE2), photosynthetic (PSAT1) metabolism or light perception (PKS1). Intriguingly UGT76B1, UGT71C3, ADR1-L1, SERK4 and At3g16560 have been implicated before in the responses to abiotic or biotic stress, which also involves plant cell walls [61, 67, 79]. In our experimental conditions the seedlings are exposed to CWD but not biotic / abiotic stress, thus raising the possibility that these genes are actually responding to cell wall-related events, which may also occur during biotic and abiotic stress. More importantly the results suggest that the approach pursued here enables us to identify amongst the many genes in the Arabidopsis genome those that contribute to the responses to CWD and regulation of relevant aspects of cell wall and membrane metabolism.
We characterized four candidate genes in more detail. These had been selected based on the FTIR phenotypes apparently caused by insertions in the candidate genes and the limited detailed knowledge regarding their biological functions. qRT-PCR-based expression analysis of the four genes in ISX-treated seedlings yielded results similar to the data from the transcriptomics experiment. Experiments with loss- and gain-of-function alleles of THE1 showed that ISX-induced changes in the transcript levels of WSR1, 2, 3 and 4 are sensitive to an increase in the activity of THE1 (the1–4) while effects of reductions (the1–1) are less pronounced [75]. These results are to be expected since complete loss of THE1 results in reduced responses to CWD but not complete losses, suggesting that the THE1-mediated CWI maintenance mechanism is either redundantly organized or other signaling mechanisms exist [16]. However, the results support the notion that WSR gene expression is regulated by the THE1-mediated CWI maintenance mechanism and that WSR activity might be controlled on the transcriptional level.
Table 2 provides a global overview of the phenotypes observed for the insertion lines in the four genes. Reduction of WSR1 and WSR2 activity seemed to cause similarly pronounced FTIR phenotypes in an area where diagnostic signals for cellulose and pectins are normally found (Fig. 1). For wsr1–2, we detected increased amounts of cellulose, rhamnose and xylose in stem-derived material while glucuronic acid was reduced in leaf material (Figs. 5, 6). ISX-induced SA production in seedlings and resistance to PcBMM in adult plants were reduced (Figs. 3, 7). In wsr2–1 plants, we also detected an increase in cellulose in stem-derived material while responses to CWD, PcBMM susceptibility and non-cellulosic cell wall matrix composition were similar to the controls (Figs. 3, 5, 6, 7). Reductions in WSR3 and 4 expression seemed to result in FTIR phenotypes related to cellulose elements, hemicelluloses and pectins (Fig. 1). In wsr3–1 stem-derived cell wall material, we detected significant differences in the amounts of fucose, rhamnose, arabinose and galactose compared to controls (Fig. 6). In wsr4–2, cellulose content was reduced both in stem- and leaf-derived cell wall material, while the amounts of glucose and mannose in stem-derived material were reduced and increased, respectively (Figs. 5, 6). Analysis of responses to CWD found reduced JA and lignin production in ISX-treated wsr4–2 seedlings and no differences to wild type in wsr3–1 seedlings (Figs. 3, 4). The phenotype observed in wsr2–1 in combination with the limited available protein information provides unfortunately no new insights regarding the function of WSR2 [55]. The specific effects on neutral cell wall sugars in wsr3–1 plants suggest that WSR3 could contribute to cell wall polysaccharide metabolism possibly by mediating transport between the Golgi (where non-cellulosic cell wall polysaccharides containing fucose, rhamnose, arabinose, galactose are synthesized) and the plasma membrane [80]. This would make sense bearing in mind that WSR3 / SFH19 belongs to the SEC14-protein family, whose members have been implicated in phosphoinositide production required for membrane homeostasis and signaling processes regulating cellular processes like vesicle transport [71, 81]. These results implicated WSR2 and WSR3 in cell wall metabolism but not in the representative responses to CWD examined here. Both WSR1/DIR7 and WSR4/PXC3 seem to be required for CWD responses on the seedling levels and for specific aspects of cell wall metabolism in adult plants, suggesting that they are both involved in CWD-induced signaling processes regulating changes in cell wall composition. WSR1 seems only required for increased SA production in response to ISX-induced CWD, whereas WSR4 is required for both JA and lignin production. The wsr4–2 phenotypes were similar to those described for CWD responses in mik2 seedlings where also only JA and lignin production differ from controls while SA amounts are similar [16, 27]. These results suggest that both RLKs might be required for the same aspects of CWI maintenance. The THE1-dependent reduction in WSR4 transcript levels in response to CWD suggest it could repress CWD-induced responses. This would be similar to the CWD response phenotypes of FER, where a FER KD leads to enhanced production of JA, SA and lignin [16]. However, the WSR4 loss of function phenotypes suggest the RLK is required for ISX-induced JA and lignin production. This implies the existence of additional regulatory elements interacting with WSR4 to give rise to the observed mutant phenotypes. Since the related RLK PXC1 has been implicated in vascular development, a function for WSR4 in coordination of CWD perception with cell wall metabolism is conceivable [57].
Conclusions
To summarize, seedlings with T-DNA insertions in 17 of the 23 candidate genes that were selected in this study seemed to exhibit FTIR phenotypes. Gene expression analysis showed that WSR gene expression is modulated in response to ISX-induced CWD, with the modulation apparently sensitive to changes in THE1 activity. This connected the genes identified to the THE1-dependent CWI maintenance mechanism, suggesting that our approach has identified new components mediating CWI maintenance in Arabidopsis. Follow up studies with KO or KD lines for four candidate genes found cell wall phenotypes in adult plants for all four and effects on CWD responses for WSR1 and 4. These results also suggest strongly that a more detailed analysis of the remaining candidate genes identified, will probably yield interesting novel insights into the mode of action of the CWI maintenance mechanism and cell wall metabolism in general.
Methods
Reagents
All chemicals and enzymes were purchased from Sigma-Aldrich unless stated otherwise.
Plant material
Wild-type and mutant Arabidopsis thaliana lines used in this study were ordered from the Nottingham Arabidopsis Stock Centre (http://arabidopsis.info/). Detailed information is listed in Additional file 1: Table S1. Seedlings were grown for 6 days in liquid culture (2.1 g/L Murashige and Skoog Basal Medium, 0.5 g/L MES salt and 1% sucrose at pH 5.7) before treatment with 600 nM isoxaben (in DMSO) as described [16]. For cell wall analysis, plants were grown on soil (Pro-Mix HP) in long-day conditions (16 h light, 11000 Lux, 22 °C, 8 h dark, 20 °C, 70% relative humidity). For pathogen infection assays, plants were grown in phytochambers on sterile soil-vermiculite (3,1) under short-day conditions (10 h of light/14 h of dark) at 20–21 °C.
Pathogen infection assays
For Plectosphaerella cucumerina BMM pathogenicity assays, 18 days-old plants (n > 15) were sprayed with a spore suspension (4 × 10⁶ spores/ml) of the fungus as previously described [82, 83]. Fungal biomass in planta was quantified by determining the level of the PcBMM β-tubulin gene by qPCR (forward primer: CAAGTATGTTCCCCGAGCCGT and reverse primer: GGTCCCTTCGGTCAGCTCTTC) and normalizing these values to those of UBIQUITIN-CONJUGATING ENZYME21 (UBC21, AT5G25760).
Quantitative RT-PCR
Total RNA was isolated using a Spectrum Plant Total RNA Kit (Sigma-Aldrich). Two micrograms of total RNA were treated with RQ1 RNase-Free DNase (Promega) and processed with the ImProm-II Reverse Transcription System (Promega) for cDNA synthesis. qRT-PCR was performed with a Roche LightCycler 480 system using LightCycler 480 SYBR Green I Master. Gene expression levels were determined as described [24]. The following gene-specific primers have been used for time course expression analysis in Col-0 and expression analysis in the1 seedlings:
-
ACT2-FOR (5′-CTTGCACCAAGCAGCATGAA-3′),
-
ACT2-REV (5′-CCGATCCAGACACTGTACTTCCTT-3′),
-
WSR1-FOR (5′-TATGGTGATGAACTTTGCGTTC-3′),
-
WSR1-REV (5′-ACTCAACAGTAGCATCTCCTGA-3′),
-
WSR1A-FOR (5′-TACGCTGCTACTGGTCAACG-3′),
-
WSR1A-REV (5′-TTCCTCCAATCACCGGCATC-3′),
-
WSR2-FOR (5′-CTCACTTCCATCGTTTCAAGTG-3′),
-
WSR2-REV (5′-GAAACCAAACGTGGCCTAAA-3′),
-
WSR3-FOR (5′-GAAAGCACGAGACTGGAACG-3′),
-
WSR3-REV (5′-TATCCACCCTCCAACGCAAA-3′),
-
WSR4-FOR (5′-AGCCCTGAGAGATCAAGCATT-3′),
-
WSR4-REV (5′-AGCTCAACTAAGCGATGAAGC-3′).
For the characterization of T-DNA insertion lines, the following primers were employed:
-
ACT2-FOR, ACT2-REV, WSR1-FOR, WSR1-REV, WSR2-FOR, WSR2-REV,
-
WSR3-FOR2 (5′- TCTTATCCGGTTGCGGAAGG-3′),
-
WSR3-REV2 (5′-GTGGTGAGATGACCCAGAGC-3′),
-
WSR4-FOR2 (5′-CTTGATGCAGTTGTGAAAGCA-3′),
-
WSR4-REV2 (5′-TCTTCACCGAAACAATCATCC-3′).
FTIR spectroscopy and analysis
For FTIR analysis, 4 biological replicates per genotype and 5 technical replicates per biological replicate were collected (i.e. for each genotype 20 spectra were collected). Spectra for each technical replicate were measured from 800 to 5000 cm− 1 with 15 accumulations per measurement on a Bruker Vertex 70. All spectra were measured at 10 kHz, with a 10 kHz lowpass filter and the Fourier transform was carried out using Blackman-Harris 3-term. Atmospheric compensation was carried out on the data using OPUS version 5 (www.bruker.com). The spectra were cropped to the area between 802 cm− 1 to 1820 cm− 1 to cover informative wavenumbers as described in [58]. Linear regression was carried out based on the first 10 points in either end of the spectra and used for baseline correction. The data was normalized to sum 1 with any negative values still present set to 0 for normalization purposes. Biological variation in the Col-0 controls was determined based on three independent experiments carried out with 4 biological replicates and 5 technical replicates per biological replicate (i.e. 20 spectra per experiment). The difference between the insertion lines and Col-0 was calculated by averaging all the technical repeats for a line and subtracting the corresponding average from Col-0. The difference between the insertion lines and Col-0 was plotted by wavelength. Two times the standard deviation of Col-0 was chosen as a cutoff as it would indicate significance if the natural variation is assumed to be symmetrical across Col-0 and the insertion line.
Cell wall analysis
Cell wall preparation and analysis were performed as described [84] with minor modifications. For analysis of stem cell wall composition, major stems of three 5 weeks-old plants per genotype were pooled to form one biological replicate. For analysis of leaf cell wall composition, whole leaf rosettes of three 5 weeks-old plants per genotype were pooled to form one biological replicate. Four biological replicates were analysed in all cases. Plant samples were immediately flash-frozen in liquid nitrogen after sampling and lyophilized. Dried material was ball-milled with zirconia beads in a Labman robot (www.labmanautomation.com), extracted three times with 70% ethanol at 70 °C and dried under vacuum. Starch was removed using a Megazyme Total Starch Kit according to the manufacturer’s instructions. After drying under vacuum, de-starched alcohol insoluble residue (AIR) was weighed out in 2 ml screw caps tubes for cell wall monosaccharide analysis (2 mg AIR) and GC vials for lignin analysis (1.2 mg AIR), respectively, with the Labman robot (0.2 mg tolerance). Cellulose, neutral sugars and uronic acids were determined following the published one-step two-step hydrolysis protocol [84]. High-performance anion-exchange chromatography with pulsed amperometric detection (HPAEC-PAD) was performed on a Thermo Fisher Dionex ICS-5000 system with CarboPac PA-20 and PA-200 columns as described [84]. Acetyl bromide soluble lignin was quantified as described [85].
Phytohormone analysis
JA and SA were extracted and analysed as described [16]. Briefly, extraction was performed in 10% methanol / 1% acetic acid with Jasmonic-d5 Acid and Salicylic-d4 Acid (CDN Isotopes) as internal standards. Quantification was performed on a Shimadzu UFLC XR / AB SCIEX Triple Quad 5500 system using the following mass transitions: JA 209 > 59, D5-JA 214 > 62, SA 137 > 93, D4-SA 141 > 97.
Lignin detection in roots
Lignification in seedling roots (n > 15) was analysed 24 h after start of treatment. Lignified regions were detected with phloroglucinol-HCl, photographed with a Zeiss Axio Zoom.V16 stereomicroscope and quantified as described [16].
Statistical analysis
Statistical significance was assessed using Student’s t-test in Microsoft Excel (2-tailed distribution, two-sample unequal variance). Statistically significant differences are indicated by * p < 0.05, ** p < 0.01. Boxplots were generated using R package “boxplot” with default settings (range = 1.5*IQR).
Availability of data and materials
If material is not already available from stock centers, it will be made available upon request by the corresponding author.
Change history
05 September 2019
Following publication of the original article [1], the author reported that the two curves in the sub-diagram WSR4 in Fig. 2a should be the other way round.
Abbreviations
- ABA:
-
Abscisic acid
- ACT2:
-
ACTIN2
- ADR1-L1:
-
ACTIVATED DISEASE RESISTANCE-LIKE 1
- agb1–1:
-
arabidopsis Gβ 1
- AGP7:
-
ARABINOGALACTAN PROTEIN 7
- AIR:
-
Alcohol insoluble residue
- ATBXL1:
-
BETA-XYLOSIDASE1
- ATFIM2:
-
FIMBRIN 2
- BIK1:
-
BOTRYTIS INDUCED KINASE 1
- CIPK26:
-
CALCINEURIN INTERACTING KINASE 26
- CKs:
-
Cytokinins
- Col-0:
-
Columbia-0
- CrRLK1L:
-
Catharanthus roseus RLK1-like kinase
- CWD:
-
Cell wall damage
- CWI:
-
Cell wall integrity
- DFG:
-
Deutsche Forschungsgemeinschaft
- DIR7:
-
DIRIGENT PROTEIN 7
- DMSO:
-
Dimethyl sulfoxide
- dpi :
-
days post infection
- FER :
-
FERONIA
- FTIR:
-
Fourier-Transform Infrared Spectroscopy
- g/L:
-
gramm / Liter
- GC :
-
Gas chromatography
- GEF:
-
Guanosine nucleotide exchange factor
- HPAEC-PAD :
-
High-performance anion-exchange chromatography with pulsed amperometric detection
- IQR :
-
Interquartile range
- irx1–6 :
-
irregular xylem 1
- ISX:
-
Isoxaben
- JA :
-
Jasmonic acid
- KD :
-
Knockdown
- kHz:
-
kilohertz
- KO :
-
Knockout
- MCA1:
-
MID1-COMPLEMENTING ACTIVITY 1
- MES:
-
Morpholinoethylsulfonic acid
- MID1/CCH1:
-
MATING-INDUCED DEATH1 / CALCIUM CHANNEL1
- MIK2:
-
MALE DISCOVERER 1-INTERACTING RECEPTOR LIKE KINASE 2
- MSL2:
-
MECHANOSENSITIVE CHANNEL OF SMALL CONDUCTANCE-LIKE 2
- MSL3:
-
MECHANOSENSITIVE CHANNEL OF SMALL CONDUCTANCE-LIKE 3
- nM:
-
nano Mol
- PcBMM :
-
Plectosphaerella cucumerina BMM
- PKS1:
-
PHYTOCHROME KINASE SUBSTRATE1
- PNPs :
-
Plant Natriuretic Peptides
- PRX47:
-
PEROXIDASE 47
- PSAT 1:
-
PHOSPHOSERINE AMINO-TRANSFERASE 1
- PXC3:
-
PHLOEM INTERCALATED WITH XYLEM / TRACHEARY ELEMENT DIFFERENTIATION INHIBITORY FACTOR RECEPTOR-CORRELATED 3
- qRT – PCR :
-
quantitative reverse transcription polymerase chain reaction
- Quad :
-
Quadrupole
- RBOH D/F:
-
NADPH-oxidases like RESPIRATORY BURST OXIDASE HOMOLOGUE
- RLK:
-
Receptor-like kinases
- S. cerevisiae :
-
Saccharomyces cerevisiae
- SA:
-
Salicylic acid
- SD:
-
Standard deviation
- SERK4:
-
SOMATIC EMBRYOGENESIS RECEPTOR KINASE 4
- SFH19:
-
SEC14-HOMOLOGUE 19
- SOS5:
-
SALT OVERLY SENSITIVE5
- SQP2:
-
SQUALENE MONOOXYGENASE2
- THE1:
-
THESEUS 1
- UFLC:
-
Ultra-fast liquid chromatography
- UGT76B1:
-
UDP GLYCOSYLTRANSFERASE 76B1
- UGTs:
-
UDP-glycosyltransferases
- WSR:
-
WALL STRESS RESPONSE
References
Bacete L, Mélida H, Miedes E, Molina A. Plant cell wall-mediated immunity: cell wall changes trigger disease resistance responses. Plant J. 2018;93:614–36.
Novaković L, Guo T, Bacic A, Sampathkumar A, Johnson K. Hitting the wall-sensing and signaling pathways involved in plant cell wall remodeling in response to abiotic stress. Plants. 2018;7:89.
Dinakar C, Bartels D. Desiccation tolerance in resurrection plants: new insights from transcriptome, proteome and metabolome analysis. Front Plant Sci. 2013;4:482.
Chowdhury J, Schober MS, Shirley NJ, Singh RR, Jacobs AK, Douchkov D, et al. Down-regulation of the glucan synthase-like 6 gene ( HvGsl6 ) in barley leads to decreased callose accumulation and increased cell wall penetration by Blumeria graminis f. sp. hordei. New Phytol. 2016;212:434–43.
Bidhendi AJ, Geitmann A. Relating the mechanics of the primary plant cell wall to morphogenesis. J Exp Bot. 2015;67:erv535.
Paredez AR, Somerville CR, Ehrhardt DW. Visualization of cellulose synthase demonstrates functional association with microtubules. Science. 2006;312:1491–5.
Gutierrez R, Lindeboom JJ, Paredez AR, Emons AM, Ehrhardt DW. Arabidopsis cortical microtubules position cellulose synthase delivery to the plasma membrane and interact with cellulose synthase trafficking compartments. Nat Cell Biol. 2009;11:797–806.
Lee Y, Rubio MC, Alassimone J, Geldner N. A mechanism for localized lignin deposition in the endodermis. Cell. 2013;153:402–12.
Doblas VG, Smakowska-luzan E, Fujita S, Alassimone J, Barberon M, Madalinski M, et al. Root diffusion barrier control by a vasculature-derived peptide binding to the SGN3 receptor. Science. 2017;355(6322):280–4.
Barbosa ICR, Rojas-Murcia N, Geldner N. The Casparian strip-one ring to bring cell biology to lignification? Curr Opin Biotechnol. 2019;56:121–9.
Hamann T. The plant cell wall integrity maintenance mechanism-concepts for organization and mode of action. Plant Cell Physiol. 2015;56:215–23.
Wolf S. Plant cell wall signalling and receptor-like kinases. Biochem J. 2017;474:471–92.
De Lorenzo G, Ferrari S, Giovannoni M, Mattei B, Cervone F. Cell wall traits that influence plant development, immunity and bioconversion. Plant J. 2018;97:134–47.
Doblas VG, Gonneau M, Höfte H. Cell wall integrity signaling in plants: Malectin-domain kinases and lessons from other kingdoms. Cell Surf. 2018;3:1–11.
Kieber JJ, Polko J. The regulation of cellulose biosynthesis in plants. Plant Cell. 2019;31:282–96.
Engelsdorf T, Gigli-Bisceglia N, Veerabagu M, McKenna JF, Vaahtera L, Augstein F, et al. The plant cell wall integrity maintenance and immune signaling systems cooperate to control stress responses in Arabidopsis thaliana. Sci Signal. 2018;11:eaao3070.
Heim DR, Skomp JR, Tschabold EE, Larrinua IM. Isoxaben inhibits the synthesis of acid insoluble cell wall materials in arabidopsis thaliana. Plant Physiol. 1990;93:695–700.
Scheible WR, Eshed R, Richmond T, Delmer D, Somerville C. Modifications of cellulose synthase confer resistance to isoxaben and thiazolidinone herbicides in Arabidopsis ixr1 mutants. Proc Natl Acad Sci U S A. 2001;98:10079–84.
Tateno M, Brabham C, DeBolt S. Cellulose biosynthesis inhibitors - a multifunctional toolbox. J Exp Bot. 2016;67:533–42.
Ellis C, Turner JG. The Arabidopsis mutant cev1 has constitutively active jasmonate and ethylene signal pathways and enhanced resistance to pathogens. Plant Cell. 2001;13:1025–33.
Cano-Delgado A, Penfield S, Smith C, Catley M, Bevan M. Reduced cellulose synthesis invokes lignification and defense responses in Arabidopsis thaliana. Plant J. 2003;34:351–62.
Manfield IW, Orfila C, Mccartney L, Harholt J, Bernal AJ, Scheller HV, et al. Novel cell wall architecture of isoxaben-habituated Arabidopsis suspension-cultured cells: global transcript profiling and cellular analysis. Plant J. 2004;40:260–75.
Denness L, McKenna JF, Segonzac C, Wormit A, Madhou P, Bennett M, et al. Cell wall damage-induced lignin biosynthesis is regulated by a reactive oxygen species- and jasmonic acid-dependent process in Arabidopsis. Plant Physiol. 2011;156:1364–74.
Gigli-Bisceglia N, Engelsdorf T, Strnad M, Vaahtera L, Khan GA, Yamoune A, et al. Cell wall integrity modulates Arabidopsis thaliana cell cycle gene expression in a cytokinin- and nitrate reductase-dependent manner. Development. 2018;145:dev166678.
Hematy K, Sado PE, Van Tuinen A, Rochange S, Desnos T, Balzergue S, et al. A receptor-like kinase mediates the response of Arabidopsis cells to the inhibition of cellulose synthesis. Curr Biol. 2007;17:922–31.
Xu S-LL, Rahman A, Baskin TI, Kieber JJ. Two leucine-rich repeat receptor kinases mediate signaling, linking cell wall biosynthesis and ACC synthase in Arabidopsis. Plant Cell. 2008;20:3065–79.
Van der Does D, Boutrot F, Engelsdorf T, Rhodes J, McKenna JF, Vernhettes S, et al. The Arabidopsis leucine-rich repeat receptor kinase MIK2/LRR-KISS connects cell wall integrity sensing, root growth and response to abiotic and biotic stresses. PLoS Genet. 2017;13:e1006832.
Feng W, Kita D, Peaucelle A, Cartwright HN, Doan V, Duan Q, et al. The FERONIA receptor kinase maintains cell-wall integrity during salt stress through Ca2+ signaling. Curr Biol. 2018;28:666–75.
Franck CM, Westermann J, Boisson-Dernier A. Plant malectin-like receptor kinases: from cell wall integrity to immunity and beyond. Annu Rev Plant Biol. 2018;69:301–28.
Haruta M, Sabat G, Stecker K, Minkoff BB, Sussman MR. A peptide hormone and its receptor protein kinase regulate plant cell expansion. Science. 2014;343:408–11.
Stegmann M, Monaghan J, Smakowska-Luzan E, Rovenich H, Lehner A, Holton N, et al. The receptor kinase FER is a RALF-regulated scaffold controlling plant immune signaling. Science. 2017;355:287–9.
Du S, Qu L-J, Xiao J. Crystal structures of the extracellular domains of the CrRLK1L receptor-like kinases ANXUR1 and ANXUR2. Protein Sci. 2018;27:886–92.
Gonneau M, Desprez T, Martin M, Doblas VG, Bacete L, Miart F, et al. Receptor kinase THESEUS1 is a rapid alkalinization factor 34 receptor in Arabidopsis. Curr Biol. 2018;28:1–7.
Liu P, Haruta M, Minkoff BB, Sussman MR. Probing a plant plasma membrane receptor Kinase’s three-dimensional structure using mass spectrometry-based protein foot printing. Biochemistry. 2018;57:5159–68.
Moussu S, Augustin S, Roman A-O, Broyart C, Santiago J. Crystal structures of two tandem malectin-like receptor kinases involved in plant reproduction. Acta Crystallogr D Struct Biol. 2018;74:671–80.
Escobar-Restrepo JM, Huck N, Kessler S, Gagliardini V, Gheyselinck J, Yang WC, et al. The FERONIA receptor-like kinase mediates male-female interactions during pollen tube reception. Science. 2007;317:656–60.
Duan Q, Kita D, Li C, Cheung AY, Wu HM. FERONIA receptor-like kinase regulates RHO GTPase signaling of root hair development. Proc Natl Acad Sci U S A. 2010;107:17821–6.
Kanaoka MM, Torii KU. FERONIA as an upstream receptor kinase for polar cell growth in plants. Proc Natl Acad Sci U S A. 2010;107:17461–2.
Yu F, Qian L, Nibau C, Duan Q, Kita D, Levasseur K, et al. FERONIA receptor kinase pathway suppresses abscisic acid signaling in Arabidopsis by activating ABI2 phosphatase. Proc Natl Acad Sci U S A. 2012;109:14693–8.
Shih HW, Miller ND, Dai C, Spalding EP, Monshausen GB. The receptor-like kinase FERONIA is required for mechanical signal transduction in Arabidopsis seedlings. Curr Biol. 2014;24:1887–92.
Guo H, Nolan TM, Song G, Liu S, Xie Z, Chen J, et al. FERONIA receptor kinase contributes to plant immunity by suppressing jasmonic acid signaling in Arabidopsis thaliana. Curr Biol. 2018:1–9.
Zhao F, Chen W, Traas J. Mechanical signaling in plant morphogenesis. Curr Opin Genet Dev. 2018;51:26–30.
Shi H, Kim Y, Guo Y, Stevenson B, Zhu JK. The Arabidopsis SOS5 locus encodes a putative cell surface adhesion protein and is required for normal cell expansion. Plant Cell. 2003;15:19–32.
Harpaz-Saad S, McFarlane HE, Xu S, Divi UK, Forward B, Western TL, et al. Cellulose synthesis via the FEI2 RLK/SOS5 pathway and cellulose synthase 5 is required for the structure of seed coat mucilage in Arabidopsis. Plant J. 2011;68:941–53.
Xue H, Veit C, Abas L, Tryfona T, Maresch D, Ricardi MM, et al. Arabidopsis thaliana FLA4 functions as a glycan-stabilized soluble factor via its carboxy-proximal Fasciclin 1 domain. Plant J. 2017;91:613–30.
Nakagawa Y, Katagiri T, Shinozaki K, Qi Z, Tatsumi H, Furuichi T, et al. Arabidopsis plasma membrane protein crucial for Ca2+ influx and touch sensing in roots. Proc Natl Acad Sci U S A. 2007;104:3639–44.
Levin DE. Regulation of cell wall biogenesis in Saccharomyces cerevisiae: the cell wall integrity signaling pathway. Genetics. 2011;189:1145–75.
Hamann T, Bennett M, Mansfield J, Somerville C. Identification of cell-wall stress as a hexose-dependent and osmosensitive regulator of plant responses. Plant J. 2009;57:1015–26.
Jiménez-Quesada MJ, Traverso JÁ, Alché Jde D. NADPH oxidase-dependent superoxide production in plant reproductive tissues. Front Plant Sci. 2016;7. https://doi.org/10.3389/fpls.2016.00359.
Kadota Y, Sklenar J, Derbyshire P, Stransfeld L, Asai S, Ntoukakis V, et al. Direct regulation of the NADPH oxidase RBOHD by the PRR-associated kinase BIK1 during plant immunity. Mol Cell. 2014;54:43–55.
Han J-P, Köster P, Drerup MM, Scholz M, Li S, Edel KH, et al. Fine-tuning of RBOHF activity is achieved by differential phosphorylation and Ca 2+ binding. New Phytol. 2019;221:1935–49.
Doblin MS, Johnson KL, Humphries J, Newbigin EJ, Bacic AT. Are designer plant cell walls a realistic aspiration or will the plasticity of the plant’s metabolism win out? Curr Opin Biotechnol. 2014;26:108–14.
Mahon EL, Mansfield SD. Tailor-made trees: engineering lignin for ease of processing and tomorrow’s bioeconomy. Curr Opin Biotechnol. 2019;56:147–55.
Paniagua C, Bilkova A, Jackson P, Dabravolski S, Riber W, Didi V, et al. Dirigent proteins in plants: modulating cell wall metabolism during abiotic and biotic stress exposure. J Exp Bot. 2017;68:3287–301.
De Abreu-Neto JB, Turchetto-Zolet AC, De Oliveira LFV, Bodanese Zanettini MH, Margis-Pinheiro M. Heavy metal-associated isoprenylated plant protein (HIPP): characterization of a family of proteins exclusive to plants. FEBS J. 2013;280:1604–16.
Vincent P, Chua M, Nogue F, Fairbrother A, Mekeel H, Xu Y, et al. A Sec14p-nodulin domain phosphatidylinositol transfer protein polarizes membrane growth of Arabidopsis thaliana root hairs. J Cell Biol. 2005;168:801–12.
Wang J, Kucukoglu M, Zhang L, Chen P, Decker D, Nilsson O, et al. The Arabidopsis LRR-RLK, PXC1, is a regulator of secondary wall formation correlated with the TDIF-PXY/TDR-WOX4 signaling pathway. BMC Plant Biol. 2013;13:1–11.
Mouille G, Robin S, Lecomte M, Pagant S, Hofte H. Classification and identification of Arabidopsis cell wall mutants using Fourier-Transform InfraRed (FT-IR) microspectroscopy. Plant J. 2003;35:393–404.
Rasbery JM, Shan H, LeClair RJ, Norman M, Matsuda SP, Bartel B. Arabidopsis thaliana squalene epoxidase 1 is essential for root and seed development. J Biol Chem. 2007;282:17002–13.
Arsovski AA, Popma TM, Haughn GW, Carpita NC, McCann MC, Western TL. AtBXL1 encodes a bifunctional -D-Xylosidase/ -L-Arabinofuranosidase required for pectic arabinan modification in Arabidopsis mucilage secretory cells. Plant Physiol. 2009;150:1219–34.
Rehman HM, Nawaz MA, Shah ZH, Ludwig-Müller J, Chung G, Ahmad MQ, et al. Comparative genomic and transcriptomic analyses of Family-1 UDP glycosyltransferase in three Brassica species and Arabidopsis indicates stress-responsive regulation. Sci Rep. 2018;8. https://doi.org/10.1038/s41598-018-19535-3.
Meier S, Bastian R, Donaldson L, Murray S, Bajic V, Gehring C. Co-expression and promoter content analyses assign a role in biotic and abiotic stress responses to plant natriuretic peptides. BMC Plant Biol. 2008;8:24.
Wuest SE, Vijverberg K, Schmidt A, Weiss M, Gheyselinck J, Lohr M, et al. Arabidopsis female gametophyte gene expression map reveals similarities between plant and animal gametes. Curr Biol. 2010;20:506–12.
Dong OX, Tong M, Bonardi V, El Kasmi F, Woloshen V, Wünsch LK, et al. TNL-mediated immunity in Arabidopsis requires complex regulation of the redundant ADR1 gene family. New Phytol. 2016;210:960–73.
Wilson RH, Smith AC, Kacurakova M, Saunders PK, Wellner N, Waldron KW. The mechanical properties and molecular dynamics of plant cell wall polysaccharides studied by Fourier-transform infrared spectroscopy. Plant Physiol. 2000;124:397–405.
Szymanska-Chargot M, Chylinska M, Kruk B, Zdunek A. Combining FT-IR spectroscopy and multivariate analysis for qualitative and quantitative analysis of the cell wall composition changes during apples development. Carbohydr Polym. 2015;115:93–103.
Maksym RP, Ghirardo A, Zhang W, von Saint PV, Lange B, Geist B, et al. The defense-related Isoleucic acid differentially accumulates in Arabidopsis among branched-chain amino acid-related 2-Hydroxy carboxylic acids. Front Plant Sci. 2018;9. https://doi.org/10.3389/fpls.2018.00766.
Tokunaga N, Kaneta T, Sato S, Sato Y. Analysis of expression profiles of three peroxidase genes associated with lignification in Arabidopsis thaliana. Physiol Plant. 2009;136:237–49.
Wulfert S, Krueger S. Phosphoserine Aminotransferase1 is part of the phosphorylated pathways for serine biosynthesis and essential for light and sugar-dependent growth promotion. Front Plant Sci. 2018;9:1712.
Zhang R, Chang M, Zhang M, Wu Y, Qu X, Huang S. The structurally plastic CH2 domain is linked to distinct functions of fimbrins/plastins. J Biol Chem. 2016;291:17881–96.
Kf de Campos M, Schaaf G. The regulation of cell polarity by lipid transfer proteins of the SEC14 family. Curr Opin Plant Biol. 2017;40:158–68.
Seifert G. Fascinating Fasciclins: a surprisingly widespread family of proteins that mediate interactions between the cell exterior and the cell surface. Int J Mol Sci. 2018;19:1628.
Kami C, Allenbach L, Zourelidou M, Ljung K, Schütz F, Isono E, et al. Reduced phototropism in pks mutants may be due to altered auxin-regulated gene expression or reduced lateral auxin transport. Plant J. 2014;77:393–403.
Roux M, Schwessinger B, Albrecht C, Chinchilla D, Jones A, Holton N, et al. The Arabidopsis leucine-rich repeat receptor–like kinases BAK1/SERK3 and BKK1/SERK4 are required for innate immunity to hemibiotrophic and biotrophic pathogens. Plant Cell. 2011;23:2440–55.
Merz D, Richter J, Gonneau M, Sanchez-Rodriguez C, Eder T, Sormani R, et al. T-DNA alleles of the receptor kinase THESEUS1 with opposing effects on cell wall integrity signaling. J Exp Bot. 2017;68:4583–93.
Alonso JM, Stepanova AN, Leisse TJ, Kim CJ, Chen H, Shinn P, et al. Genome-wide insertional mutagenesis of Arabidopsis thaliana. Science. 2003;301:653–7.
Llorente F, Alonso-Blanco C, Sanchez-Rodriguez C, Jorda L, Molina A. ERECTA receptor-like kinase and heterotrimeric G protein from Arabidopsis are required for resistance to the necrotrophic fungus Plectosphaerella cucumerina. Plant J. 2005;43:165–80.
Hernandez-Blanco C, Feng DX, Hu J, Sanchez-Vallet A, Deslandes L, Llorente F, et al. Impairment of cellulose synthases required for Arabidopsis secondary cell wall formation enhances disease resistance. Plant Cell. 2007;19:890–903.
Bonardi V, Tang S, Stallmann A, Roberts M, Cherkis K, Dangl JL. Expanded functions for a family of plant intracellular immune receptors beyond specific recognition of pathogen effectors. Proc Natl Acad Sci. 2011;108:16463–8.
Temple H, Saez-Aguayo S, Reyes FC, Orellana A. The inside and outside: topological issues in plant cell wall biosynthesis and the roles of nucleotide sugar transporters. Glycobiology. 2016;26:913–25.
Gerth K, Lin F, Menzel W, Krishnamoorthy P, Stenzel I, Heilmann M, et al. Guilt by association: a phenotype-based view of the plant phosphoinositide network. Annu Rev Plant Biol. 2017;68:349–74.
Delgado-Cerezo M, Sanchez-Rodriguez C, Escudero V, Miedes E, Fernandez PV, Jorda L, et al. Arabidopsis heterotrimeric G-protein regulates cell wall defense and resistance to necrotrophic fungi. Mol Plant. 2011. https://doi.org/10.1093/mp/ssr082.
Sanchez-Vallet A, Ramos B, Bednarek P, Lopez G, Pislewska-Bednarek M, Schulze-Lefert P, et al. Tryptophan-derived secondary metabolites in Arabidopsis thaliana confer non-host resistance to necrotrophic Plectosphaerella cucumerina fungi. Plant J. 2010;63:115–27.
Yeats T, Vellosillo T, Sorek N, Ibáñez AB, Bauer S. Rapid determination of cellulose, neutral sugars, and uronic acids from plant cell walls by one-step two-step hydrolysis and HPAEC-PAD. Plant Physiol. 2016;6:e1978.
Chang XF, Chandra R, Berleth T, Beatson RP. Rapid, microscale, acetyl bromide-based method for high-throughput determination of lignin content in Arabidopsis thaliana. J Agric Food Chem. 2008;56:6825–34.
Acknowledgments
Programming support from Ane-Kjersti Vie and help with lignin and phytohormone quantification from Trude Johansen and the PROMEC facility at NTNU are gratefully acknowledged.
Funding
This work was supported through Gatsby AdHoc funds and a grant from the Peder Sather Center for Advanced Study to T.H. and Chris Somerville. T.E. was supported through a EU Marie Curie Fellowship “SUGAROSMO-SIGNALLING” and a DFG postdoctoral fellowship (EN 1071/1–1). L.K. was supported by a Ph.D. Fellowship from the Porter Institute at Imperial College. N.G.-B. was supported through the EEA project grant CYTOWALL. L.D. and A.W were supported through postdoctoral fellowships provided by the Porter Institute at Imperial College and I.C. by a PhD fellowship provided by the Royal Thai government. Research by A.M. was supported by Spanish Ministry of Economy and Competitiveness (MINECO) grant BIO2015–64077-R. The different funders did not have any role in the design of the study and collection, analysis, and interpretation of data and in writing the manuscript.
Author information
Authors and Affiliations
Contributions
TE, LK, NGB, LV, SB, EM, AM and TH contributed to experimental design. TE, LK, NGB, LV, SB, EM, AM, LJ and IC generated data. TE, LK, NGB, LV, SB, EM, AM and TH co-wrote the manuscript. All authors have read the final version of the manuscript and approved it.
Corresponding author
Ethics declarations
Ethics approval and consent to participate
Not applicable.
Consent for publication
All authors give consent.
Competing interests
The authors declare that they have no competing interests.
Additional information
Publisher’s Note
Springer Nature remains neutral with regard to jurisdictional claims in published maps and institutional affiliations.
Additional file
Additional file 1:
Table S1. Overview of genes selected for FTIR analysis. Table S2. DNA microarray-based expression analysis of 23 candidate genes in a published dataset (Hamann et al., 2009). Figure S1. Graphic representation of the transcript levels for 23 candidate genes in different cell types and plant organs based on data from the Genevestigator database. Figure S2. Graphic representation of average FTIR spectra of wild-type (Col-0) and all insertion lines screened. (a-c) Difference spectra obtained by subtraction from the Col-0 average spectrum. Black lines indicate 2x SD of Col-0-derived seedling material. Differently coloured lines indicate data derived from the insertion lines analysed. Genes where insertion lines exhibit similar FTIR-phenotypes are arranged together in panels (a-c). (d) Col-0 average spectrum. Figure S3. Characterization of WSR T-DNA insertion lines. Transcript levels of (a) WSR1, (b) WSR2, (c) WSR3 and (d) WSR4 were determined by qRT-PCR in wsrmutant seedlings. Values were normalized to ACT2 and represent means from 3 independent experiments (n.d.: not detectable). Error bars indicate SD, asterisks indicate statistically significant differences to Col-0 according to Student‘s t test (*p < 0.05; **p < 0,01; ***p < 0.001). Gene models indicating positions of T-DNA insertion (triangles) and PCR primers (arrows) are shown below bar charts. Exons are represented by boxes, introns by lines and untranslated regions by dashed lines. Figure S4. ISX-induced lignification in root tips of candidate mutants. Seedlings were mock or ISX-treated for 24 h. Representative images of phloroglucinol-stained roots are shown. Figure S5. Growth phenotypes of Col-0 and wsr plants at two time points. Material for cell wall analysis was harvested after 35 days. Figure S6. Lignin content in stems of adult wsr plants. Acetyl bromide soluble lignin was determined in stem cell wall preparations of 5 weeks-old plants. Bars represent mean values while error bars indicate SD (n = 4). (PDF 1450 kb)
Rights and permissions
Open Access This article is distributed under the terms of the Creative Commons Attribution 4.0 International License (http://creativecommons.org/licenses/by/4.0/), which permits unrestricted use, distribution, and reproduction in any medium, provided you give appropriate credit to the original author(s) and the source, provide a link to the Creative Commons license, and indicate if changes were made. The Creative Commons Public Domain Dedication waiver (http://creativecommons.org/publicdomain/zero/1.0/) applies to the data made available in this article, unless otherwise stated.
About this article

Cite this article
Engelsdorf, T., Kjaer, L., Gigli-Bisceglia, N. et al. Functional characterization of genes mediating cell wall metabolism and responses to plant cell wall integrity impairment. BMC Plant Biol 19, 320 (2019). https://doi.org/10.1186/s12870-019-1934-4
Received:
Accepted:
Published:
DOI: https://doi.org/10.1186/s12870-019-1934-4