
Abstract
Background
Buckwheat (Fagopyrum esculentum Moench.) is an annual crop that originated in southern China. The nutritious seeds are used in cooking much like cereal grains. Buckwheat is an outcrossing species with heteromorphic self-incompatibility due to its dimorphic (i.e., short- and long-styled) flowers and intra-morph infertility. The floral morphology and intra-morph incompatibility are both determined by a single S locus. Plants with short-styled flowers are heterozygous (S/s) and plants with long-styled flowers are homozygous recessive (s/s) at this locus, and the S/S genotype is not found. Recently, we built a draft genome assembly of buckwheat and identified the 5.4-Mb-long S-allele region harbored by short-styled plants.
In this study, the first report on the genome-wide diversity of buckwheat, we used a genotyping-by-sequencing (GBS) dataset to evaluate the genome-wide nucleotide diversity within cultivated buckwheat landraces worldwide. We also investigated the utility of the S-allele region for phylogenetic analysis of buckwheat.
Results
Buckwheat showed high nucleotide diversity (0.0065), comparable to that of other outcrossing plants, based on a genome-wide simple nucleotide polymorphism (SNP) analysis. Phylogenetic analyses based on genome-wide SNPs showed that cultivated buckwheat comprises two groups, Asian and European, and revealed lower nucleotide diversity in the European group (0.0055) and low differentiation between the Asian and European groups.
The nucleotide diversity (0.0039) estimated from SNPs in the S-allele region is lower than that in genome-wide SNPs. Phylogenetic analysis based on this region detected three diverged groups, S-1, S-2, and S-3.
Conclusion
The SNPs detected using the GBS dataset were effective for elucidating the evolutionary history of buckwheat, and led to the following conclusions: (1) the low nucleotide diversity of the entire genome in the European group and low differentiation between the Asian and European groups suggested genetic bottlenecks associated with dispersion from Asia to Europe, and/or recent intensified cultivation and selection in Europe; and (2) the high diversification in the S-allele region was indicative of gene flows from wild to cultivated buckwheat, suggesting that cultivated buckwheat may have multiple origins.
Background
Buckwheat (Fagopyrum esculentum Moench.; 2n = 2x = 16), a member of the Polygonaceae family, is an annual crop that originated in southern China [1, 2]. The seeds (strictly achenes) are used as cereal grains in the same way as rice (Oryza sativa) and wheat (Triticum aestivum); because buckwheat does not belong to the Poaceae family, it is often referred to as a pseudo-cereal. Buckwheat has excellent cultivation properties, with a short growing period and tolerance of cool climate and high elevation. Buckwheat is therefore widely cultivated in temperate zones throughout Eurasia and is used in many traditional foods, such as soba (Japanese noodles), memil guksu (Korean noodles), pizzoccheri (Italian pasta), and galettes (French pancakes). Buckwheat seeds are dense in starch and high-quality protein with a well-balanced amino acid composition [3] and are an important source of dietary fiber, trace elements, and phenolic compounds [4, 5]. Because of its high nutrient content and lack of gluten, buckwheat is now widely cultivated in regions beyond Eurasia, including in the USA, Canada, Australia, and New Zealand.
To identify agronomically useful genes, buckwheat linkage maps have been constructed using various molecular markers, including isozyme variations [6], simple sequence repeats (SSRs) [7], and amplified fragment-length polymorphisms (AFLPs) [8]. Recently, a microarray marker system and a genome-wide linkage map for common buckwheat were developed [9]. They later confirmed that genomic selection using genome-wide microarray markers was an effective approach for improving buckwheat yield [10]. In addition, our research group constructed the Buckwheat Genome DataBase (BGDB) [11]. Using BGDB, various agronomically useful genes, such as those controlling flavonoid biosynthesis and encoding 2S albumin-type allergens and granule-bound starch synthases (GBSSs), have been identified [11,12,13,14]. Thus, the genetic tools for buckwheat breeding are highly developed.
Evaluating genetic diversity is a crucial step for exploring agronomically useful genes in crop species. Buckwheat is an outcrossing species with heteromorphic self-incompatibility (SI) due to its dimorphic flower types (i.e., short- and long-styled flowers), each incompatible with flowers of the same morph, but compatible across morphs [15, 16]. The floral morphology and intra-morph incompatibility are both determined by a single genetic locus, S. Plants with short-styled flowers are heterozygous (S/s) and those with long-styled flowers are homozygous recessive (s/s) at this locus [15, 17]. Thus, like other outcrossing crops such as maize (Zea mays), buckwheat is expected to maintain substantial intraspecies diversity. Indeed, isozyme analysis indicates that buckwheat has great genetic diversity, comparable to that of outcrossing wild plant species [18]; the heterozygosity of cultivated populations is higher than that seen in wild populations of the ancestral species, F. esculentum ssp. ancestrale, which is found in southern China. Subsequent AFLP and SSR analyses suggested that F. esculentum ssp. ancestrale is composed of two distantly related phylogenetic groups, the Tibetan and the Yunnan-Sichuan groups, and that cultivated buckwheat landraces belong to the Tibetan group [1, 19]. However, these analyses were based only on similarity of DNA banding patterns, and the average number of nucleotide differences per nucleotide site (i.e., the nucleotide diversity) [20] was not estimated. To date, no information on genome-wide nucleotide diversity within F. esculentum is available. Thus, there is great interest in investigating the nucleotide diversity of F. esculentum using newer and superior genomic tools.
Recently, we built a draft genome assembly of buckwheat and then applied genotyping-by-sequencing technology (GBS) [21] to a group of buckwheat landraces from around the world [11]. The GBS method, which uses sequences of amplified genomic DNA fragmented by restriction enzymes, has become increasingly popular for detecting large numbers of SNPs [22]. We used the draft genome assembly as reference for GBS markers, and successfully identified the S-allele region, which consisted of 332 scaffolds encompassing 5.4 Mbp [11]. The region contains sites at which GBS reads were mapped in short-styled plants but not in long-styled plants, and harbors two S-allele-specific genes, S-ELF3 and SSG2, that exist only in the genomes of short-styled plants. The genotypes of short-styled and long-styled plants are thus hemizygous and null homozygous, respectively [15]. This is similar to the situation for human sex chromosome genes; the hemizygous state of Y-chromosome genes has proved a useful feature for clarifying human phylogenetic structure [23]. Thus, we predicted that comparisons of DNA sequences in the S-allele region would be a powerful tool for elucidating phylogenetic relationships among buckwheat landraces.
In this study, we evaluated the genome-wide nucleotide diversity within worldwide landraces of cultivated buckwheat using the published GBS data. This is the first report of genome-wide nucleotide diversity within F. esculentum. We discuss the utility of the S-allele region for phylogenetic analysis of the buckwheat species, and demonstrate possible gene flows from wild to cultivated buckwheat deduced from the diversified S-allele region.
Results
Overall SNP detection and nucleotide diversity
We obtained an average of 7.2 million reads per plant (corresponding to 726.1 Mbp). After filtering the sites detected by GBS for 46 buckwheat plants, we retained 7,154,454 sites, corresponding to 0.61% of the reference genome, for further analysis (Table 1). From the 7,154,454 sites, we detected 255,517 SNP sites, representing a SNP density of 0.036 (one SNP per 28 bp). We compared the number of mapping sites, the SNP density, and the nucleotide diversity between short- and long-styled plants and found no significant differences (Table 1).
Population structure and phylogenetic analysis
We calculated genetic distances among common buckwheat landraces and constructed a phylogenetic tree by the NJ method using 7,154,454 sites including 255,517 SNP sites. The NJ tree showed that 46 cultivars were largely divided into two groups, Asian (32 cultivars) and European (14 cultivars) (Fig. 1). The phylogenetic relationships among cultivated buckwheat were well associated with geographic distribution; samples from one country were phylogenetically closely related in the NJ tree (e.g., I8601 and I 8605 for India, N8323 and N8605 for Nepal, and T1F and X1F for Japan). The PCA plot also showed that 46 cultivars were largely divided into two groups composed of Asian and European cultivars, respectively (Fig. 2).

Neighbor-joining (NJ) tree of 46 cultivars of common buckwheat based on 7.15 Mbp including 255,517 SNPs. Red and blue represent short- and long-styled plants, respectively. Numbers above branches show bootstrap values based on 100 replicates (those less than 80% are not shown) and red asterisks indicate bootstrap values of 95% or over. The scale bar corresponds to 0.001 substitutions per nucleotide site

Principal-component analysis (PCA) of 46 cultivars of common buckwheat based on GBS data mapped on all genome scaffolds. Graph of the first two axes (x-axis for PC1 and y-axis for PC2) from PCA. The proportion of variance explained by each component is given in parentheses along each axis. Red and blue represent short- and long-styled plants, respectively
To clarify the population structure of buckwheat, we subjected 255,517 SNPs segregated in 46 GBS to ADMIXTURE analysis. Cross-validation error was lowest at K = 1 and gradually increased as K increased (Additional file 1: Figure S1). At K = 2, the cross-validation error was also low, indicating that the optimal number of ancestral populations was K = 1 or K = 2. Although the lowest cross-validation error was actually observed at K = 1, the NJ tree and PCA implied that there were two groups (one including only Asian landraces and the other only European landraces), indicating that K = 2 is suitable for grouping the 46 common buckwheat landraces. We refer to the two groups hereafter as the Asian and European groups.
To compare nucleotide diversity between the Asian and European groups, we identified SNPs and calculated the genome-wide mean nucleotide diversity of each group (Table 1). The SNP density was much lower in the European group (0.019) than in the Asian group (0.034). Nucleotide diversity was also lower in the European (0.0055) than in the Asian (0.065) group. However, even though the NJ tree and PCA plot indicated that there were two groups, the Fst value between Asian and European cultivars was not very high (Fst = 0.068).
Diversity of S-linked scaffolds
We previously identified the S-allele region, consisting of 332 scaffolds encompassing 5,393,196 bp, to which short-style-specific sites were mapped [11]. To analyze the nucleotide diversity of this region, we identified SNPs on these 332 scaffolds in 23 short-styled plants. From the 60,108 sites (0.11% of the total length of the 332 scaffolds), we detected 1123 SNPs. The SNP density (0.019) and genetic diversity (0.0039) in the S-allele scaffolds were lower than those in all genomic scaffolds (Table 1).
To uncover the phylogenetic relationship among the S-allele region obtained from 23 short-styled plants, we constructed an NJ tree based on the S-allele region using 60,108 sites, including 1123 SNP sites. The NJ tree based on the S-allele region showed that common buckwheat plants of the short-styled phenotype (S/s genotype) were largely divided into three groups, which we named S-1, S-2, and S-3 (Fig. 3). The phylogenetic relationship identified on the basis of the S-linked scaffolds was identical to that implied by analysis of S-ELF and SSG2 [15] but different from that of the NJ tree based on genome-wide SNPs (Fig. 1). The S-1, S-2, and S-3 phylogenetic groups were composed of fifteen, five, and three cultivars, respectively. These groups were also detected by the PCA (Additional file 2: Figure S2). The nucleotide diversity of the S-allele region (0.0039) was lower than that of all scaffolds (Table 1). The average nucleotide distance and Fst value between the phylogenetic groups in the S-linked scaffolds were high (Table 2). In particular, S-3 was clearly more distantly related to S-1 and S-2 than they were to each other.
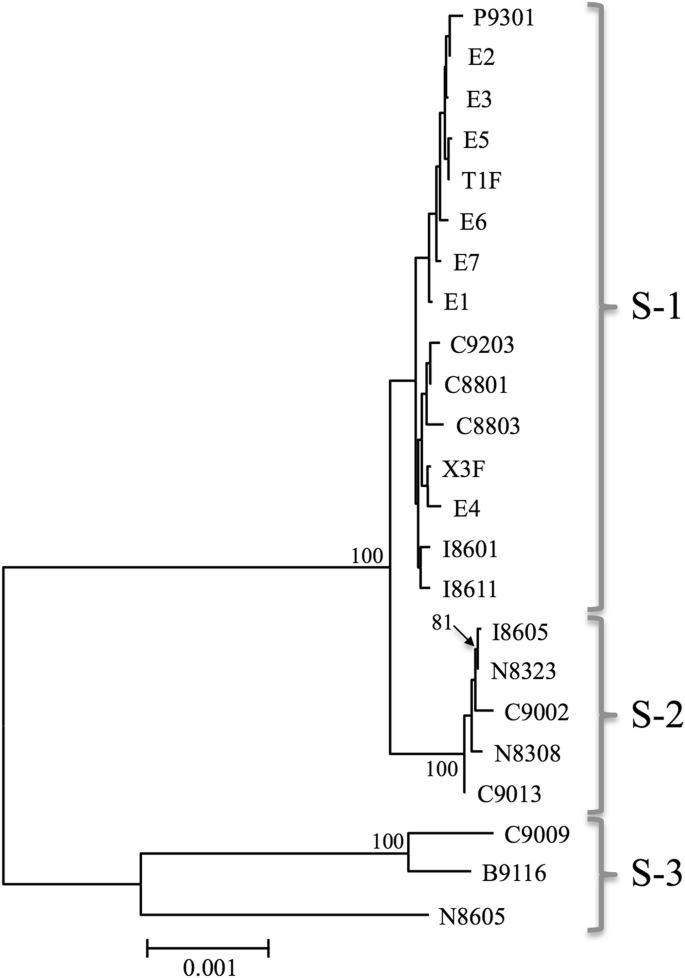
Neighbor-joining (NJ) tree based on GBS sequences (60.1 Kbp) mapped on 332 S-allelic scaffolds. All 23 samples are short-styled plants harboring an S allele (genotype, S/s). Numbers above branches show bootstrap values based on 100 replicates (those less than 80% were not shown). The scale bar corresponds to 0.001 substitutions per nucleotide site
Discussion
Genome-wide and S-allele-region-specific nucleotide diversity in common buckwheat
In this study, we obtained 255,517 genome-wide SNPs using the GBS method, which is capable of producing larger numbers of genome-wide SNPs than had been obtained in previous studies of this species. Furthermore, the published genome sequence [11] enabled us to estimate the nucleotide diversity, which revealed that the nucleotide diversity of common buckwheat (0.0065) was comparable to that of other outcrossing plants, such as maize (Zea mays, 0.0064) [24] and sunflower (Helianthus annuus; 0.0056) [25], and higher than that of selfing crops such as rice (Oryza sativa, 0.0024) [26] and soybean (Glycine max; 0.0019) [27]. This higher nucleotide diversity is likely due to buckwheat’s outcrossing mating system and/or to gene flow from wild buckwheat, F. esculentum ssp. ancestrale.
The genetic basis of the heteromorphic SI system is similar to that of sex chromosomes in the plant and animal kingdoms. There have been numerous reports on the nucleotide diversities of sex chromosomes [28,29,30,31]. In humans, for example, the ratios of the nucleotide diversities of the X and Y chromosomes to those of the autosomal chromosomes are 0.62 and 0.20, respectively [32]. The lower nucleotide diversities observed in sex chromosomes are an expected result of the lower effective population size: the effective population sizes of the human X and Y chromosomes correspond to 3/4 and 1/4 that of autosomal chromosomes, respectively. In this study, we confirmed that the nucleotide diversity of the S-allele region is similarly lower than that of the genome as a whole: the ratio of the nucleotide diversity of the S-allele region to that of the whole genome is 0.62. That this number is much higher than the expected value (0.25) is probably due to the low density of functional genes in the S-allele region [11] and/or to recent multiple gene flows, as discussed in the following section. Much higher genetic diversity of S-allelic region than expected also indicates that S-allelic region is not under purifying selection.
Gene flow inferred from S-allele divergence
The phylogenetic relationships deduced from the 332 S-allele scaffolds (Fig. 3) were not congruent with those based on genome-wide SNPs (Fig. 1): three widely diverged phylogenetic groups, S-1, S-2, and S-3, were detected in the data shown in Fig. 3 (from the S-allele region) but not in Fig. 1 (from the whole genome). It is noteworthy that the three phylogenetic groups of S-allele regions are well diverged. In particular, S-3 is strongly divergent from the other two groups: the nucleotide diversity between S-3 and the other two groups is around 0.006 (Table 2). Using a rough molecular clock rate of 0.01 synonymous nucleotide substitutions per million years (e.g., 0.011 for Gossypium species and 0.016 for Arachis species) [33, 34], this would indicate that group S-3 diverged from the other groups 0.3 million years ago. The earliest plausibly identified buckwheat archeological pollen specimen, found in northern China, has been dated to 5000 to 6000 BP [35]. Thus, it is unlikely that mutations detected in S-alleles derive from the origin of buckwheat cultivation. Considering the possibility of cross-compatibility resulting in fertile hybrids [36] and the overlap in habitats [19] between cultivated and wild buckwheat, we concluded that the diverged S-allele sequences were introgressed from wild buckwheat, F. esculentum ssp. ancestrale, and that the introgressions between wild and cultivated buckwheat are also attributable to high genome-wide diversity.
S-allele region as a phylogenetic tool for elucidating the origin and diffusion of cultivated buckwheat
ADMIXTURE and phylogenetic analyses and PCA classified 46 buckwheat cultivars into two groups, the Asian and European groups, with a low Fst value (Fst = 0.068). The European group exhibited lower nucleotide diversity than the Asian group (Table 1). From archeological studies of the pollen and macrofossil (i.e., charred seeds) records, it has been suggested that buckwheat was introduced into Europe during the period 4000–2800 BP, though it did not become a popular crop until the Late Medieval period [37]. Both the lower nucleotide diversity in the European group and the weak differentiation between the Asian and European groups are likely due to genetic bottlenecks associated with dispersion from Asia to Europe, and/or the recent intensified cultivation and selection. The low genetic variation and loss of alleles detected by isozyme analysis also support this hypothesis [38].
Y chromosomes, which retain sequential records of the accumulation of nucleotide diversity, have been used to detect ancestral haplotypes and to trace human migrations [39]. Although genome-wide SNPs have illuminated the population structure and population differentiation of cultivated buckwheat, the SNPs in S-linked scaffolds may shed light on different aspects of the diffusion history of the species. In this study, we detected three major S-allele groups, S-1, S-2, and S-3 (Fig. 3). The phylogenetic relationship implied by S-linked scaffolds suggested the introgressions from wild relatives as discussed above. This is due to the suppression of recombination in S-allelic region like sex chromosomes. Thus, phylogenetic analysis using S-allelic region is expected to offer better understanding of the origin and global diffusion of cultivated buckwheat.
In this study, we did not find type S-1 S-allele sequences in the populations from Nepal and Bhutan. Based on our identification of the three diverged S-allele groups, the possibility that cultivated buckwheat had multiple origins should also be considered. Considering that remains of buckwheat seeds appeared in west-central Nepal from 3000 BP [40], we should consider the possibility that buckwheat was independently domesticated around the Himalayan region, including Nepal, Bhutan, and southwestern China. To elucidate the origin and global diffusion history of cultivated buckwheat, we would need to expand our sample set to include many more samples of cultivated buckwheat from around the world, as well as samples of wild buckwheat, F. esculentum ssp. ancestrale, from China.
Conclusion
Based on genome-wide SNPs obtained using GBS technology, we successfully estimated the nucleotide diversity (0.0065) of buckwheat, which is comparable to that of other outcrossing plants, such as maize and sunflower. Phylogenetic analyses based on genome-wide SNPs also showed that cultivated buckwheat is composed of two groups, Asian and European. The low nucleotide diversity of the European group and the low differentiation between the Asian and European groups are consistent with genetic bottlenecks associated with dispersion from Asia to Europe, and/or the recent intensified cultivation and selection of buckwheat in Europe. These results based on genome-wide SNPs are congruent with those of previous studies based on isozyme variation. The nucleotide diversity (0.0039) estimated using SNPs in the S-allele region was lower than that estimated using genome-wide SNPs, reflecting the smaller population size of the S-allele region as compared to the genome as a whole. The data also indicated the likelihood of gene flow from wild to cultivated buckwheat and the possibility of multiple origins for cultivated buckwheat. In conclusion, phylogenetic analysis using the S-allele region can offer a better understanding of the origin of cultivation and the global diffusion history of cultivated buckwheat.
Methods
Genotype-by-sequencing data and SNP detection
We used published GBS reads obtained using EcoRI and MseI restriction enzymes (DRA accession number DRA004489, ftp://ftp.ddbj.nig.ac.jp/ddbj_database/dra/fastq/DRA004/DRA004489) [11]. The GBS dataset represented 23 short-styled and 23 long-styled buckwheat landraces originating from a wide range of locations within Eurasia (Additional file 3: Table S1). Low-quality reads and adaptors were trimmed using Trimmomatic-0.36 [41] with the options SLIDINGWINDOW:5:25 and MINLEN:40. The adaptor sequences used were CACGACGCTCTTCCGATCT and ACCGCTCTTCCGATCTGTAA. The trimmed paired-end (PE) reads were mapped against the buckwheat reference sequence (FES_r1.0) using BWA 0.7.15 (Li and Durbin 2009) [42] with the -L 10 and -B 10 options. Single-end reads were filtered from BAM files using samtools 1.3.1. [43]. Variants were called by the samtools mpileup function and bcftools implemented in samtools 1.3.1. Sites with depths of less than 4 and more than 40 were converted to missing data using VCFtools 0.1.13 [44]. Then, sites with proportions of missing data greater than 0.2 were filtered using VCFtools 0.1.13.
Construction of phylogenetic tree and structure analysis
ADMIXTURE v1.22 [45] was used to investigate the population structure of the 46 common buckwheat landraces. For each value of K, ten ADMIXTURE analysis runs were performed with different random seeds. The best run was selected according to the highest value of log likelihood. A neighbor-joining (NJ) tree [46] was constructed using SEQBOOT with 100 replicates, followed by the DNAdist (with the Kimura two-parameter method), Neighbor, and Consense programs from the PHYLIP package 3.6 [47]. The NJ tree was rooted using midpoint rooting and visualized with FigTree 1.4.2 [48]. Principal-component analysis (PCA) based on covariance was performed using Tassel 5.2.37 [49].
The nucleotide diversity and F-statistics
Sites with a proportion of missing data greater than 0.2 were filtered using VCFtools 0.1.13. Then, the nucleotide diversity within species and each classification/group was calculated using VCFtools 0.1.13. Weir and Cockerham’s weighted F-statistics (Fst) [50] was calculated using VCFtools 0.1.13.
Abbreviations
- AFLPs:
-
Amplified fragment-length polymorphisms
- GBS:
-
Genotyping-by-sequencing
- GBSS:
-
Granule-bound starch synthases
- PCA:
-
Principal-component analysis
- S locus:
-
Self-incompatibility locus
- S-ELF3:
-
S-locus early flowering 3
- SI:
-
Self-incompatibility
- SNPs:
-
Simple nucleotide polymorphisms
- SSG2:
-
Short-style-specific gene 2
- SSRs:
-
simple sequence repeats (SSRs)
References
Konishi T, Yasui Y, Ohnishi O. Original birthplace of cultivated common buckwheat inferred from genetic relationships among cultivated populations and natural populations of wild common buckwheat revealed by AFLP analysis. Genes Genet Syst. 2005;80:113–9.
Ohnishi O. On the origin of cultivated common buckwheat based on allozyme analyses of cultivated and wild populations of common buckwheat. Fagopyrum. 2009;26:3–9.
Bonafaccia G, Marocchini M, Kreft I. Composition and technological properties of the flour and bran from common and tartary buckwheat. Food Chem. 2003;80:9–15.
Ahmed A, Khalid N, Ahmed A, Abbasi NA, Latif MSZ, Randhawa MA. (2014) phytochemicals and biofunctional properties of buckwheat: a review. J Agric Sci. 2014;152:349–69.
Giménezbastida JA, Zieliński H. (2015) buckwheat as a functional food and its effects on health. J Agric Food Chem. 2015;63:7896–913.
Ohnishi O, Ohta T. Construction of a linkage map in common buckwheat, Fagopyrum esculentum Moench. Jpn J Genet. 1987;62:397–414.
Konishi T, Iwata H, Yashiro K, Tsumura Y, Ohsawa R, Yasui Y, Ohnishi O. Development and characterization of microsatellite markers for common buckwheat. Breed Sci. 2006;56:277–85.
Yasui Y, Wang Y, Ohnishi O, Campbell CG. Amplified fragment length polymorphism linkage analysis of common buckwheat (Fagopyrum esculentum) and its wild self-pollinated relative Fagopyrum homotropicum. Genome. 2004;47:345–51.
Yabe S, Hara T, Ueno M, et al. Rapid genotyping with DNA micro-arrays for high- density linkage mapping and QTL mapping in common buckwheat (Fagopyrum esculentum Moench). Breed Sci. 2014;64:291–9.
Yabe S, Hara T, Ueno M, et al. Potential of genomic selection in mass selection breeding of an Allogamous crop: an empirical study to increase yield of common buckwheat. Front Plant Sci. 2018;9:276.
Yasui Y, Hirakawa H, Ueno M, et al. Assembly of the draft genome of buckwheat and its applications in identifying agronomically useful genes. DNA res. 2016. 2016;23:215–24.
Matsui K, Hisano T, Yasui Y, Mori M, Walker AR, Morishita T, Katsu K. Isolation and characterization of genes encoding leucoanthocyanidin reductase (FeLAR) and anthocyanidin reductase (FeANR) in buckwheat (Fagopyrum esculentum). J Plant Physiol. 2016;205:41–7.
Katsu K, Suzuki R, Tsuchiya W, et al. A new buckwheat dihydroflavonol 4-reductase (DFR), with a unique substrate binding structure, has altered substrate specificity. BMC Plant biol. 2017. 2017;17:239.
Matsui K, Oshima Y, Mitsuda N, Sakamoto S, Nishiba Y, Walker AR, Ohme-Takagi M, Robinson SP, Yasui Y, Mori M, Takami H. Buckwheat R2R3 MYB transcription factor FeMYBF1 regulates flavonol biosynthesis. Plant Sci. 2018;21(9):276.
Yasui Y, Mori M, Aii J, Abe T, Matsumoto D, Sato S, Hayashi Y, Ohnishi O, Ota T. S-LOCUS EARLY FLOWERING 3 is exclusively present in the genomes of short-styled buckwheat plants that exhibit heteromorphic self-incompatibility. PLoS One. 2012;7:e31264.
Ueno M, Yasui Y, Aii J, Matsui K, Sato S, Ota T. Genetic analyses of the heteromorphic self-incompatibility (S) locus in buckwheat. In: Zhou M, editor. Molecular breeding and nutritional aspects of buckwheat: Academic Press; 2016. p. 411–22.
Garber R, Quisenberry KS. Self-fertilization in buckwheat. J Agric Res. 1927;34:185–90.
Ohnishi O. Search for the wild ancestor of buckwheat III. The wild ancestor of cultivated common buckwheat, and of tatary buckwheat. Econ Bot. 1998;52:123–33.
Konishi T, Ohnishi O. Close genetic relationship between cultivated and natural populations of common buckwheat in the Sanjiang area is not due to recent gene flow between them—an analysis using microsatellite markers. Genes Genet Syst. 2007;82:53–64.
Nei M. Molecular evolutionary genetics. New York: Columbia Univ. Press; 1987.
Elshire RJ, Glaubitz JC, Sun Q, Poland JA, Kawamoto K, Buckler ES, Mitchell SE. A robust, simple genotyping-by-sequencing (GBS) approach for high diversity species. PLoS One. 2011;6:e19379.
Poland JA, Rife TW. Genotyping-by-sequencing for plant breeding and genetics. Plant Genome. 2012;5:92–102.
Poznik GD, Henn BM, Yee MC, Sliwerska E, Euskirchen GM, Lin AA, Snyder M, Quintana-Murci L, Kidd JM, Underhill PA, Bustamante CD. Sequencing Y chromosomes resolves discrepancy in time to common ancestor of males versus females. Science. 2013;341:562–5.
Wright SI, Bi IV, Schroeder SG, Yamasaki M, Doebley JF, McMullen MD, Gaut BS. The effects of artificial selection on the maize genome. Science. 2005;308:1310–4.
Liu A, Burke JM. Patterns of nucleotide diversity in wild and cultivated sunflower. Genetics. 2006;173:321–30.
Huang X, Kurata N, Wei X, Wang ZX, Wang A, Zhao Q, et al. A map of rice genome variation reveals the origin of cultivated rice. Nature. 2012;490:497–501.
Lam HM, Xu X, Liu X, Chen W, Yang G, Wong FL, et al. Resequencing of 31 wild and cultivated soybean genomes identifies patterns of genetic diversity and selection. Nat Genet. 2010;42:1053–9.
Filatov DA, Monéger F, Negrutiu I, Charlesworth D. Low variability in a Y-linked plant gene and its implications for Y-chromosome evolution. Nature. 2000;404:388–90.
Laporte V, Filatov DA, Kamau E, Charlesworth D. Indirect evidence from DNA sequence diversity for genetic degeneration of the Y-chromosome in dioecious species of the plant Silene: the SlY4/SlX4 and DD44-X/DD44-Y gene pairs. J Evol Biol. 2005;18:337–47.
Begun DJ, Holloway AK, Stevens K, Hillier LW, Poh YP, Hahn MW, Nista PM, Jones CD, Kern AD, Dewey CN, Pachter L, Myers E, Langley CH. Population genomics: whole-genome analysis of polymorphism and divergence in Drosophila simulans. PLoS Biol. 2007;5:e310.
VanBuren R, Zeng F, Chen C, Zhang J, Wai CM, Han J, et al. Origin and domestication of papaya Yh chromosome. Genome Res. 2015;25:524–33.
Sachidanandam R, Weissman D, Schmidt SC, Kakol JM, Stein LD, Marth G, et al. A map of human genome sequence variation containing 1.42 million single nucleotide polymorphisms. Nature. 2001;409:928–33.
Abdurakhmonov IY, Buriev ZT, Logan-Young CJ, Abdukarimov A, Pepper AE. Duplication, divergence and persistence in the phytochrome photoreceptor gene family of cottons (Gossypium spp.). BMC Plant Biol. 2010;10:119.
Song H, Gao H, Liu J, Tian P, Nan Z. Comprehensive analysis of correlations among codon usage bias, gene expression, and substitution rate in Arachis duranensis and Arachis ipaënsis orthologs. Sci Rep. 2017;7:14853.
Hunt HV, Shang X, Jones MK. Buckwheat: a crop from outside the major Chinese domestication centres? A review of the archaeobotanical, palynological and genetic evidence. Veg Hist Archaeobot. 2018;27:493–506.
Ohnishi O. Non-shattering habit gene (sht), chlorophyll-deficient and other detrimental genes concealed in natural populations of the wild ancestor of common buckwheat. Fagopyrum. 1999;16:23–8.
de Klerk P, Couwenberg J, Joosten H. Pollen attributable to Fagopyrum in western Eurasia prior to the late medieval: an intercontinental mystery. Palaeogeogr Palaeoclimatol Palaeoecol. 2015;440:1–21.
Ohnishi O. Population genetics of cultivated common buckwheat, Fagopyrum esculentum Moench. VIII. Local differentiation of landraces in Europe and the silk road. Jpn J Genet. 1993;68:303–16.
Underhill PA, Kivisild T. Use of Y chromosome and mitochondrial DNA population structure in tracing human migrations. Annu Rev Genet. 2007;41:539–64.
Knörzer KH. 3000 years of agriculture in a valley of the high Himalayas. Vegetation Hist Archaeobotany. 2007;9:219–22.
Bolger AM, Lohse M, Usadel B. Trimmomatic: a flexible trimmer for Illumina sequence data. Bioinformatics. 2014;30:2114–20.
Li H, Durbin R. Fast and accurate short read alignment with burrows–wheeler transform. Bioinformatics. 2009;25:1754–60.
Li H, Handsaker B, Wysoker A, Fennell T, Ruan J, Homer N, Marth G, Abecasis G, Durbin R. 1000 genome project data processing subgroup. The sequence alignment/map format and SAMtools. Bioinformatics. 2009;25:2078–9.
Danecek P, Auton A, Abecasis G, Albers CA, Banks E, DePristo MA, Handsaker RE, Lunter G, Marth GT, Sherry ST, McVean G, Durbin R. 1000 genomes project analysis group. The variant call format and VCFtools. Bioinformatics. 2011;27:2156–8.
Alexander DH, Novembre J, Lange K. Fast model-based estimation of ancestry in unrelated individuals. Genome Res. 2009;19:1655–64.
Saitou N, Nei M. The neighbor-joining method: a new method for reconstructing phylogenetic trees. Mol Biol Evol. 1987;4:406–25.
PHYLIP package 3.6. http://www.evolution.genetics.washington.edu/phylip.htlm
FigTree 1.4.2. http://tree.bio.ed.ac.uk/software/figtree/
Bradbury PJ, Zhang Z, Kroon DE, Casstevens TM, Ramdoss Y, Buckler ES. TASSEL: software for association mapping of complex traits in diverse samples. Bioinformatics. 2007;23:2633–5.
Weir BS, Cockerham CC. Estimating F-statistics for the analysis of population structure. Evolution. 1984;38:1358–70.
Acknowledgements
We thank T. Ota and H. Hunt for valuable suggestions, and K.L. Farquharson for language-editing support of the manuscript. This study was supported by JSPS KAKENHI (Grant Numbers 18H02177 and 18KK0172).
Funding
This study was supported by JSPS KAKENHI (Grant Numbers 18H02177 and 18KK0172).
The funding body had no role in the design of the study; in the collection, analyses, or interpretation of data; in the writing of the manuscript, and in the decision to publish the results.
Availability of data and materials
The Illumina reads used in the GBS analyses are available in the DDBJ Sequence Read Archive (DRA) (The DRA accession number is DRA004489, ftp://ftp.ddbj.nig.ac.jp/ddbj_database/dra/fastq/DRA004/DRA004489).
Author information
Authors and Affiliations
Contributions
NM analyzed and interpreted the GBS data, and was major contributor in writing the manuscript. YY conceived of the study, participated in its design, performed analyses, and wrote the manuscript. Both authors read and approved the final manuscript.
Corresponding author
Ethics declarations
Authors’ information
Laboratory of Crop Evolution, Division of Applied Bioscience, Graduate School of Agriculture, Kitashirakawa oiwake-cho, Sakyou-ku, Kyoto 606–8501, JAPAN.
Ethics approval and consent to participate
Not applicable.
Consent for publication
Not applicable.
Competing interests
The authors declare that they have no competing interests.
Publisher’s Note
Springer Nature remains neutral with regard to jurisdictional claims in published maps and institutional affiliations.
Additional files
Additional file 1:
Figure S1. Population structure of 46 accessions of buckwheat. A) Cross-validation errors of ancestral population assignment for different numbers of clusters by ADMIXTURE (K = 1–10). Mean cross-validation errors by 10 ADMIXTURE runs are shown with standard deviations. B) Population structure of 46 common buckwheat landraces inferred by ADMIXTURE (K = 2). Ancestry proportions for individuals were estimated using 255,517 SNPs. Color codes (cyan and magenta) of bars indicate typical genotypes of the inferred subpopulations. Red- and blue-colored accessions are short- and long-styled plants, respectively. (PNG 620 kb)
Additional file 2:
Figure S2. Principal-component analysis (PCA) of 23 short-styled plants based on GBS data mapped on 332 S-allelic scaffolds. Graph of the first two axes (x-axis for PC1 and y-axis for PC2) from PCA is shown. The proportion of variance explained by each component is given in parentheses along each axis. (PNG 457 kb)
Additional file 3:
Table S1. List of buckwheat landrcces used in this study. (PDF 51 kb)
Rights and permissions
Open Access This article is distributed under the terms of the Creative Commons Attribution 4.0 International License (http://creativecommons.org/licenses/by/4.0/), which permits unrestricted use, distribution, and reproduction in any medium, provided you give appropriate credit to the original author(s) and the source, provide a link to the Creative Commons license, and indicate if changes were made. The Creative Commons Public Domain Dedication waiver (http://creativecommons.org/publicdomain/zero/1.0/) applies to the data made available in this article, unless otherwise stated.
About this article

Cite this article
Mizuno, N., Yasui, Y. Gene flow signature in the S-allele region of cultivated buckwheat. BMC Plant Biol 19, 125 (2019). https://doi.org/10.1186/s12870-019-1730-1
Received:
Accepted:
Published:
DOI: https://doi.org/10.1186/s12870-019-1730-1