Abstract
Background
Coronavirus disease 2019 (COVID-19) pandemic provided an opportunity for the environment to reduce ambient pollution despite the economic, social and health disruption to the world. The purpose of this study was to investigate the changes in the air quality indexes (AQI) in industrial, densely populated and capital cities in different countries of the world before and after 2020. In this ecological study, we used AQI obtained from the free available databases such as the World Air Quality Index (WAQI). Bivariate correlation analysis was used to explore the correlations between meteorological and AQI variables. Mean differences (standard deviation: SD) of AQI parameters of different years were tested using paired-sample t-test or Wilcoxon signed-rank test as appropriate. Multivariable linear regression analysis was conducted to recognize meteorological variables affecting the AQI parameters.
Results
AQI-PM2.5, AQI-PM10 and AQI-NO2 changes were significantly higher before and after 2020, simultaneously with COVID-19 restrictions in different cities of the world. The overall changes of AQI-PM2.5, AQI-PM10 and AQI-NO2 in 2020 were – 7.36%, – 17.52% and – 20.54% compared to 2019. On the other hand, these results became reversed in 2021 (+ 4.25%, + 9.08% and + 7.48%). In general, the temperature and relative humidity were inversely correlated with AQI-PM2.5, AQI-PM10 and AQI-NO2. Also, after adjusting for other meteorological factors, the relative humidity was inversely associated with AQI-PM2.5, AQI-PM10 and AQI-NO2 (β = − 1.55, β = − 0.88 and β = − 0.10, P < 0.01, respectively).
Conclusions
The results indicated that air quality generally improved for all pollutants except carbon monoxide and ozone in 2020; however, changes in 2021 have been reversed, which may be due to the reduction of some countries’ restrictions. Although this quality improvement was temporary, it is an important result for planning to control environmental pollutants.
Introduction
The coronavirus disease 2019 (COVID-19) pandemic caused by the SARS-CoV-2 virus emerged from Wuhan, China [1] and caused more than 250 million infected people and 5 million death up to 10 November 2020. COVID-19 is associated with multiple affecting factors such as air pollution, sociodemographic indices, which have a two-way relationship [2, 3]. After about 2 years, many countries especially developed countries with mass vaccination, have not yet been able to fully restore their social and economic activities to pre-2020 levels [4, 5]. The economic and social impacts have been significant and coinciding with the pandemic declaration of the disease by the World Health Organization (WHO) on 11 March 2020 [6], many countries put temporary closures of their industries and jobs on the agenda and on the other hand, restrictions within cities were seriously pursued in most countries [7]. These actions include restrictions on inter-city and intra-city traffic, closing businesses, closure of schools and small communities, suspension of tourist visas and so on. Most countries imposed national or local restrictions and closures until early May, after which the restrictions became easy and less severe [8, 9].
Considering the closure of industries and restrictions on community activities, including inter-city transportation and mobility, it is expected that these measures will have significant effects on the amount of air pollutants from industries and vehicles, especially in large cities [10, 11]. Important environmental pollutants include particulate matters (different combinations of solid, liquid and vapor particles), which are mainly in two types of particles with an aerodynamic diameter < 2.5 µm (PM2.5) and < 10 µm (PM10), tropospheric ozone [O3], nitrogen dioxide [NO2], sulfur dioxide [SO2], carbon monoxide (CO) [12]. The UK Department for Transport reported that traffic was significantly reduced (69%) during the holidays, which also had a significant impact on the concentration of environmental pollutants [13]. Nitrogen oxides are caused by the combustion of fossil fuels, which is a good indicator of vehicle-related air pollution. It has been shown that more than 50% and 23% of the total nitrogen oxides (NOX) in developed and developing countries are related to transportation [14]. This pollutant can also react with volatile organic compounds and the sun's ultraviolet rays to produce tropospheric ozone, which poses a serious health threat such as inducing airways inflammation and increasing airway hyperreactivity [15,16,17]. In previous studies, it was shown that particulate pollutants, e.g., PM2.5, PM10, NO2 and ozone were the most important pollutants contributing to COVID-19 mortality and incidence [18,19,20].
A report by the WHO states that about 7 million deaths worldwide every year are due to air pollution [21]. Also, according to the European Environmental Agency reports, 251,000–495,000, 31,000–76,000 and 9400–28,900 premature deaths are attributable to PM2.5, NO2 and O3 reported for the EU-28, respectively [22]. As such, according to the previous studies in India, about 1.24 million deaths are related to air pollution, of which 0.67 million are due to particulate pollutants [23, 24]. A study in China also estimated that reduction in NO2 leads to a reduction of about 8911 deaths [25]. In terms of total economic benefits of the protection of human life, nitrogen dioxide has had the greatest impact, with about $ 10 billion in about 20 major cities surveyed in the world [26]. Previous studies have shown that the highest incidence of air pollution-related diseases is in the Western Pacific and South-East Asia regions, which is associated with heavy industry and air pollution hotspots in these areas [27]. The effects of air pollution on different types of diseases have shown that these exposures play a significant role in the development and progression of a vast variety of diseases, especially in urban areas [24, 25, 28]. As a result of COVID-19, the widespread restrictions and closures in different countries were applied and, as a consequence, the results of studies in the United States [29], Italy [30], the United Kingdom [31], Spain [32], China [33] and India [34] have shown that the concentrations of indicator pollutants are significantly reduced [35], especially for nitrogen dioxide and particulate matter. This reduction in the concentration of pollutants improves the air quality index (AQI) of cities and has positive effects on community health. However, despite the widespread lockdown caused by COVID-19 in some areas, the concentrations of many pollutants, including sulfur dioxide and ozone, have increased [36,37,38,39,40].
So far, in most studies, only a limited number of cities in one or a few countries have been limitedly addressed, while the present study focuses on changes in the AQI of pollutants in important industrial and capital cities of the world before and after 2020 (and before and after mass vaccination programs). Inspecting changes in air pollutants can help to revise air quality guidelines in different countries and enable policymakers and researchers to examine the effects of reducing or increasing air pollution on the prevalence, incidence and burden of several diseases and then, if applicable, to apply preventive measures. On the other hand, the study of changes in AQI relative to their concentration can be interpreted in a more understandable way for the whole community, which is the focus of this study. Finally, the purpose of this study was to investigate the changes in the AQI related to standard pollutants in 87 industrial, densely populated and capital cities in different countries of the world before, during and after 2020.
Methods
Study area and data source
This is an ecological and city-level study based on the “Strengthening the Reporting of Observational Studies in Epidemiology” (STROBE) guideline for observational studies [41], which was designed to examine changes in air quality index (AQI) of various pollutants during the first 121 days of 2020 (due to the implementation of the most COVID-19 restrictions) and comparison with past and next year [40]. The inclusion criteria for the cities study is the World Air Quality Index (WAQI) project report from the website https://aqicn.org/; this report has been published online for employment of air pollution data on COVID-19 by researchers, during the first 6 months of 2015 to 2018 (January 1 to June 30) and full data for 2019 to 2020 has in more than 380 cities [42]. The distribution map of cities has already been published in a study by researchers [40].
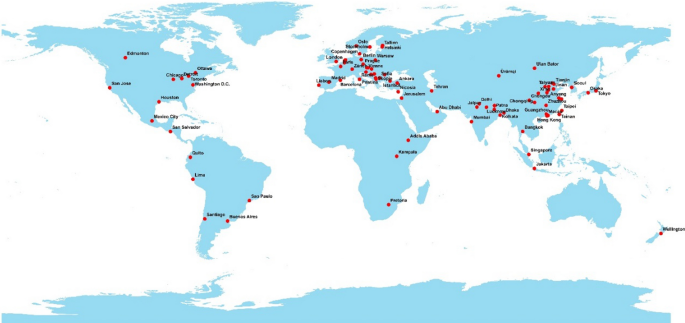
Also, information about different cities from 2021 until April 30 has been published on the organization's website. According to the study objectives, cities that met the main inclusion criteria were included in the study. These criteria for selecting the cities in order of importance are as follows: (1) the AQI of different pollutants and meteorological variables for it should be fully published; (2) it should be the capital of the country and (3) It should be one of the top 100 polluted cities in the world (in terms of particles) according to the report of the World Health Organization https://www.who.int/. If in one country, the information for its capital was not complete, other cities of that country that had the third criterion were used. The choice of a country’s capital and major cities can be important because of the significance of maximizing the lockdown executive restrictions of countries. Latitude and longitude of cities were extracted from Google and the distribution map of cities was drawn in ArcGIS 10.3 software (Fig. 1). Due to the distribution of air pollution monitoring stations and additional information, most of the selected cities are from Asia and Europe. Further information is available on the WAQI website.
Outcome and quantitative variables
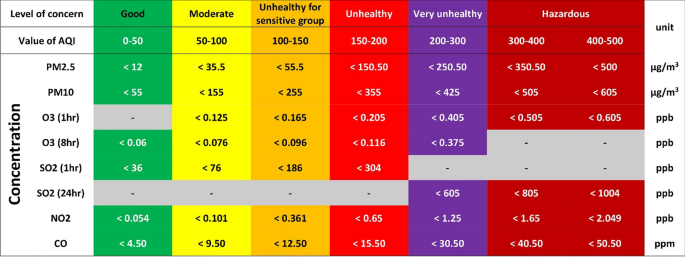
To analyze various air pollution indicators, we extracted the AQI values related to PM2.5, PM10, NO2 and SO2, CO and tropospheric O3 in the first 4 months of 2018 to 2021 and entered the Graph Pad Prism software. The pollutant concentrations were measured as ground-based measurements. The AQI calculation method for each pollutant was shown on the website https://aqicn.org/calculator. The values of the air quality index with respect to different pollutants along with their related color and description of the index are shown in Fig. 2.
Air quality index and cut-off concentrations and health messages. Good air quality is considered satisfactory and air pollution poses little or no risk, moderate air quality is acceptable; however, for some pollutants there may be a moderate health concern, unhealthy for sensitive groups members of sensitive groups may experience health effects, unhealthy everyone may begin to experience health effects, very unhealthy health warnings of emergency conditions and hazardous health alert: everyone may experience more serious health effects
The median (IQR = interquartile range), minimum and maximum daily AQI values were reported at different stations for the cities. The average values of the median for 1 month were considered as the monthly average. Then, the 4-month average was analyzed to compare the mean of 2018 to 2021 with the 2020 baseline as a lockdown scale and the severe restriction of countries. To control the quality of the data, we removed values equal to zero and abnormal numbers such as more than 1000 from the data. Also, each city for which pollutant information was reported for < 25 days (< 80%) was excluded from the study. If the calculated final outcome values were abnormal, the quality of the data in that city was rechecked to ensure the accuracy of the information. The outcomes examined include the percentage of changes in AQI pollutants compared to 2020 and the average AQI pollutants for each city.
In this study, we tried to use the average values of each year as a scale of comparison with next years, which shows the impact of lockdown in 2020 (severe restrictions) and 2021 (easier restrictions or coinciding with mass vaccination) with previous years. To investigate the effect of the restrictions in 2020 and 2021, the percentage difference of AQI values between different years was calculated by the following formulas [43]:
%ΔAQI2020x indicates the percentage of AQI changes compared to 2018 and 2019. AQI2020x represents the average AQI of pollutant x in 2020 and AQI2019x or AQI2018x is the average AQI of pollutant x in 2019 or 2018. For the percentage difference between 2020 and 2021, the same variables are defined. In this case, if the percentage of positive difference is reported, it indicates an increase in the values of the AQI in 2020 compared to other years and if it is negative, it means a decrease in AQI. In order to reduce the bias of changes in air pollutants, climate variables that have a direct and indirect effect on the concentration of pollutants were extracted for each city.
Statistical analysis
Descriptive data of the study were presented using the median (IQR), maximum, minimum and first and third quartile reports using box and whiskers diagrams. AQI of ambient pollutants variables (PM2.5, PM10, NO2, SO2, CO and tropospheric O3) was stratified by Human Development Index (HDI) and Gross National Income (GNI). The statistical significance of mean differences in AQI variables among countries (developed or developing) and (L&LM: low and lower-middle income: < 4045$, upper-middle income: 4046–12,535$ and high income: > 12,535) categories was assessed using independent-sample t-tests. The United Nations considers countries with HDI ≥ 0.788 as “developed” and any score below that as “developing” [44]. Median and IQR for AQIs were also calculated stratified by HDI and GNI categories. The average of AQI for each city was also mapped using GraphPad Prism software. The data have been analyzed with GraphPad Prism and SPSS software. We assessed the correlation between AQI variables and meteorological parameters using Pearson and Spearman rank correlation coefficients based on normality of data. In addition, the statistical significance of differences in AQI variables among years (2020–2018, 2020–2019, 2021–2020) and GDP (high and low) categories was assessed using paired-sample t-tests [10]. We used multivariable linear regression to analyze AQIs in combination with meteorological parameters to each other.
Results
Description analysis of AQI variation
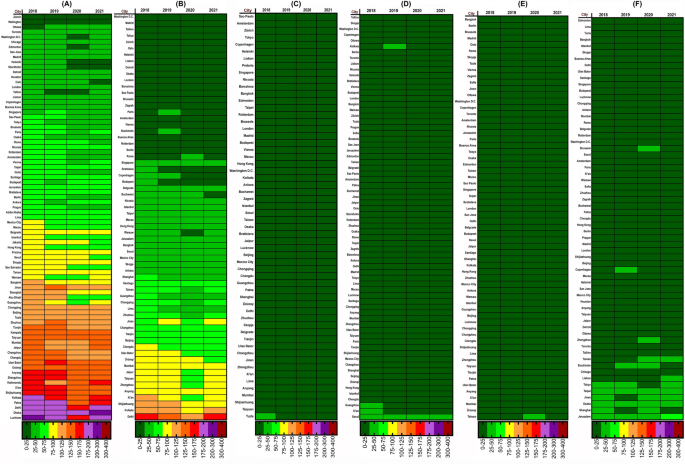
A total of 87 industrial, polluted and crowded megacities from 57 different countries were included in the study. Of these, 58 cities are the main capitals of the countries and the rest are among the 100 most polluted and industrial cities in the world. Figure 3 shows the average AQI of various pollutants in cities with complete data in the first 4 months of 2018 to 2021 (January 1 to April 30). The results showed that Zurich (2.31), Tallinn (8.65), Washington (0.18), Tallinn (3.98) and Edmonton (0.10) had the lowest AQIs for PM2.5, PM10, SO2, NO2 and O3, respectively. During 2020, the cities of Dhaka (182.18), Delhi (106.36), Ulaanbaatar (11.19), Seoul (26.86) and Jerusalem (36.62) also had the highest values of AQI, respectively. In terms of AQI-CO, many cities had average values of 0.10 in 2020 and Istanbul with 19.69 had the highest AQI-CO.
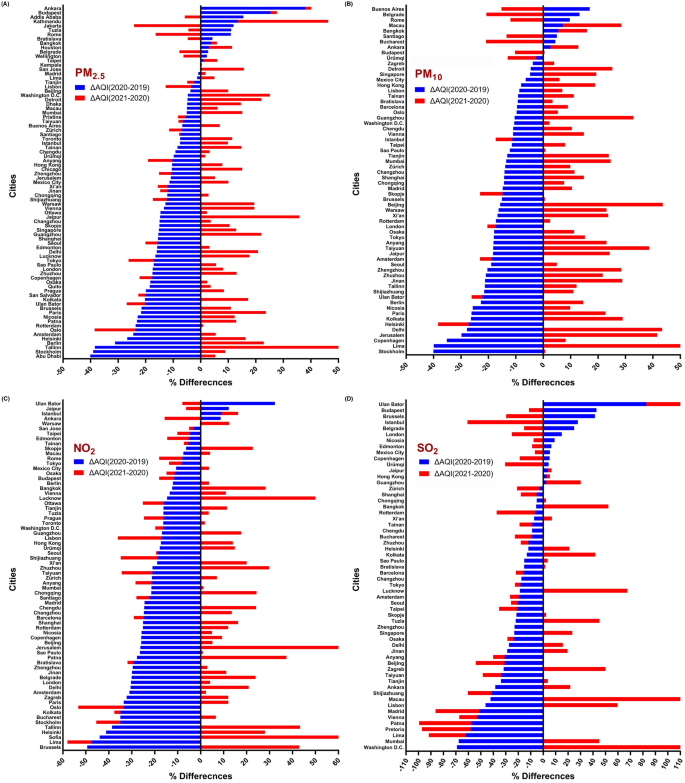
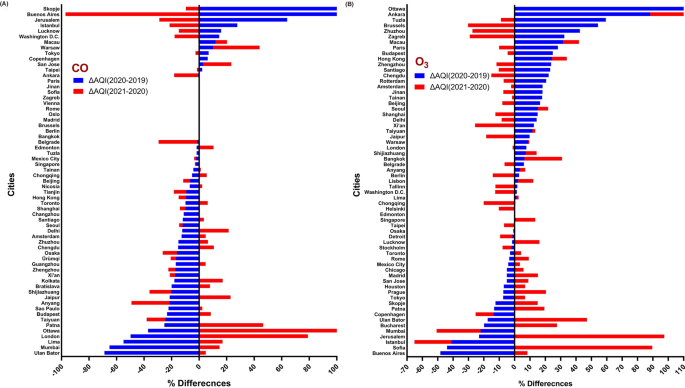
According to the findings in Fig. 3, most of the problems caused by air pollution are related to particles, which are shown in Fig. 3A, B. AQI values in these pollutants have been reported for them up to 200–300 (Very Unhealthy). All cities surveyed had AQI < 100 for SO2, NO2, CO and O3. The results are shown in Figs. 4 and 5 to determine the percentage difference between the values of 2020 and 2019 and 2021 (before, during and after of lockdown).
According to Fig. 3, cities in which the quality index has decreased or increased, compared to 2019, could be distinguished. Based on Fig. 4, the cities of Abu Dhabi (− 40.13%) and Stockholm (− 40.05%) have the highest percentage decrease of PM2.5 and PM10 and the cities of Ankara (+ 37.97%) and Buenos Aires (+ 16.95%) have the highest percentage increase in 2020 compared to 2019.
Actually, in cities with a positive difference percentage, the AQI has not only decreased, but also increased. The results show that only 25% (17/67) and 13% (7/55) of the cities that had lower AQI-PM2.5 and AQI-PM10 in 2020 than in 2019 had also a decreasing trend in 2021, but in other cases, AQI values have increased during 2021.
The cities of Washington (-69.15%) and Ulaanbaatar (+ 82.78%) had the most negative and positive differences in terms of AQI-SO2 in 2020 compared to 2019, respectively, although air quality in Washington has declined in 2021 and has had the highest increase (+ 206.34%) among all cities.
Also, in terms of NO2 pollution, Brussels (− 49.41%) and Ulaanbaatar (+ 32.33%) reported the most negative and positive differences in 2020 compared to 2019, respectively.
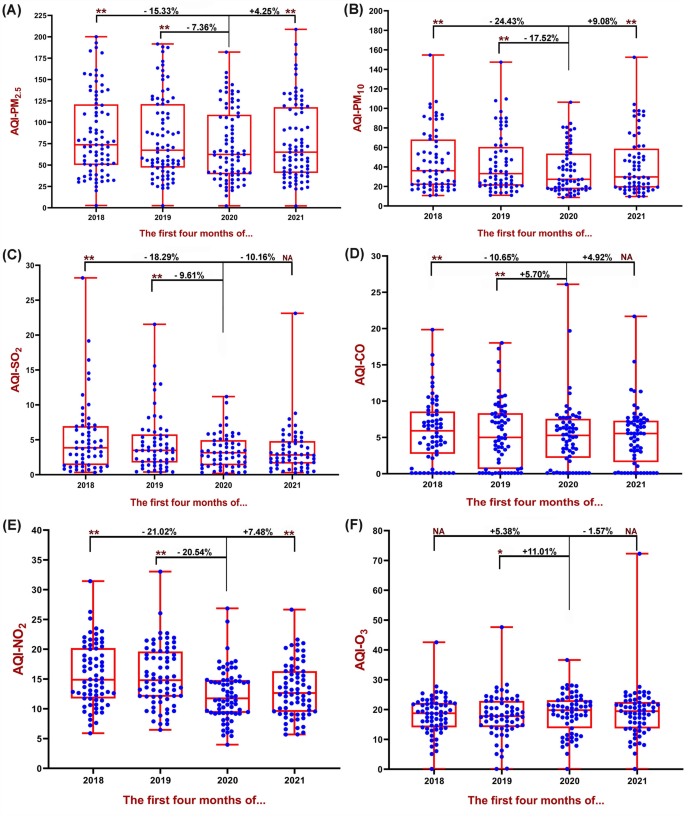
The result of AQI-CO illustrated that the cities of Ulaanbaatar (− 68.81%) and Skopje (+ 6089.22%) had the highest negative and positive differences compared to 2019, although in 2021 AQI-CO has significantly increased in the Ottawa (+ 124.64%). Another major pollutant in air quality is tropospheric O3, which has the highest percentage of negative and positive differences in 2020 compared to 2019 for the cities of Brussels (− 48.29%) and Ottawa (+ 9515.12%). The percentage difference of AQI for pollutants in other cities between 2020 with 2019 and 2021 can be seen in Figs. 4 and 5. The results showed that in general, AQI had a significant relationship between different pollutants in cities with complete data between 2020, 2018 and 2019 (P < 0.01), except for AQI-O3, which there was no statistically significant report (P > 0.05) between 2020 and 2018. Figure 6 (box and whiskers chart) shows the median values, along with the minimum, maximum and first and third quarters of the data for all cities. Also, the results of the Wilcoxon test analysis with star and NA symbols are shown in Fig. 5. It also reports the percentage difference between the median values of 2020 and 2018 as well as 2019 and 2021.
Box and whiskers plot depicting AQI variations for 87 cities in the World. The data show average of the first 4 months of 2018–2021 (January 1st–April 30th). A AQI-PM2.5 variation, B AQI-PM10 variation, C AQI-SO2 variation, D AQI-CO variation, C AQI-NO2 variation and C AQI-O3 variation. **P < 0.01, *P < 0.05, NA > 0.05
The results showed that the values of the AQI-PMs have decreased during rising the COVID-19 in 2020 (7.36% for PM2.5 and 17.52% for PM10), but during 2021, these values increased significantly (4.25% for PM2.5 and 9.08% for PM10). Also, AQI-SO2 has decreased compared to 2019 (9.61%), but for CO (5.7%) and O3 (11.01%), these values have increased. Also, the difference between the average AQI-NO2 has significantly decreased in 2020 compared to 2019 (20.54%) and 2018 (21.02%); however, these values have increased significantly in 2021 (7.48%).
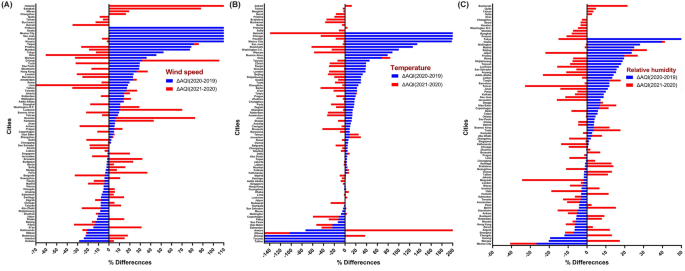
Figure 7 is drawn to compare the percentage change of different cities for meteorological variables in 2020 compared to 2019 and 2021. Calcutta (− 28.59%), Tallinn (− 20,750.64%) and Mexico City ( − 26.77%) had the highest percentage of decrease in wind speed, temperature and relative humidity, while Pretoria (+ 1734.55%), Helsinki (+ 913.18%) and Tokyo (+ 85.37%) had the highest percentage increase in 2020 compared to 2019.
Figure 8 shows the box and whiskers diagrams for meteorological variables in the 3 years from 2019 to 2021. According to the findings of the study, the average temperature, wind speed and relative humidity in 2020 compared to 2019 have increased to values of + 37.60%, + 7.00% and + 1.01%, respectively (P < 0.05)
Correlation and regression analysis of meteorological variables and AQI
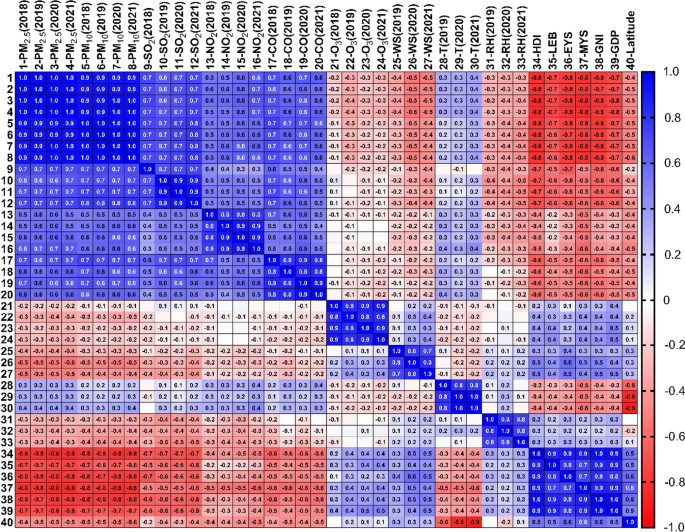
The association between the AQI of different pollutants and meteorological variables for 2019, 2020 and 2021 is reported in Fig. 9.
The results of correlation analysis showed that there was a significant negative correlation between AQI-PMs and wind speed in all years (P < 0.05). However, there was a negative and significant correlation between wind speed and AQI-SO2 and AQI-NO2 only in 2020 (P < 0.05).
Also, a positive and significant correlation was observed between wind speed and AQI-O3 in 2020 and 2021 (r = 0.27 in 2020 and r = 0.39 in 2021; P < 0.05). AQI-PM2.5 and temperature also showed a positive and significant correlation in all 3 years (P < 0.01). Furthermore, a negative and significant difference was observed between relative humidity and AQI-PMs, as well as SO2 and NO2 in all years (P < 0.05).
The results of multiple regression analyses for the AQI of each pollutant by adjusting the meteorological variables are reported in Table 1. The results showed a correlation among AQI-PMs and AQI-SO2 with relative humidity (β = − 1.55 for PM2.5, β = − 0.88 for PM10 and β = − 0.10 for SO2, P < 0.001).
Socioeconomic and dependent variables
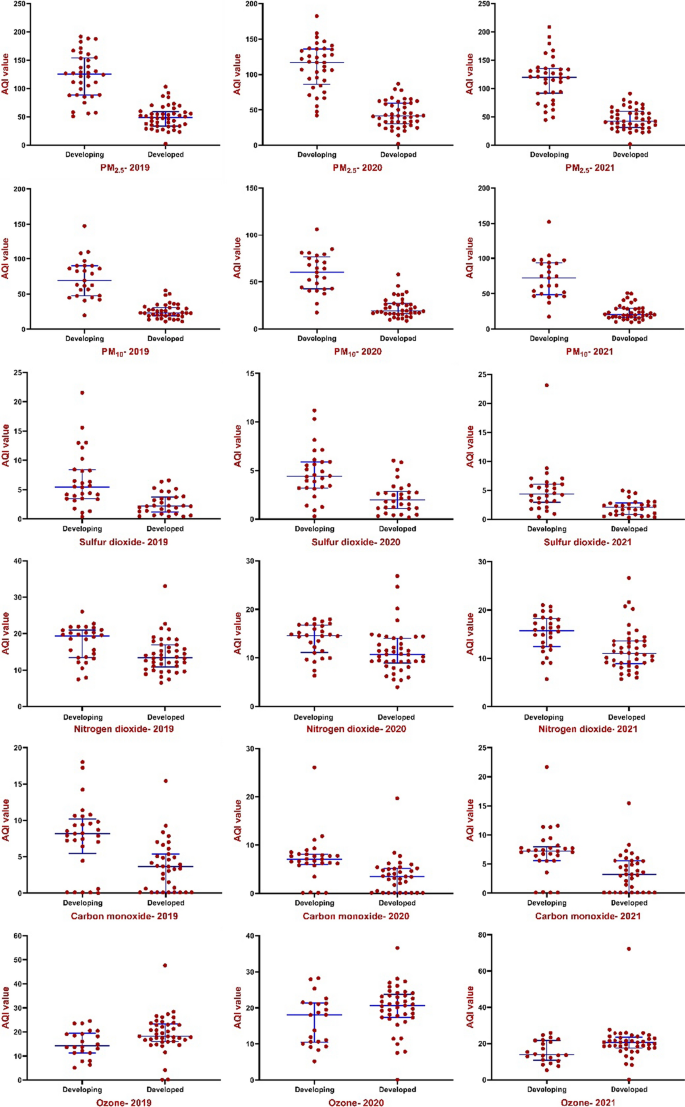
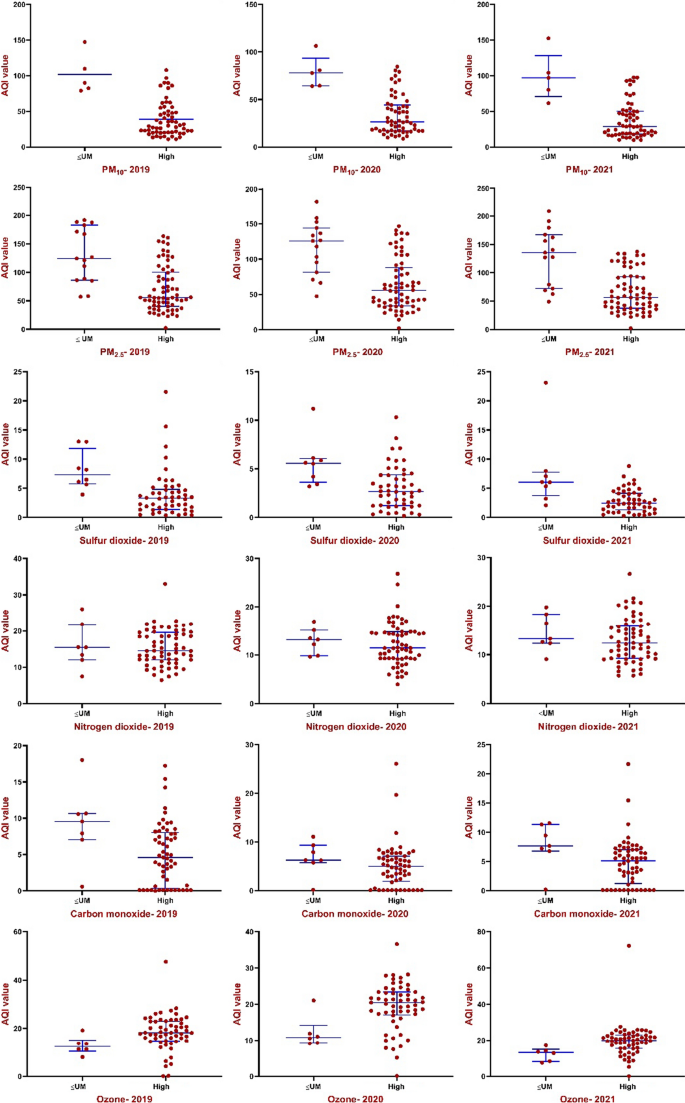
Other analyses were accomplished for country categories (based on HDI and GNI) to investigate the average AQI variables in different categories. There were significant differences between AQI parameters in developed and developing, as well as high-income and < UMI countries (P < 0.01) (Fig. 10). Among developing countries, the median (IQR) of AQI-PM2.5, AQI-PM10, AQI-SO2 and AQI-NO2 were 117.00 (IQR: 86.00–136.00), 60.20 (IQR: 42.60–76.50), 4.41 (IQR: 3.20–5.89), 14.60 (IQR: 11.10–16.80), which increased with decreasing national HDI (P < 0.01). Also, the mentioned AQI variables in high-income countries were lower than upper-middle income countries and increased with the decrease in national HDI (Figs. 10, 11). Furthermore, a negative and significant correlation was observed between HDI, GDP and GNI with AQI-PMs and AQI-CO (r > 0.65 for PMs and r > 0.40 for CO; P < 0.01). On the other hand, there is a positive association between HDI, GDP and GNI and AQI-SO2, AQI-NO2 and AQI-O3 in all 3 years (P < 0.01). Furthermore, a negative and significant difference was observed between HDI, GDP and GNI, socio-economic variables and temperature, as well as a positive correlation for relative humidity and wind speed (P < 0.05). There is a positive association between wind speed and latitude, but a negative association for temperature and latitude (P < 0.01).
Discussion
The results of the present study showed that the AQI of the first 4 months of the year in most cities in 2020, compared to the period before the COVID-19 pandemic (2019), has significantly improved; however, this has been reversed for many cities in 2021 (Figs. 4, 5). What is certain is that most large and industrial cities are exposed to particulate pollutants and nitrogen oxides [45], which according to the findings of the present study, the AQI-PM2.5 and NO2 during the lockdown period in 2020 have increased significantly (Fig. 6). These results belong to the outdoor environment, but indoor environments may be different [46,47,48]. Our findings are in line with several published studies that were indicative of reducing these pollutants due to lockdown and widespread restrictions in countries from the beginning of January to the end of May [11, 49,50,51,52]. Studies show that the Community Mobility Index, which represents the activities of educational sectors, transport, industries and social places, has significantly decreased during the first half of 2020 and has been effective in distributing concentrations of environmental pollutants [40]. Moreover, Fig. 3A clearly shows that in most of the cities surveyed, which were in poor condition in terms of AQI-PM2.5 in the same period before the pandemic, mentioned index was improved during the first 4 months of 2020 and with the establishment of COVID-19 restrictions and its related factors. Studies have shown that the use of e-Learning during the COVID-19 era might significantly reduce traffic and driving and thus reduce environmental pollution [53, 54].
The reduction of pollutants is also seen in Fig. 3B for PM10. Although PM10 concentrations in the environment are usually higher than PM2.5 but associated with PM2.5 pollution are greater in urban areas. Given the health problems caused by PM2.5, this improvement in the AQI will be noteworthy for health policymakers. The results showed that the highest levels of AQI-PM2.5 were observed in the cities of Patna, Delhi and Dhaka in 2019 and in the cities of Lucknow, Delhi, Dhaka, in 2020, respectively. Of the four cities mentioned, 3 are related to India and the other is related to Bangladesh, which are countries with low air quality and income. One of the reasons for the high number of PMs in these cities, in addition to the large transport fleet [55], is the use of household fuels such as wood and dry waste in these cities [10, 34, 56]. Also, in low-income or developing countries, due to the weak economy and lack of full implementation of environmental laws, the AQI in their cities is usually unfavorable [57, 58], which is in line with the results of our study.
India has been one of the countries with a sharp decline in the index of retail and recreation activities, transit stations and workplaces [40] and as a result, the sharp decline in AQI values in Indian cities may be due to this. It should be noted that to interpret the results of PM reduction, it is important to know the source of their production. PMs in an urban environment can be caused by the combustion of fossil fuels in vehicles as well as by emissions from various industries and natural events [59,60,61,62]. On the other hand, phenomena such as inversion in densely populated and industrial cities can act as a cover and prevent the spread of particles and pollutants in wider environments, thereby increasing the concentration of pollutants in the city. This phenomenon is more observed in areas with cold weather and cloudless skies, especially in winters [10, 63]. Overall, the findings showed that the average AQI-PM2.5 in 2020 compared to 2019 and 2018 was decreased by about 7% and 15% and AQI-PM10 declined by 18% and 24%, which indicates an overall improvement in PMs quality (Fig. 6A, B). It should be noted that many air quality monitoring stations may be located in areas close to major roads and airports, which will show high particulate matter levels.
Also, the average AQI-NO2 in 2020, compared to 2019 and 2018, has decreased by about 21% (Fig. 6E). The results of studies have shown that as the restrictions caused by COVID-19 in countries increased, the intensity reduction of PMs pollutants and NO2 have also increased [40, 64]. It has also shown that Gross Domestic Product (GDP) in most countries has declined during the second quarter of 2020, reflecting the lockdown impact on the economy and industrial closures [40]. Higher concentrations of pollutants are higher in developing cities except for ozone concentrations (Figs. 10, 11). Several studies showed that developing countries are in a poor situation in terms of air pollution than developed countries, which is due to strict environmental requirements and high-income status in developed countries [57, 65]. On the other hand, during the global economic recession from 2003 to 2007, it was shown that the concentration of NO2 emissions has decreased by about 20% [66].
Reports from European organizations revealed that the most important source of NO2 emissions in European countries is related to road transport [39, 67, 68]. It has also been reported that during the years from 2017 to 2018, the concentrations of NO2, SO2 and CO were decreased by 4.1, 6.7 and 4.3%, respectively [67]. In a study of 20 major cities around the world, Sannigrahi et al. reported that restrictions in countries between February 1 and May 11 have reduced the amount of NO2 by about 28 tons and CO by about 184 tons in these 20 cities [26]. On the other hand, it has reduced about 1310, 401 and 430 premature deaths associated with NO2, PM2.5 and PM10. However, previous studies have shown a significant association between air pollution and COVID-19 disease [69,70,71].
In general, AQI-SO2 has decreased by 11% in 2020 compared to 2019, which can be referred to as the closure of medium and large industries and travel restrictions in the transport fleet, which are the most important sources of sulfur production [72]. Also, the production of acid rain is of effects associated with high concentrations of SO2 and NO2; it has detrimental effects on the environment and aquatic ecosystems. In addition, acid rain on fertile lands washes away minerals and devalues soil [10, 73]. A study in Delhi, India, showed that lockdown significantly reduced the concentrations of SO2 and nitrogen oxide [74]. Also, the results of a study in New York showed that AQI-SO2 was decreased from 1.29 to 0.52 (59.68%) during the lockdown period and was decreased from 30.45 to 20.20 (33.66%) for NO2 [75].
Ozone levels compared to 2019 have generally increased by about 11% (− 48 to + 88%), which is consistent with various studies [36,37,38, 40]. Two studies in Barcelona, Spain [76], and Rajasthan, India [77], showed that, during the lockdown period, ozone concentrations were increased by about 50% and 45%, respectively. In addition, Wang et al. estimated that urban areas have significantly higher ozone levels than rural areas (145% vs. 46%) [76]. Studies have shown that NO2 is formed from the reaction of NO with ozone [78, 79] and if NO2 levels decrease, ozone levels are likely to increase, which an increase in AQI-O3 levels was observed in 60% of the cities of the present study, compared to 2019. Actually, due to the fact that ozone is a secondary pollutant and is dependent on precursors such as nitrogen oxides and volatile organic compounds (VOC), an increase in ozone concentration in the atmosphere can be expected if the emission of its precursors decreases [80].
Finally, it should be noted that meteorological variables can also, directly and indirectly, affect the concentration of pollutants in an area, which should be considered in interpreting the results of COVID-19 disease [3, 81]. Among the effects of meteorological variables are emission, transport, deformation and deposition [82]. The results of regression analyses showed that there is a significant inverse association between relative humidity and AQI-PM2.5, AQI-PM10 and AQI-SO2 in the presence of climatic variables of temperature and wind speed, while this association was reported to be positive and insignificant for ozone (Table 1). A study in three major cities in China has shown that the association between temperature and ozone is directly and the correlation between wind speed and air pollutants is the inverse [82], which is consistent with the results of our study. Another study in Turkey showed that low ambient temperature and low wind speed were associated with high concentrations of PMs and SO2 [83]. It is also commonly mentioned that ozone production can be limited in low temperature and high rainfall conditions [84].
Strengths and limitation
To our best knowledge, this is among the first studies to examine the changes in AQI before, during and after 2020. In this study, considering the selection of large, industrial and capital cities as a sample size, the effects of lockdown and the executive constraints of countries can be further examined, compared and measured. On the other hand, according to the conducted literature review, most restrictions have been implemented in the first 4 months of 2020 and countries have reduced the severity of restrictions from May onwards; thus, in this study, the first 4 months in different years were intended as the basis of studies. In addition, the advantage of this study compared to other studies is the investigation of all indicators of standard pollution, which in the presence of each other, gives us a better view of the air quality of a city. However, the COVID-19 and environmental studies have several limitations that must be considered in each ecological study [85]. The first limitation is the location of air quality monitoring stations, which was not considered in this study due to lack of access. Also, the exact history of lockdowns is different for each city, which cannot be separated, but in general, considering the mean median of the data for several months and in different years, the impact of lockdowns with these differences is evident. This work did not take into account the specific situation of the epidemic situation of COVID-19 in various countries, the strict degree of epidemic prevention measures taken by various countries and the differences in the level of industrialization, urbanization and modernization of the cities. The reported result of higher AQI in high-income countries might confound by having good record stations in precise estimates on AQI. On the other hand, the elimination of some pollutants and especially meteorological variables (not adjusted in regression analysis) due to the lack of complete reporting of their values in all stations is another limitation of this study. Furthermore, the lack of access to long-term information on pollutants in cities was led to the consideration of fewer cities and comparison only with 2018 and 2019. Other factors such as improvement in AQI criteria, access to technologies services and increased awareness of the disease may occur also in countries with upper-level income that do not consider in this study. Failure to consider factors such as the transfer of particulate matters from one area to another and the factors affecting them in studies of environmental pollutants, especially particulate matters, are considered design limitations.
Conclusions
Although the COVID-19 pandemic had irreparable destructive effects on human societies, it has been able to improve the air quality of most areas with executive restrictions in different countries. Findings illustrated that about 83, 86, 91, 76, 79 and 41% of cities revealed a decrease in AQI values of PM2.5, PM10, NO2, SO2, CO and O3 in 2020 compared to 2019. Also, the results showed that AQI generally improved for all pollutants except carbon monoxide and ozone in 2020, compared to 2019, in the 87 cities (8–25%); however, changes in 2021 compared to 2020 have been reversed and AQI values for PM2.5, PM10, CO and NO2 pollutants have generally increased (4–7%) due to the reduction of countries restrictions. In general, the implementation of strict laws related to COVID-19 restrictions can show the executive power of countries in reducing pollutants in non-crisis situations. Although this quality improvement was temporary, it is an important result that health policymakers can use to improve environmental conditions and maintain human health.
Availability of data and materials
All data generated or analyzed during this study are included in this published article (“Methods” section) and publicly available dataset. Data related to the AQI variables available in https://aqicn.org/ website. Also, the datasets used and/or analyzed during the current study are available from the corresponding author on reasonable request.
Abbreviations
- AQI:
-
Air quality index
- CO:
-
Carbon monoxide
- COVID-19:
-
Coronavirus disease 2019
- GDP:
-
Gross domestic product
- IQR:
-
Interquartile range
- NO2 :
-
Nitrogen dioxide
- O3 :
-
Ozone
- PM:
-
Particulate matter
- SO2 :
-
Sulfur dioxide
- STROBE:
-
Strengthening the reporting of observational studies in epidemiology
- SD:
-
Standard deviation
- WAQI:
-
World Air Quality Index
- SARS-CoV-2:
-
Severe acute respiratory syndrome coronavirus 2
- UK:
-
United Kingdom
- US:
-
United States
- USEPA:
-
US Environmental Protection Agency
- WHO:
-
World Health Organization
References
Guan W-J et al (2020) Clinical characteristics of coronavirus disease 2019 in China. N Engl J Med 382(18):1708–1720
Sarmadi M et al (2021) COVID-19, body mass index and cholesterol: an ecological study using global data. BMC Public Health 21(1):1712
Sarmadi M, Marufi N, Kazemi Moghaddam V (2020) Association of COVID-19 global distribution and environmental and demographic factors: an updated three-month study. Environ Res 188:109748
Hughes JW, Hughes CO, Seneca JJ (2020) Coronavirus economic recuperation continues: New Jersey and the nation—not yet back to the future. Rutgers University. p. 38
Martin R (2021) Rebuilding the economy from the COVID crisis: time to rethink regional studies? Reg Stud Reg Sci 8(1):143–161
World Health Organization. WHO Director-General’s opening remarks at the media briefing on COVID-19. 11 March 2020. 2020 [cited 2021 15 June]; Available from: https://www.who.int/director-general/speeches/detail/who-director-general-s-opening-remarks-at-the-media-briefing-on-covid-19---11-march-2020
Tison GH et al (2020) Worldwide effect of COVID-19 on physical activity: a descriptive study. Ann Intern Med 173(9):767–770
Zhang H et al (2021) Global association between satellite-derived nitrogen dioxide (NO2) and lockdown policies under the COVID-19 pandemic. Sci Total Environ 761:144148
Health, A.G.D.o. Easing the COVID-19 restrictions—no time for complacency, An opinion piece by the Australian Government’s Deputy Chief Medical Officer, Professor Michael Kidd. 2020 [cited 2021 20 June]; Available from: https://www.health.gov.au/news/easing-the-covid-19-restrictions-no-time-for-complacency
Vadrevu KP et al (2020) Spatial and temporal variations of air pollution over 41 cities of India during the COVID-19 lockdown period. Sci Rep 10(1):16574
Zhang Z et al (2020) Unprecedented temporary reduction in global air pollution associated with COVID-19 forced confinement: a continental and city scale analysis. Remote Sens 12(15):2420
Johannson KA, Balmes JR, Collard HR (2015) Air pollution exposure: a novel environmental risk factor for interstitial lung disease? Chest 147(4):1161–1167
GOV.UK. Department for Transport publishes official statistics relating to the transport system in Great Britain. 2021 [cited 2021 20 April]; Available from: https://www.gov.uk/government/organisations/department-for-transport/about/statistics
Crippa M et al (2018) Gridded emissions of air pollutants for the period 1970–2012 within EDGAR v4.3.2. Earth Syst Sci Data 10(4):1987–2013
Alexis NE et al (2010) Low-level ozone exposure induces airways inflammation and modifies cell surface phenotypes in healthy humans. Inhal Toxicol 22(7):593–600
Larsen ST et al (2010) Ozone increases airway hyperreactivity and mucus hyperproduction in mice previously exposed to allergen. J Toxicol Environ Health A 73(11):738–747
Scannell C et al (1996) Greater ozone-induced inflammatory responses in subjects with asthma. Am J Respir Crit Care Med 154(1):24–29
Katoto PDMC et al (2021) Acute and chronic exposure to air pollution in relation with incidence, prevalence, severity and mortality of COVID-19: a rapid systematic review. Environ Health 20(1):41
Páez-Osuna F, Valencia-Castañeda G, Rebolledo UA (2022) The link between COVID-19 mortality and PM2.5 emissions in rural and medium-size municipalities considering population density, dust events, and wind speed. Chemosphere 286:131634
Linares C et al (2021) Short-term associations of air pollution and meteorological variables on the incidence and severity of COVID-19 in Madrid (Spain): a time series study. Environ Sci Eur 33(1):107
World Health Organization. Air pollution. 2021 [cited 2021 July 9]; Available from: https://www.who.int/health-topics/air-pollution#tab=tab_1
European Environment Agency. Air quality in Europe: 2020 report. 2021 Sep 2020; 164]. Available from: https://www.eea.europa.eu//publications/air-quality-in-europe-2020-report
Balakrishnan K et al (2019) The impact of air pollution on deaths, disease burden, and life expectancy across the states of India: the Global Burden of Disease Study 2017. The Lancet Planetary Health 3(1):e26–e39
Chakraborty P et al (2020) Exposure to nitrogen dioxide (NO2) from vehicular emission could increase the COVID-19 pandemic fatality in India: a perspective. Bull Environ Contam Toxicol 105(2):198–204
Chen K et al (2020) Air pollution reduction and mortality benefit during the COVID-19 outbreak in China. The Lancet Planetary Health 4(6):e210–e212
Sannigrahi S et al (2021) Examining the status of improved air quality in world cities due to COVID-19 led temporary reduction in anthropogenic emissions. Environ Res 196:110927
Babatola SS (2018) Global burden of diseases attributable to air pollution. J Public Health Afr 9(3):813–813
Achakulwisut P et al (2019) Global, national, and urban burdens of paediatric asthma incidence attributable to ambient NO2 pollution: estimates from global datasets. The Lancet Planetary Health 3(4):e166–e178
Liu Q et al (2021) Spatiotemporal impacts of COVID-19 on air pollution in California, USA. Sci Total Environ 750:141592
Briz-Redón Á, Belenguer-Sapiña C, Serrano-Aroca Á (2021) Changes in air pollution during COVID-19 lockdown in Spain: a multi-city study. J Environ Sci 101:16–26
Wyche KP et al (2021) Changes in ambient air quality and atmospheric composition and reactivity in the South East of the UK as a result of the COVID-19 lockdown. Sci Total Environ 755:142526
Baldasano JM (2020) COVID-19 lockdown effects on air quality by NO2 in the cities of Barcelona and Madrid (Spain). Sci Total Environ 741:140353
Bao R, Zhang A (2020) Does lockdown reduce air pollution? Evidence from 44 cities in northern China. Sci Total Environ 731:139052
Gautam AS et al (2021) Temporary reduction in air pollution due to anthropogenic activity switch-off during COVID-19 lockdown in northern parts of India. Environ Dev Sustain 23(6):8774–8797
Gössling S, Humpe A (2020) The global scale, distribution and growth of aviation: implications for climate change. Global Environ Change 65:102194
Wang Y et al (2021) Enhanced atmospheric oxidation capacity and associated ozone increases during COVID-19 lockdown in the Yangtze River Delta. Sci Total Environ 768:144796
Siciliano B et al (2020) Increased ozone levels during the COVID-19 lockdown: analysis for the city of Rio de Janeiro, Brazil. Sci Total Environ 737:139765
Brancher M (2021) Increased ozone pollution alongside reduced nitrogen dioxide concentrations during Vienna’s first COVID-19 lockdown: significance for air quality management. Environ Pollut 284:117153
Higham JE et al (2021) UK COVID-19 lockdown: 100 days of air pollution reduction? Air Qual Atmos Health 14(3):325–332
He C et al (2021) Global, continental, and national variation in PM2.5, O3, and NO2 concentrations during the early 2020 COVID-19 lockdown. Atmos Pollut Res 12(3):136–145
Elm EV et al (2007) Strengthening the reporting of observational studies in epidemiology (STROBE) statement: guidelines for reporting observational studies. BMJ 335(7624):806–808
World Air Quality Index. Air Quality Historical Data Platform. 2021 [cited 2021 25 April]; Available from: https://aqicn.org/contact/.
Singh V et al (2020) Diurnal and temporal changes in air pollution during COVID-19 strict lockdown over different regions of India. Environ Pollut 266:115368
Xu Z et al (2017) Socioeconomic status is associated with global diabetes prevalence. Oncotarget 8(27):44434
Zhao X et al (2019) Spatiotemporal variation in PM2.5 concentrations and their relationship with socioeconomic factors in China’s major cities. Environ Int 133:105145
Du W et al (2021) Influence of COVID-19 lockdown overlapping Chinese Spring Festival on household PM2.5 in rural Chinese homes. Chemosphere 278:130406
Noorimotlagh Z et al (2021) A systematic review of possible airborne transmission of the COVID-19 virus (SARS-CoV-2) in the indoor air environment. Environ Res 193:110612
Liu H et al (2021) Investigating SARS-CoV-2 persistent contamination in different indoor environments. Environ Res 202:111763
Bauwens M et al (2020) Impact of coronavirus outbreak on NO2 pollution assessed using TROPOMI and OMI observations. Geophys Res Lett 47(11):e2020GL087978
Kazakos V, Taylor J, Luo Z (2021) Impact of COVID-19 lockdown on NO2 and PM2.5 exposure inequalities in London, UK. Environ Res 198:111236
Ravindra K et al (2021) Impact of COVID-19 lockdown on ambient air quality in megacities of India and implication for air pollution control strategies. Environ Sci Pollut Res 28(17):21621–21632
Venter ZS et al (2020) COVID-19 lockdowns cause global air pollution declines. Proc Natl Acad Sci 117(32):18984–18990
Favale T et al (2020) Campus traffic and e-Learning during COVID-19 pandemic. Comput Netw 176:107290
Agarwal A et al (2021) Effect of E-learning on public health and environment during COVID-19 lockdown. Big Data Mining Anal 4(2):104–115
Li L et al (2020) Air quality changes during the COVID-19 lockdown over the Yangtze River Delta Region: an insight into the impact of human activity pattern changes on air pollution variation. Sci Total Environ 732:139282
Kumar P et al (2020) Temporary reduction in fine particulate matter due to ‘anthropogenic emissions switch-off’ during COVID-19 lockdown in Indian cities. Sustain Cities Soc 62:102382
Krzyzanowsk M, Schwela D (1999) 7 - Patterns of air pollution in developing countries. In: Holgate ST et al (eds) Air pollution and health. Academic Press, London, pp 105–113
Bruce N, Perez-Padilla R, Albalak R (2000) Indoor air pollution in developing countries: a major environmental and public health challenge. Bull World Health Organ 78:1078–1092
Andrade MDF et al (2017) Air quality in the megacity of São Paulo: evolution over the last 30 years and future perspectives. Atmos Environ 159:66–82
Castanho ADA, Artaxo P (2001) Wintertime and summertime São Paulo aerosol source apportionment study. Atmos Environ 35(29):4889–4902
Guo H et al (2017) Source apportionment of PM2.5 in North India using source-oriented air quality models. Environ Pollut 231:426–436
Pereira GM et al (2017) Particulate pollutants in the Brazilian city of São Paulo: 1-year investigation for the chemical composition and source apportionment. Atmos Chem Phys 17(19):11943–11969
Freitas ED et al (2007) Interactions of an urban heat island and sea-breeze circulations during winter over the metropolitan area of São Paulo, Brazil. Bound-Layer Meteorol 122(1):43–65
Nigam R et al (2021) Positive effects of COVID-19 lockdown on air quality of industrial cities (Ankleshwar and Vapi) of Western India. Sci Rep 11(1):4285
West S et al. (2021) Urban air pollution and children in low- and middle- income countries
Jin-Tai L, Da P, Rui-Xiong Z (2013) Trend and interannual variability of Chinese air pollution since 2000 in association with socioeconomic development: a brief overview. Atmos Ocean Sci Lett 6(2):84–89
European Environment Agency (2020) European Union emission inventory report 1990–2018, under the UNECE Convention on Long-range Transboundary Air Pollution (LRTAP). Luxembourg: Publications Office of the European Union, 2020. p. 160
Sicard P et al (2020) Amplified ozone pollution in cities during the COVID-19 lockdown. Sci Total Environ 735:139542
Konstantinoudis G et al (2021) Long-term exposure to air-pollution and COVID-19 mortality in England: a hierarchical spatial analysis. Environ Int 146:106316
Travaglio M et al (2021) Links between air pollution and COVID-19 in England. Environ Pollut 268:115859
Sarmadi M et al (2021) Association of COVID-19 distribution with air quality, sociodemographic factors, and comorbidities: an ecological study of US states. Air Qual Atmos Health 14(4):455–465
Roy, S., et al., Geospatial analysis of COVID-19 lockdown effects on air quality in the South and Southeast Asian region. Science of The Total Environment, 2021. 756: p. 144009.
Manisalidis I et al (2020) Environmental and health impacts of air pollution: a review. Front Public Health 8(14):13
Mahato S, Pal S, Ghosh KG (2020) Effect of lockdown amid COVID-19 pandemic on air quality of the megacity Delhi, India. Sci Total Environ 730:139086
Shehzad K et al. (2021) COVID-19 outbreak, lockdown, and air quality: fresh insights from New York City. Environ Sci Pollut Res
Wang L et al (2020) Unexpected rise of ozone in urban and rural areas, and sulfur dioxide in rural areas during the coronavirus city lockdown in Hangzhou, China: implications for air quality. Environ Chem Lett 18(5):1713–1723
Sharma S et al (2020) Effect of restricted emissions during COVID-19 on air quality in India. Sci Total Environ 728:138878
Bechle MJ, Millet DB, Marshall JD (2013) Remote sensing of exposure to NO2: satellite versus ground-based measurement in a large urban area. Atmos Environ 69:345–353
Munir S, Chen H, Ropkins K (2012) Modelling the impact of road traffic on ground level ozone concentration using a quantile regression approach. Atmos Environ 60:283–291
Liu H et al (2019) Emissions and health impacts from global shipping embodied in US–China bilateral trade. Nature Sustain 2(11):1027–1033
Sarmadi M et al. (2021) Interaction between meteorological parameters and COVID-19: an ecological study on 406 authorities of the UK. Environ Sci Pollut Res
Zhang H et al (2015) Relationships between meteorological parameters and criteria air pollutants in three megacities in China. Environ Res 140:242–254
Ilten N, Selici AT (2008) Investigating the impacts of some meteorological parameters on air pollution in Balikesir, Turkey. Environ Monit Assess 140(1):267–277
Kwak H-Y et al (2017) Identifying the correlation between rainfall, traffic flow performance and air pollution concentration in Seoul using a path analysis. Transport Res Procedia 25:3552–3563
Barceló MA, Saez M (2021) Methodological limitations in studies assessing the effects of environmental and socioeconomic variables on the spread of COVID-19: a systematic review. Environ Sci Eur 33(1):108
Acknowledgements
The authors would like to thank the Torbat Heydariyeh University of Medical Sciences for their financial support.
Funding
This work was supported by the Torbat Heydariyeh University of Medical Sciences (Grant Number: 99000217).
Author information
Authors and Affiliations
Contributions
MS: conceptualization, methodology, data curation, formal analysis, writing—original draft preparation, writing—review and editing, supervision, funding acquisition. SR: conceptualization, data curation, formal analysis, writing—original draft preparation, writing—review an editing. MR: data curation, writing—original draft, writing—review and editing. DS: data curation, writing—original draft, writing—review and editing. MD: methodology, formal analysis, writing—original draft preparation. All authors read and approved the final manuscript.
Corresponding authors
Ethics declarations
Ethics approval and consent to participate
The ethics code (IR.THUMS.REC.1400.008) was obtained from the Ethics Committee of Torbat Heydariyeh University of Medical Sciences. This study works with aggregate data, therefore there are no individual data, and therefore the consent to participate is not applicable.
Consent for publication
Not applicable.
Competing interests
The authors declare that they have no known competing financial interests or personal relationships that could have appeared to influence the work reported in this paper.
Additional information
Publisher's Note
Springer Nature remains neutral with regard to jurisdictional claims in published maps and institutional affiliations.
Rights and permissions
Open Access This article is licensed under a Creative Commons Attribution 4.0 International License, which permits use, sharing, adaptation, distribution and reproduction in any medium or format, as long as you give appropriate credit to the original author(s) and the source, provide a link to the Creative Commons licence, and indicate if changes were made. The images or other third party material in this article are included in the article's Creative Commons licence, unless indicated otherwise in a credit line to the material. If material is not included in the article's Creative Commons licence and your intended use is not permitted by statutory regulation or exceeds the permitted use, you will need to obtain permission directly from the copyright holder. To view a copy of this licence, visit http://creativecommons.org/licenses/by/4.0/.
About this article
Cite this article
Sarmadi, M., Rahimi, S., Rezaei, M. et al. Air quality index variation before and after the onset of COVID-19 pandemic: a comprehensive study on 87 capital, industrial and polluted cities of the world. Environ Sci Eur 33, 134 (2021). https://doi.org/10.1186/s12302-021-00575-y
Received:
Accepted:
Published:
DOI: https://doi.org/10.1186/s12302-021-00575-y


