
Abstract
Education of young researchers has been proposed as a way to promote research integrity. However, the effectiveness of research integrity education on PhD students is unknown. In a longitudinal design, we surveyed over 1000 starting PhD students from various disciplines regarding knowledge, attitude and behaviour before, immediately after and 3 months after a compulsory 3-h course given by a panel of experts. Compared with a control group who did not follow the course, the course recipients showed significant (multivariate analysis) but modest improvements in knowledge and attitude scores immediately after the course, but not after 3 months; a prolonged impact was apparent regarding behaviour. Moreover, the course spurred 93% of PhD students to have conversations about research integrity and 79% declared applying the content of the course. Among other interventions, formal education in research integrity may contribute to foster a climate of research integrity in academia.
Introduction
In 2005, a notorious Nature article titled “Scientists behaving badly” revealed that scientists admitted to a wide range of activities that compromise the integrity of science (Martinson et al. 2005). This sobering discovery and other evidence have led various institutions to take a range of initiatives, such as developing codes of conduct for responsible research and organising educational activities to promote research integrity (Fanelli, 2009; Mejlgaard et al. 2020). However, systematic evaluations of the effectiveness of research integrity course are still scare (Committee on Responsible Science et al. 2017).
Since 2014, attending a university-wide 3-h session of lectures on research integrity has been a mandatory milestone for starting PhD students at the KU Leuven, one of the leading research-intensive universities in Europe (“Central lecture Research Integrity for starting PhD researchers”). In brief, the 3-h course on research integrity is given, in English, by a panel of five lecturers who cover general ethics in research, data management, plagiarism, conflicts of interest and publication ethics. The same course is organised four times a year in lecture halls with 200–400 first-year PhD students from all disciplinary fields of the university.
To evaluate the impact of this course, hereafter called the intervention, we surveyed all PhD students attending the course over one academic year. In a longitudinal study design, we assessed individual knowledge, attitude, and behaviour in relation to the teaching content of the educational programme; we administered the same paper questionnaires to more than 1000 PhD students immediately before and immediately after the course, and we also invited participants to reply to a similar electronic questionnaire (plus other questions) 3 months later. The questionnaires (see supplementary material 1 and 2) were based on previous surveys of research integrity (Bouter et al. 2016; Godecharle et al. 2018; Martinson et al. 2005). To control for time effects, we followed the same procedures with a control group consisting of Master students from different disciplines; they were enroled in the survey through one of their normal courses and they received similar questionnaires and follow-up procedures as the PhD students. For the statistical analysis, we used multivariate linear models for longitudinal measurements with the null hypotheses being that no changes occurred in scores of knowledge, attitude or behaviour compared to baseline.
Results
Response rate and participants’ characteristics
The total number of PhD students present during the courses were based on the number of participants scanning in with their KU Leuven badge upon entry and exit of the lecture hall. The total number of eligible Master students was not known, since their attendance was not registered. Of the 1044 PhD students who participated in the study by returning completed questionnaires, 5 participants returned only the post-test. As shown in the flowchart (Fig. 1), 1039 PhD students completed the pre-test, 920 completed the post-test and 560 filled out the follow-up test. Of the 419 control participants, 30% completed all three measurements.
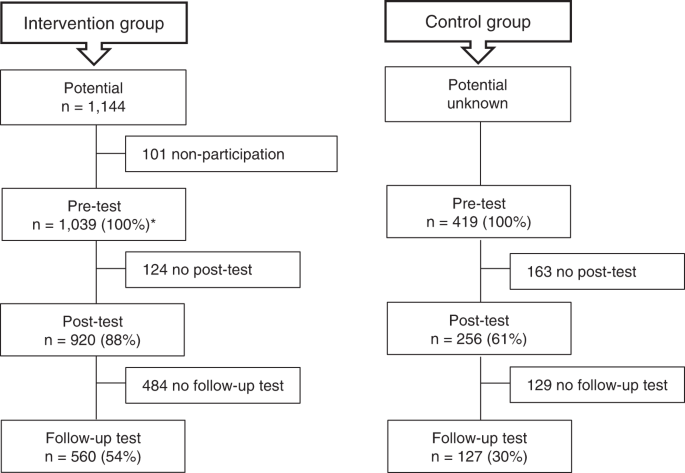
Participants are PhD students in the intervention group and Master students in the control group. *The total number of participants in the intervention group is 1044. Five participants did not fill out the pre-test.
The baseline characteristics of the study populations are shown in Table 1. The majority of PhD students were effectively in their first year of the PhD programme, most had not previously attended a course or workshop on research integrity, and the university’s broad disciplinary fields were well represented. Supplementary materials 3, 4 and 5 show the estimates with 95% confidence intervals for item-level results for knowledge, attitude and behaviour.
Appraising the research integrity course
Knowledge
Significant increases in knowledge scores at the post-test compared to pre-test were observed in both the intervention and control groups, but the increase was significantly higher in the intervention group (pre-testintervention = 3.83, post-testintervention = 4.27) than in the control group (pre-testcontrol = 3.59, post-testcontrol = 3.75) (Fig. 2a). At the follow-up, the knowledge scores were also higher than the initial scores in both the intervention and control groups, but the changes did not differ significantly between the two groups (Table 2).

Pre-test indicates scores immediately prior to a 3-h course on research integrity (intervention) or another course (controls). Post-test indicates scores immediately after the course. Follow-up indicates scores after 3 months. a Sum of six knowledge items (minimum 0, maximum 6). b Sum of ten attitudes items (minimum 10, maximum 50). c Sum of five behaviour items (minimum 5, maximum 15), behaviour questions were not asked at post-test. Data are shown as means with 95% confidence intervals. ***P < 0.001, ****P < 0.0001 for the differences in change with respect to pre-test values between both groups, as determined by multivariate linear models for longitudinal measurements, using a direct likelihood approach. Numbers of respondents are indicated below the graphs and may differ from those shown in Fig. 1 because of missing data. For details, see Table 2.
Attitude
Significant increases were again observed for attitude scores in both groups, at the post-test and at the follow-up test, with only the post-test increase being significantly higher in the intervention group (pre-testintervention = 39.68, post-testintervention = 42.99) than in the control group (pre-testcontrol = 36.87, post-testcontrol = 37.82) (Fig. 2b) (Table 2).
At the follow-up, participants from both groups put forward pressure to publish, high competition and only positive results are rewarded, as the three most important reasons for scientists to misbehave (Fig. 3).

Pre-test indicates responses immediately prior to the course on research integrity (a). Post-test indicates responses immediately after the course (b). Follow-up indicates responses after 3 months (c). Data are shown as number of participants. Participants are PhD students in the intervention group and Master students in the control group.
Behaviour
Participants filled out the behaviour questions at the pre-test and follow-up test. The analysis of behaviour items on a four-point Likert scale, e.g. When I needed guidance on research integrity, I went to my supervisor, showed a significant but small improvement towards better behaviour in the intervention group (pre-testintervention = 10.94, follow-upintervention = 11.30), compared to a significant decrease in the control group (pre-testcontrol = 9.39, follow-upcontrol = 8.20) (Fig. 2c). However, when we analysed behaviour through yes/no items, e.g. I made a data management plan, there was a significant increase in both groups, unlike when using the Likert scale, the changes did not differ (Table 2).
Raising awareness: conversations about research integrity
At the follow-up test, participants from the intervention group were additionally asked to indicate whether they had discussed topics from the lecture on research integrity with others. The majority of participants (93%) reported having had conversations about research integrity, mainly with fellow PhD students (43%), someone close to them outside their work environment (18%) or their supervisor(s) (13%) (Fig. 4a). The majority of the participants (79%) also indicated that they had applied/used the information received during the course, mostly regarding authorship (24%), data management (22%) and publication (18%) (Fig. 4b).
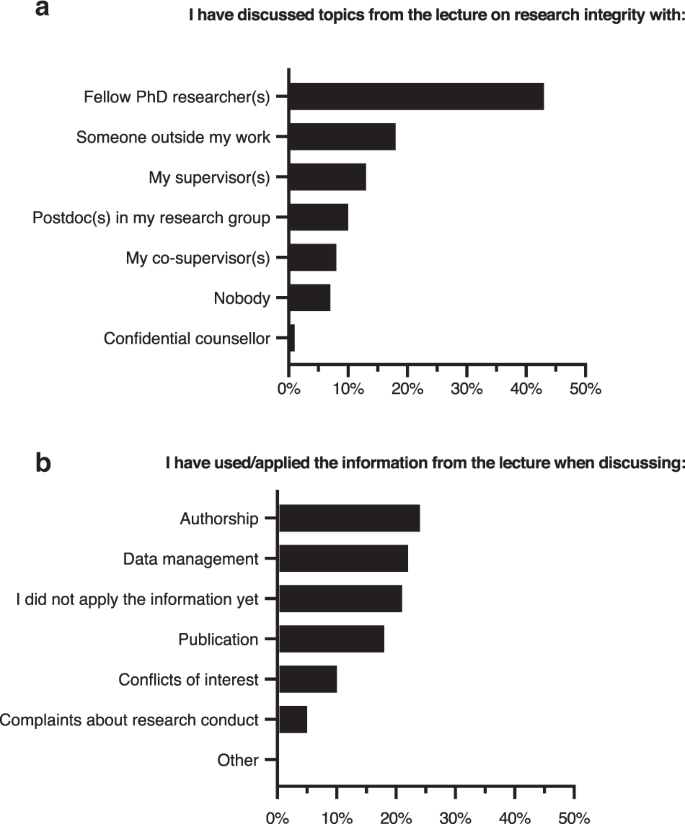
a Number and percentage of PhD students that indicated whether they had discussed topics from research integrity course with others. b Number and percentage of PhD students that indicated that they had applied/used the information received during the course. Participants were asked to check all that apply from a list of predefined options, including option “other”.
Discussion
Ours is not the first attempt to appraise education on research integrity, but it is the first empirical study evaluating the immediate impact, as well as its retention over 3 months in a large sample of PhD students from biomedical sciences, natural sciences, as well as social sciences/humanities.
A positive outcome of our study was the significant though modest improvement of PhD students’ scores on knowledge and attitude, and the prolonged impact for some behavioural items. In addition, we achieved a potentially important—though hard to quantify—outcome, in that the great majority of the participants indicated that the lecture had led to discussing research integrity issues and even applying the content of the course in their daily research practice. Of note, the extent to which research integrity was reportedly discussed with the PhD supervisors proved rather low, as found by others (Langlais and Bent, 2014).
A unique and critically important methodologic feature of the present study is that we included a control group who did not receive the intervention. Indeed, as shown in Fig. 2, post-test results improved slightly, even in the absence of the intervention, thus suggesting the occurrence of “test effects” (Marsden and Torgerson, 2012). Admittedly, the controls did not consist of a randomised group of PhD students who did not receive the intervention, because the research integrity lecture was mandatory.
Our study has several other strengths compared to previous research (Watts et al. 2017). The existing literature on the impact of research integrity instructions focused on students from a particular disciplinary field (Antes et al. 2010; Henslee et al. 2017), did not include longitudinal data (Antes et al. 2010), used a meta-analytic approach to evaluate instruction (Watts et al. 2017), or concerned only a limited number of students (Langlais and Bent, 2018). In contrast, we surveyed a large number of participants from all academic disciplines and our study population was also internationally highly diverse, since 43% of our PhD students had obtained their master’s degrees outside Belgium (at KU Leuven, the language used in research is largely English). The high number of participants and their diversity in terms of research fields and geographical origin are features favouring generalisability of our findings beyond the local context. In addition, the content of the KU Leuven research integrity course is in line with that of research integrity programmes offered at other institutions (Abdi et al. 2021; Pizzolato et al. 2020).
A recent meta-analysis on the impact of ethics instruction based on various evaluation criteria demonstrated “sizable” positive effects to course participants (Watts et al. 2017), although the effect sizes ranged from −0.01 (no effect) to 0.79 (large effect). However, in that meta-analysis, a broad range of different teaching and training methods were considered with regard to ethics instructions in the sciences, whereas the objective of the present study was to evaluate quantitatively the impact of a well-defined educational intervention, consisting of a single 3-h session of lectures on research integrity given in a large auditorium.
We did not observe a prolonged effect for knowledge and attitude. This may not be surprising since it is well-known that traditional lecture-based teaching contributes little to long-term knowledge retention. It has been demonstrated that students retain less information from traditional lecturing compared with active learning methods (Freeman et al. 2014; Ramsden, 2003; Ruiz-Primo et al. 2011). Another possible explanation for the absence of a persistent improvement in knowledge and attitude in our study is the greater drop-out in the control group. These more motivated participants were possibly not representative for the whole control group, thus masking a possible difference with the intervention group.
Some limitations should be acknowledged. First, since the course was intended to involve PhD students from all disciplinary fields, issues focussing on quantitative research and statistical analysis, such as p-hacking and HARKing were not addressed in the course and therefore also not addressed in the questionnaire. Similarly, because of the limited research experience of starting PhD students, we did not include issues such as retraction, citation bias, publication bias or pre-registration.
Second, the proportion of PhD students from the natural science may appear high, but this also reflects the composition of PhD students in our university (44% of all PhD students come from natural sciences).
Third, participants were not randomised, and the intervention and control group originated from different populations (PhD and Master students, respectively).
Lastly, the drop-out percentages after 3-month timepoints may appear high. We had hoped that the subjects with a follow-up measurement would be similar to those without a follow-up information. However, in general, the mean scores at pre-test proved slightly higher for participants with complete follow-up than the mean scores of dropouts [for knowledge (3.68 vs 3.86), for attitude [38.46 vs 39.36], and behaviour yes/no (1.63 vs 1.82); no changes in behaviour Likert scale (10.63 vs 10.36)]. We trust that these minimal differences did not materially reflect our outcome.
One could criticise that our empirical study simply demonstrated what was to be expected, namely that simply attending lectures for 3 h is unlikely to have a lasting substantial impact on knowledge, attitude, and behaviour about research integrity. However, although the scores of these outcome variables showed little or no improvement 3 months after the intervention, our study did reveal that the single intervention had succeeded in placing research integrity on the agenda of the participants, as evidenced by the fact that more than 90% of respondents reported having talked about the concepts addressed during the course, and more than 70% even indicated that they had applied some of these concepts. These admittedly less tangible outcomes suggest that the content of the lectures had moved beyond the lecture hall and that the intervention thus might have lastingly influenced the students’ actual practice of research. In other words, we propose that the conversations spurred by the course may have engendered a greater—hopefully beneficial—effect on the integrity of research than the instruction itself. This is why the research integrity training at the KU Leuven also involves interactive workshops for small groups of more advanced PhD students and, more recently, also for newly appointed PhD supervisors. We hope that this comprehensive approach will contribute to fostering a culture of research integrity, which we consider, in agreement with others (Martinson et al. 2005; Mejlgaard et al. 2020; Peiffer et al. 2008; Lerouge and Hol, 2020), to be most influential for shaping researchers’ behaviour.
Methods
Questionnaire development
The questionnaires used for the study are included in a Supplement. They were all in English, which is widely used for research at KU Leuven. First, we developed a 36-item questionnaire on knowledge, attitude and behaviour in research integrity and misconduct based on a list of 16 research misbehaviours, 22 actions of research misconduct, and a comprehensive list of 60 major and minor research misbehaviours, as described in the literature (Bouter et al. 2016; Godecharle et al. 2018; Martinson et al. 2005). We added questions on research integrity, such as I made a data management plan (Behaviour item), Research integrity training for junior researchers should be mandatory (Attitude item). We also adapted some questions to the target population of starting PhD students, who typically have limited experience with certain issues, such as retractions.
Second, we validated the content of the questions by consulting six independent experts: two lecturers of the research integrity course, two research integrity officers, one expert in methodology and one person holding a PhD on the topic of research integrity. We asked them to rate the relevance of each item on a four-point Likert scale ranging from ‘1 = not relevant’ to ‘4 = highly relevant’. We used a multirater kappa coefficient of agreement (Polit et al. 2007) to calculate agreement among the six experts for each item and applied the evaluation criteria for kappa as outlined by Cicchetti (1984) and Fleiss (1971). As a consequence, we removed seven items, thus resulting finally in 29 items (see supplementary material 1 and supplementary material 2): six multiple-choice knowledge items, ten attitude items on a five-point Likert scale, one attitude top 3 ranking item, seven behaviour items on a four-point Likert scale and five behaviour yes/no items. We determined the correct answers for each knowledge item.
Finally, we conducted a pilot study with ten members of the Department of Public Health and Primary Care to test the user-friendliness and layout of the survey.
Intervention and survey procedures
The intervention group consisted of PhD students from all doctoral schools of the university who had been invited to attend a mandatory course on research integrity during their first year of research. As in other years, the same course was offered four times (November 2018, January, March and May 2019) and it consisted of successive lectures (with powerpoint slides, including some interactive questions via Poll Everywhere) given over 3 h by a panel of the same five lecturers from different disciplines (including two of the co-authors) to mixed groups of 200–400 PhD researchers from biomedical sciences, natural sciences, and social sciences/humanities. All attendees were asked to complete a paper-based survey containing knowledge, attitude, and behaviour items immediately before the first lecture started. This pre-test was printed on yellow pages each containing a six-digit-code. The filled pre-test questionnaires were collected before starting the lecture. Immediately after the 3-h course, before leaving the lecture hall, the PhD students were asked to fill out the post-test survey printed on pink pages, with the same six-digit-code to allow a linkage of individual pre- and post-test responses. The demographic characteristics of the participants and behaviour items were filled only once, at the pre-test. Three months after the research integrity course, participants who had filled the optional entry for their own e-mail, received an invitation with a link to the online follow-up test using LimeSurvey Version 2.00, where they were asked to reply to a questionnaire that was nearly identical to the pre-test questionnaire, plus five additional items (see supplementary material 1). For the online follow-up survey, we sent up to three reminders.
An identical procedure was applied to the respondents from the control group which consisted of Master students. It was not possible to have a control group consisting of PhD students because the research integrity course was a mandatory milestone for all starting PhD students from the university. So, we distributed the paper-based pre-test and post-test questionnaires to KU Leuven Master students following similar disciplines as the PhD students. Because it was not possible to find a course of 3 h, the post-test in the control group was taken after 4 h of one or a series of their normal lectures unrelated to research integrity. We slightly adapted the questionnaire to students at Master level (e.g. Have you obtained your Bachelor’s degree in Belgium?) (see supplementary material 2). These control students were included in February, March, and April 2019.
The study protocol received a favourable advice from the Social and Societal Ethics Committee of the University of Leuven (G-2018 10 1350). Each survey form had to be signed for consent (see supplementary material 1 and supplementary material 2). No coercion was exercised, and no incentives were given to participate in the survey. All participants were assured confidentiality.
Data analysis
The pre-test and post-test data were entered into Excel sheets and then, together with the online follow-up data, imported and analysed using SAS software version 9.4. Correct data entry was checked by an independent person. A multivariate linear model for longitudinal measurements (with an unstructured covariance matrix for the timepoints) was used to evaluate whether changes in the scores for knowledge, attitude and behaviour differed between the intervention and control group. By the use of a direct likelihood approach, all subjects with a score on at least one of the timepoints were included in the analysis. For the binary items, a binary logistic model with generalised estimating equations was used. All reported p values are two-sided.
The analysis consisted of assessing changes in scores of knowledge, attitude and behaviour compared to pre-test, at post-test and follow-up. The scores 1–5 for attitude items were reversed for the first eight attitude items (a higher score on attitude implied a more positive attitude towards research integrity). In the follow-up test, we added five additional items (see Supplementary material 1).
We performed a sensitivity analysis excluding one knowledge item (Who owns data collected during your PhD trajectory?) because we had not realised that the university had no explicit policy regarding ownership of data, but this sensitivity analysis did not alter the results. In addition, we excluded two behavioural items from the statistical analyses: one item was unrelated to PhD students’ own behaviour (I was denied co-authorship on a manuscript to which I had contributed substantially); and one item was not listed in the follow-up questionnaire (I have discussed issues related to research integrity and misconduct with fellow PhD students outside this research integrity course).
Data availability
The data that support the findings of this study are not publicly available because they contain information that could compromise research participants’ privacy and consent. However, they are available from the corresponding author [SA] upon reasonable request.
References
Abdi S, Pizzolato D, Nemery B, Dierickx K (2021) Educating PhD students in research integrity in Europe. Sci Eng Ethics 27:5. https://doi.org/10.1007/s11948-021-00290-0
Antes AL, Wang X, Mumford MD, Brown RP, Connelly S, Devenport LD (2010) Evaluating the effects that existing instruction on responsible conduct of research has on ethical decision making. Acad Med 85:519–526. https://doi.org/10.1097/ACM.0b013e3181cd1cc5
Bouter LM, Tijdink J, Axelsen N, Martinson BC, ter Riet G (2016) Ranking major and minor research misbehaviors: results from a survey among participants of four World Conferences on Research Integrity. Res Integr Peer Rev 1:17. https://doi.org/10.1186/s41073-016-0024-5
Central lecture research integrity for starting PhD researchers (3h lecture). https://www.kuleuven.be/english/research/integrity/training/phdlecture. Accessed 2 Nov 2020.
Cicchetti DV (1984) On a model for assessing the security of infantile attachment: issues of observer reliability and validity. Behav. Brain Sci 7:149–150. https://doi.org/10.1017/S0140525X00026558
Committee on Responsible Science, Committee on Science, Engineering, Medicine, and Public Policy, Policy and Global Affairs, National Academies of Sciences, Engineering, and Medicine (2017) Fostering integrity in research. National Academies Press, Washington, D.C., 10.17226/21896
Fanelli D (2009) How many scientists fabricate and falsify research? A systematic review and meta-analysis of survey data. PLoS ONE 4:e5738. https://doi.org/10.1371/journal.pone.0005738
Fleiss JL (1971) Measuring nominal scale agreement among many raters. Psychol. Bull. 76:378–382. https://doi.org/10.1037/h0031619
Freeman S, Eddy SL, McDonough M, Smith MK, Okoroafor N, Jordt H, Wenderoth MP (2014) Active learning increases student performance in science, engineering, and mathematics. Proc Natl Acad Sci USA 111:8410–8415. https://doi.org/10.1073/pnas.1319030111
Godecharle S, Fieuws S, Nemery B, Dierickx K (2018) Scientists still behaving badly? A survey within industry and universities. Sci Eng Ethics 24:1697–1717. https://doi.org/10.1007/s11948-017-9957-4
Henslee AM, Murray SL, Olbricht GR, Ludlow DK, Hays ME, Nelson HM (2017) Assessing freshman engineering students’ understanding of ethical behavior. Sci Eng Ethics 23:287–304. https://doi.org/10.1007/s11948-016-9749-2
Langlais PJ, Bent BJ (2018) Effects of training and environment on graduate students’ self-rated knowledge and judgments of responsible research behavior. Ethics Behav 28:133–153. https://doi.org/10.1080/10508422.2016.1260014
Langlais PJ, Bent BJ (2014) Individual and organizational predictors of the ethicality of graduate students’ responses to research integrity issues. Sci Eng Ethics 20:897–921. https://doi.org/10.1007/s11948-013-9471-2
Lerouge I, Hol A (2020) Towards a research integrity culture at universities: from recommendations to implementation. https://www.leru.org/publications/towards-a-research-integrity-culture-at-universities-from-recommendations-to-implementation. Accessed 27 Nov 2020.
Marsden E, Torgerson CJ (2012) Single group, pre- and post-test research designs: some methodological concerns. Oxf Rev Educ 38:583–616
Martinson BC, Anderson MS, de Vries R (2005) Scientists behaving badly. Nature 435:737–738. https://doi.org/10.1038/435737a
Mejlgaard N, Bouter LM, Gaskell G, Kavouras P, Allum N, Bendtsen A-K, Charitidis CA, Claesen N, Dierickx K, Domaradzka A, Reyes Elizondo A, Foeger N, Hiney M, Kaltenbrunner W, Labib K, Marušić A, Sørensen MP, Ravn T, Ščepanović R, Tijdink JK, Veltri GA (2020) Research integrity: nine ways to move from talk to walk. Nature 586:358–360. https://doi.org/10.1038/d41586-020-02847-8
Peiffer AM, Laurienti PJ, Hugenschmidt CE (2008) Fostering a culture of responsible lab conduct. Science 322:1186–1186. https://doi.org/10.1126/science.322.5905.1186b
Pizzolato D, Abdi S, Dierickx K (2020) Collecting and characterizing existing and freely accessible research integrity educational resources. Account Res 1–17. https://doi.org/10.1080/08989621.2020.1736571
Polit DF, Beck CT, Owen SV (2007) Is the CVI an acceptable indicator of content validity? Appraisal and recommendations. Res Nurs Health 30:459–467. https://doi.org/10.1002/nur.20199
Ramsden P (2003) Learning to teach in higher education. Routledge London.
Ruiz-Primo MA, Briggs D, Iverson H, Talbot R, Shepard LA (2011) Impact of undergraduate science course innovations on learning. Science 331:1269–1270
Watts LL, Medeiros KE, Mulhearn TJ, Steele LM, Connelly S, Mumford MD (2017) Are ethics training programs improving? A meta-analytic review of past and present ethics instruction in the sciences. Ethics Behav 27:351–384. https://doi.org/10.1080/10508422.2016.1182025
Acknowledgements
The authors would like to acknowledge Tamarinde Haven and Fenneke Blom for their contribution to the development of the questionnaire, and Annelies Van Tongelen for her assistance on the correct research data entry into the database.
Author information
Authors and Affiliations
Corresponding author
Ethics declarations
Competing interests
BN and KD are involved in educating research integrity at the KU Leuven, including by being lecturers for the course under study. This research project was funded by the Internal Funds KU Leuven C24/15/032 but the institution had no role in designing, performing, or interpreting the findings of the study.
Additional information
Publisher’s note Springer Nature remains neutral with regard to jurisdictional claims in published maps and institutional affiliations.
Supplementary information
Rights and permissions
Open Access This article is licensed under a Creative Commons Attribution 4.0 International License, which permits use, sharing, adaptation, distribution and reproduction in any medium or format, as long as you give appropriate credit to the original author(s) and the source, provide a link to the Creative Commons license, and indicate if changes were made. The images or other third party material in this article are included in the article’s Creative Commons license, unless indicated otherwise in a credit line to the material. If material is not included in the article’s Creative Commons license and your intended use is not permitted by statutory regulation or exceeds the permitted use, you will need to obtain permission directly from the copyright holder. To view a copy of this license, visit http://creativecommons.org/licenses/by/4.0/.
About this article

Cite this article
Abdi, S., Fieuws, S., Nemery, B. et al. Do we achieve anything by teaching research integrity to starting PhD students?. Humanit Soc Sci Commun 8, 232 (2021). https://doi.org/10.1057/s41599-021-00908-5
Received:
Accepted:
Published:
DOI: https://doi.org/10.1057/s41599-021-00908-5
- Springer Nature Limited
This article is cited by
-
A Taxonomy for Research Integrity Training: Design, Conduct, and Improvements in Research Integrity Courses
Science and Engineering Ethics (2023)
-
Educating and Training in Research Integrity (RI): A Study on the Perceptions and Experiences of Early Career Researchers Attending an Institutional RI Course
Journal of Academic Ethics (2023)
-
Evaluating empowerment towards responsible conduct of research in a small private online course
International Journal for Educational Integrity (2023)
-
The value-free ideal in codes of conduct for research integrity
Synthese (2023)
-
Co-creating Research Integrity Education Guidelines for Research Institutions
Science and Engineering Ethics (2023)