Abstract
This study reports the variation in safety perceptions of university students (N = 196 university students) on university campuses in South China, focusing on the risk of crime and traffic incidents. Using a public participation geographic information system, we explore potential links between students’ perceptions and campus characteristics. We conclude that environmental cues associated with the risk of crime victimisation (e.g. lack of natural surveillance) are more often linked to poorer safety perceptions than those linked to the risk of traffic conditions. Although half of the students declare feeling safe on campus, their perception varies by individual characteristics, frequency of use, and daily experiences. Inspections of campuses environments using a door-to-door perspective are advised when safety becomes an integral part of sustainability planning of universities worldwide.
Introduction
In 2015, a female college student at Central Lake Park in the Guangzhou university town was murdered on campus (Zheng, 2016). This case was widely disseminated among students by social media and quickly helped shed light on current safety challenges that universities worldwide face, from sexual assault and traffic incidents to crime (Fedina et al., 2018; Hites et al., 2013). Although safety on campus has been a growing research field (Jennings et al., 2007), most past and current studies lack a holistic perspective on safety. Namely, they are often limited to crime issues and fear of crime (e.g. Chekwa et al., 2013) or traffic incidents and other threats (e.g. Schneider et al., 2001). These studies rarely consider the impact of the physical and social environments of university campuses on students’ perceptions of safety (Hu et al., 2012; Nobles et al., 2010) and rarely consider students’ views. Understanding the experiences of students can assist in identifying the level of perceived safety and help determine the spots clustered with the risk of crime and other traffic incidents. Moreover, it can also highlight the gap between actual and perceived safety. The latter is highly associated with the students’ behaviours, even becoming the basis on how students behave.
The advent of computerised mapping systems has opened new approaches to studying safety research, including safety on campus. Geographical Information Systems (GIS) have incorporated environmental data combined with people’s views using surveys in a common spatial analysis framework (Gargiulo et al., 2020). By being both people and place centred, public participation GIS (PPGIS) have great potential to account for the environmental characteristics of places and people’s safety perceptions (Kingston et al., 2000; Ceccato and Snickars, 2000; Kyttä et al., 2014). This study investigates the environmental nature of safety perceptions of university students on campus by adopting a holistic perspective, focusing on safety perceptions of places expected to attract crime and/or traffic incidents (self-inflicted or in collisions). This is achieved by:
-
(1)
Assessing the overall levels of safety declared by university students by individual and place characteristics using 196 answers from a safety survey conducted in ten universities in South China.
-
(2)
Classifying the campus environment by students’ use and safety perceptions (from safe to unsafe areas) with a focus on unsafe places for crime and traffic incidents (self-inflicted and collisions).
-
(3)
Investigating potential relationships between the physical and social environment of campus and students’ perceived safety, focusing on commonalities of these environments.
The novelty of this study is threefold. First, the study adopts a holistic public-health perspective to campus safety by openly investigating the characteristics of places where students feel unsafe in terms of crime risk and other traffic-related incidents, for instance, by collision. Second, the analysis explores the potentiality of PPGIS to apply an online survey linked to students’ use of space, mobility, and safety perceptions. Finally, since the international literature on campus safety is dominated by North American and Western European case studies, this case study provides new empirical findings from a part of the world in which evidence is still lacking. This study of on-campus safety is intended to assist policymakers when planning and implementing measures to improve safety on university campuses in China and similar university towns around the world.
Theoretical background
Individual and environmental factors of fear of crime
Previous studies have concentrated on the association between the nature of safety and individual characteristics. Gender, for example, is regarded as a significant and robust predictor of safety perception (Gargiulo et al., 2020). Public spaces are less likely to comply with the safety expectations of women, as opposed to those of men (Richardson and Mitchell, 2010). Similarly, it is perceived that there is a higher probability of the elderly being victimised than young people (Scarborough et al., 2010). Apart from these demographic characteristics, personal experience may also significantly influence one’s perceived safety (Zou and Mawby, 2020). Odufuwa et al. (2019) found that frequent users felt safer than those less familiar with a place.
Understanding how the environment shapes safety perception is of central importance in adopting policies to reduce the fear of crime. Many studies have explored the extent to which environmental factors affect both crime and safety perception. Campus location can undoubtedly influence perceived safety from crime; for example, the rurality of the campus positively influences the perceived safety of community college students (Patton and Gregory, 2014). The upkeep of the environment and the well-maintained urban vegetation (Li et al., 2015) can also promote safety perceptions (Wood et al., 2008). Campus environments with higher prospect levels can enhance safety perceptions, while appraisals of entrapment predict low levels of perceived safety (Van Rijswijk and Haans, 2017). The existence of pedestrians, namely, natural surveillance, can significantly enhance the perceived safety of women (Paydar et al., 2017). Moreover, poorly illuminated settings and places to hide are prominent factors that lead to the decreased perceived safety of students (Loewen et al., 1993) on campus settings due to the lack of surveillance. Furthermore, campus security measures, including campus lighting and avoidance of locations during the day, are significant predictors of the safety perceptions of students (Maier and DePrince, 2019). Additionally, campuses with high Crime Prevention through Environmental Design (CPTED) structures are positively related to a high level of the perceived safety of students (Shariati and Guerette, 2019). However, other school security measures, such as metal detectors, negatively influence perceived safety because these prevention strategies may remind students of the potential violence on campus (Perumean-Chaney and Sutton, 2012). Places with open views and adjacent to residential areas appear to have special importance in reinforcing the perceived safety from crime compared to those close to industrial areas, where incivilities and disorders easily occur (Gargiulo et al., 2020).
Fear and risk of injuries
Road factors such as uneven surfaces, slipping hazards, busy junctions, and ascending and descending stairs are the most frequently mentioned environmental characteristics that precipitate self-inflicted falls. These risk factors are mainly addressed by qualitative research and evaluated by victims’ interpretations (Schepers et al., 2017). The spatial distribution of pedestrian falls varies in different land-use patterns; specifically, the highest densities of pedestrian falls occur in high-density residential areas, followed by retail store and office building areas (Morency et al., 2012). In addition, slippery roads are the major reason for car crashes (Rolison and Moutari, 2020).
The potential of PPGIS for the study of safety on campus
The ability of GIS to conduct complicated spatial analysis distinguishes it from other data systems. GIS can combine the physical environment with human behaviour patterns and experiences and interpret data through visualisation (Hu et al., 2012). Many researchers have addressed the issue of safety analysis using GIS techniques, ranging from pedestrian falls, traffic crashes, and crimes to safety perceptions (Ceccato and Willems, 2019; Hu et al., 2012; Nobles et al., 2010; Kyttä et al., 2014). Other studies integrated perception data into safety analysis regarding crime risk (Hites et al., 2013) and other traffic-related incidents (Schneider et al., 2001).
The public participation GIS (PPGIS) approach has been broadly applied in the field of public participation (Brown and Kyttä, 2014), study of ecosystem services (Fagerholm et al., 2019), landscape management (Plieninger et al., 2019) and active living (Ramezani et al., 2019). The methodology has also been used in the place-based study of environmental health promotion (Huang et al., 2022; Kyttä et al., 2014) since it can potentially incorporate the localized information about human perceptions with the characteristics of specific physical environment. This location-based knowledge from respondents can be utilized to conduct joint analysis of personal-based and place-based data collected by PPGIS method together with other geographic data (Kajosaari and Pasanen, 2021). One of the first use of PPGIS was performed by Ceccato and Snickars (2000) to compare objective and subjective indicators of residential quality of life in neighbourhoods in Sweden. PPGIS has been utilised to study perceived environmental quality by analysing personal localised experiential knowledge (Kyttä et al., 2010). The spatial distribution of unsafe places with risk of crime, traffic conditions and risk of accident was examined by Kyttä et al. (2014) in a Finnish neighbourhood. The study revealed the highly polarized safety experiences of inhabitants and concluded that a more holistic safety strategy should be implemented to break the spiral of decay and promote the positive development of a distressed neighbourhood.
Safety issues on college campuses concern many individuals, including students, staff, and campus-based officials. Campus safety is a complex topic ranging from violence, crime, and traffic incidents (Regehr et al., 2017; Fox and Hellman, 1985; Schneider et al., 2001). All these incidents have indicated the complex nature of campus safety, calling for a more comprehensive approach to address campus safety issues. Following the evidence from previous research that uses GIS to assess campus safety, the methodology of PPGIS has the potential to constitute a framework for evaluating the environmental nature of safety perceptions on campuses, with a particular focus on the risk of crime and traffic incidents.
Study area
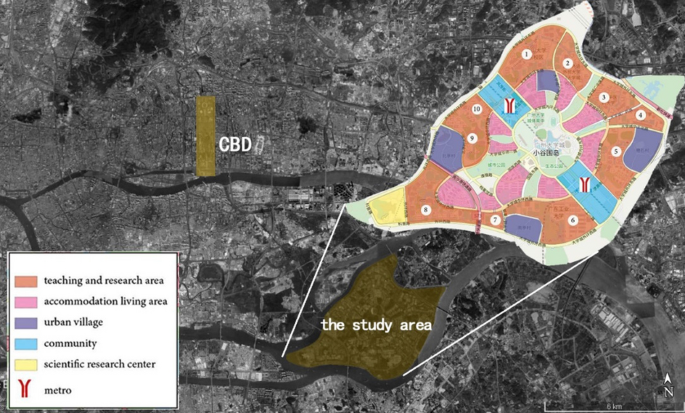
For the case study, we focus on a university town with an estimated population of 200 thousand students. The university town is located in South China, covering 18 square kilometres of land. It comprises ten university campuses, four urban villages, Central Lake Park, and green spaces (Fig. 1).
Data collection and PPGIS
Inspired by PPGIS potentiality, all data were collected by Maptionnaire between January and February 2019. The study protocol was approved by the Ethics Committee of the South China University of Technology. Undergraduates from each students’ union of ten universities randomly sent the link of the survey to their friends or the group chat (consisting of students from the same class, clubs, or organizations) by WeChat (the most popular social media in China). The fact that Maptionnaire can only be accessed by a phone or computer installed with a VPN application makes the process of data collection more challenging than researchers initially expected. In total, we obtained 298 responses, but only 196 responses were analysed since some respondents failed to open the base map due to the technical issues. Concerning the respondents’ background, 41% were male students, and 59% were female (Table 1), while 76% were in the ‘junior group’ (freshmen and sophomores) and 24% were in the ‘senior group’ (juniors, seniors, and graduate students). The sample consisted of nearly 20 students from each of the ten universities. Because the survey was conducted using a convenience sampling technique, which means the sample was not representative for the whole population. We adopted quantitative approaches to test exploratory research questions rather than hypotheses. In practice, this means that our findings are not applicable to the whole population but provide a general overview of the conditions of safety in campuses in the city of Guangzhou. As the results show, the opportunities that this exploratory research provided, however, far outweighed the sample limitations.
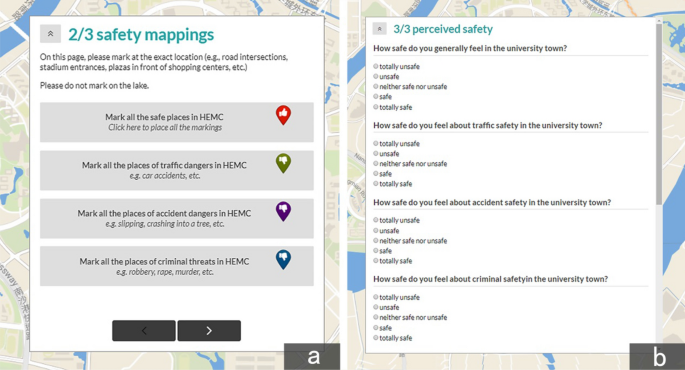
Students agreed to participate voluntarily before answering the survey, which comprised a safety mapping page and a conventional survey about personal information and general questions about perceived safety. Participants were required to mark places with a potential risk of crime, self-inflicted falls, and traffic collisions (Fig. 2a) to distinguish and investigate the different natures of safety. After each mapping task, a pop-up multiple-choice question about why they chose the place appeared. In addition, we set an additional follow-up open question if the existing choices did not include the respondents’ reasons. The appearance of options was randomised to obtain more reliable results.
Respondents also reported their perceived safety level in terms of general safety, traffic, accident, criminal safety (Fig. 2b), and when they commuted to class and walked on campus during the daytime and after dark. All types of perceived safety were evaluated with a 5-point Likert scale ranging from totally unsafe (1) to totally safe (5). Their experiences (personal victimisation or events they heard about) of on-campus crimes were also asked. Each respondent with full answers was offered an incentive of five Yuan (Chinese currency).
Analysing students’ safety perception: individual characteristics
The data were analysed using IBM-SPSS statistical package version 22. Frequencies and cross-tables with Chi-square were performed to indicate the levels of safety declared by university students and their previous experiences about related crimes (including heard of and experienced). The same method was conducted to investigate perceived safety by time of day and by the experiences of the university campus (in this case commuting to class and strolling around the campus).
Assessing campus environment and students’ use and safety perceptions
The spatial data were geocoded using QGIS 3.6 to make the data mappable. Markings located outside the study area or on the central lake were eliminated. To explore the patterns in spatial distributions of safe and unsafe places with a focus on crime and traffic incidents (self-inflicted falls and collisions), grid analyses of related markings were conducted using grids of 150 × 150 m since the study area is relatively large. All squares were illustrated in gradient colour (from light to dark) based on the number of points in each grid. We calculated the frequencies of reasons (both physical and social factors) that accounted for the safety mappings. Another mapping strategy was to map grids with addresses of both crimes and traffic-related incidents, either self-inflicted falls or collisions. The degree of spatial concentration for crime and traffic incidents was defined by the percentage of intersected grids with both mappings.
Identifying commonalities: safe and unsafe areas
We extracted map data from the Open Street Map platform to deepen our understanding of the environmental cues that provoke perceived risks. We classified the study area into university campuses, green spaces, urban villages, and others according to the land-use patterns of the plan (Fig. 1). All collected markings were aggregated to corresponding land-use polygons by their locations. Cross-tables with Chi-square were conducted to highlight spatial concentration patterns for safe and unsafe places according to land-use types. Besides land-use factors, we teased out the commonalities of environments for safe and unsafe areas based on the reasons for mapping the places and the field research.
Results
Students’ safety perception: overall trends
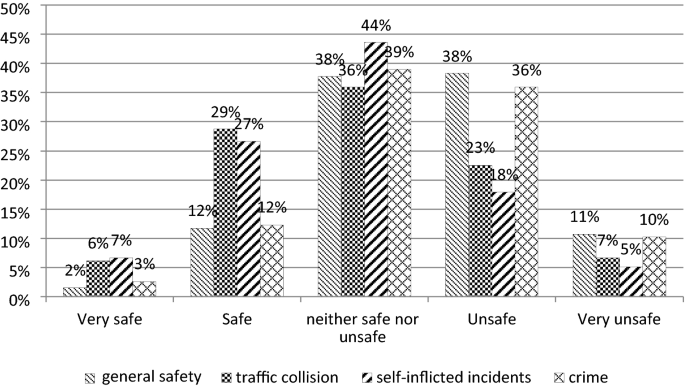
Nearly half (49%) of the respondents declared feeling unsafe on the ten campuses, and only 13% felt safe (Fig. 3). Among those who felt unsafe, 65% were female, and 35% were male. One-fifth of the male students reported feeling safe as compared to 8% of female students. The general perceived safety level was also highly related to fear of crime. For instance, 65% of participants with a lower level of general safety perception were also concerned about being victimised, but only 4% felt safe in terms of crime. Students were asked about the most common heard about or experienced on-campus crimes; theft (53%) was the most frequent, followed by robbery at 32%. Over two-thirds of the students were previously victimised directly or indirectly at least once from on-campus crime.
When asked to associate their safety level with potential events, such as crime and/or traffic accidents, students felt safer in relation to both traffic collisions (M = 3.05, SD = 1.01, t (387) = 4.456, p < 0.001) and self-inflicted falls (M = 3.12, SD = 0.95, t (387) = 5.306, p < 0.001) than in relation to crimes (M = 2.61, SD = 0.92). Nearly half (46%) reported a high level of perceived risk of crime, while 29% and 23% felt unsafe in terms of traffic collisions and self-inflicted falls, respectively (Fig. 3). Safety perceptions also varied by time of day. Students reported significantly lower perceived safety after dark, regardless of whether they were commuting to class, χ2 (16, N = 195) = 80.241, p < 0.001, or strolling around the campus, χ2 (16, N = 192) = 63.634, p < 0.001.
Campus environment and students’ safety perceptions
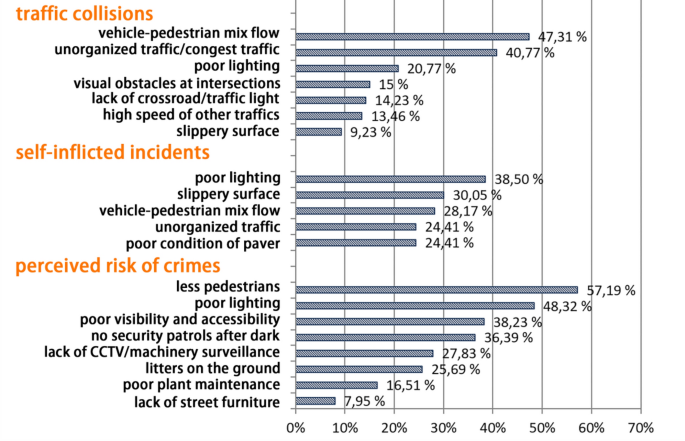
Students were asked to mark places according to their perceptions, from safe to unsafe places. Students marked 1311 areas; 39% were indicated as safe and 61% as unsafe. Results showed that most safe places (86%) were located on campuses (Table 2), and students marked significantly more safe places on campuses than on green spaces, χ2 (1, N = 667) = 249.070, p < 0.001, and in urban villages, χ2 (1, N = 599) = 208.006, p < 0.001. More specifically, students identified more safe locations within the university campuses than in urban villages and green spaces. Safe places were clustered in the accommodation, teaching, and research areas of the ten universities. The most mentioned factor contributing to safe places was the presence of pedestrians (59%), followed by the installation of CCTV and well-lit places at 29% and 28%, respectively (Fig. 4). Students indicated 798 safety markings as unsafe places. Most of them were linked to a potential risk of victimisation (40%, N = 321), followed by a risk of traffic collisions (33%, N = 264) and possible self-inflicted falls (27%, N = 213).
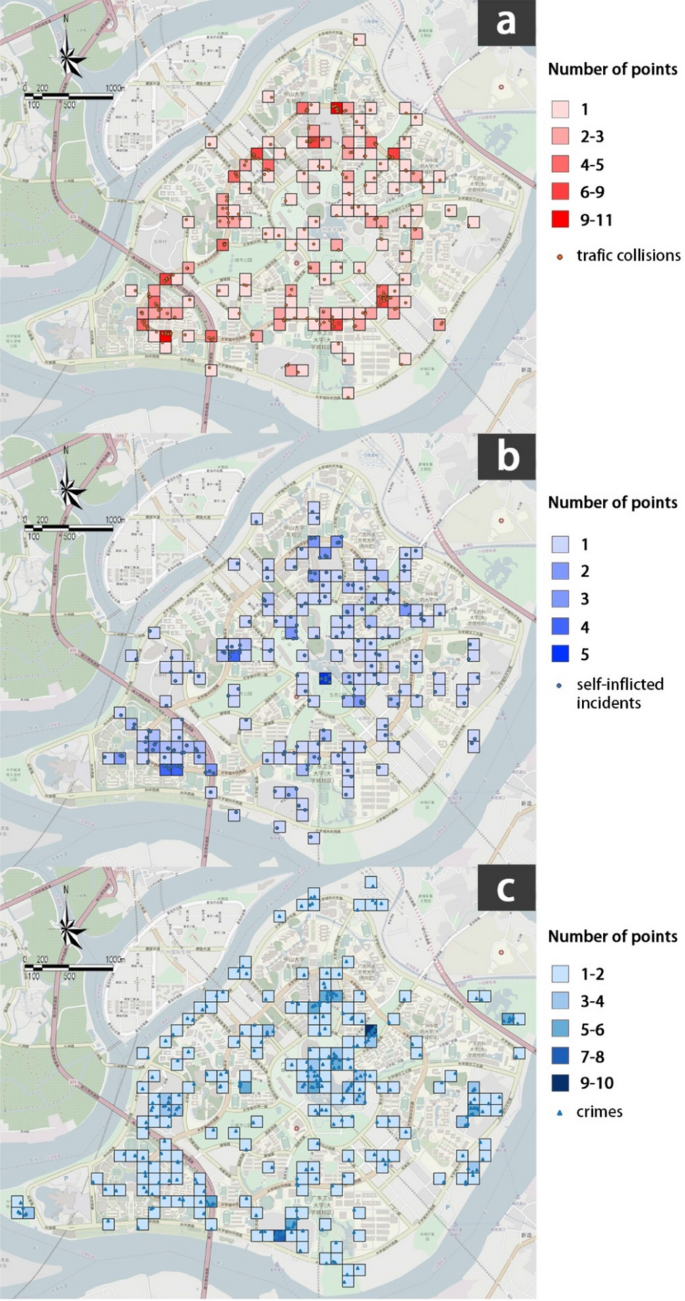
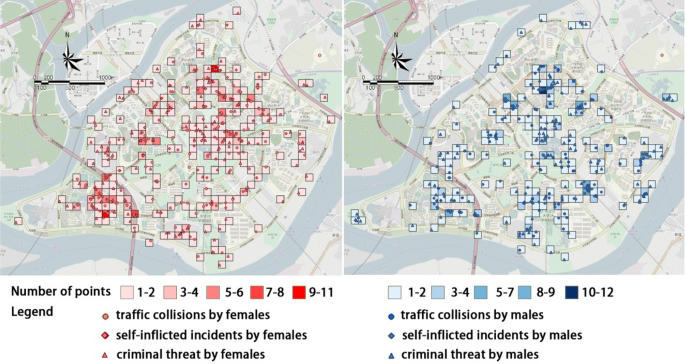
Grid analyses were also performed to show the spatial distribution of fearful places (Fig. 5). The risks of traffic collisions were mainly clustered on the Middle Ring Road, located on the central part of the ten campuses. The most mentioned reasons triggering students’ fear of traffic danger were vehicle–pedestrian mixed-flow (47%) and unorganised or congested traffic (41%). The hot spots of self-inflicted incidents, such as falls and crashing into trees, were situated in the northern and southern parts, where most universities are located, while few markings were placed in the mid-south. Just under two-fifths (39%) reported that poor lighting promoted self-inflicted incidents, followed by slippery surfaces at 30% (Fig. 6).
A scattered pattern of potential criminal incidents could be observed. Students marked the most threat locations in Central Lake Park and four urban villages. For example, approximately two-fifths (38%) of the criminal incidents’ markings were placed in green spaces, where there were significantly fewer markings (5%) of safe places (see Table 2). Places close to the Outer Ring Road were also frequently regarded as criminally dangerous. ‘Lack of pedestrians’ was reported by most students (57%) as a significant criminal fear-evoking factor. Poor lighting was also strongly associated with fear of crime at 48%, followed by poor visibility and accessibility at 38% (Fig. 6).
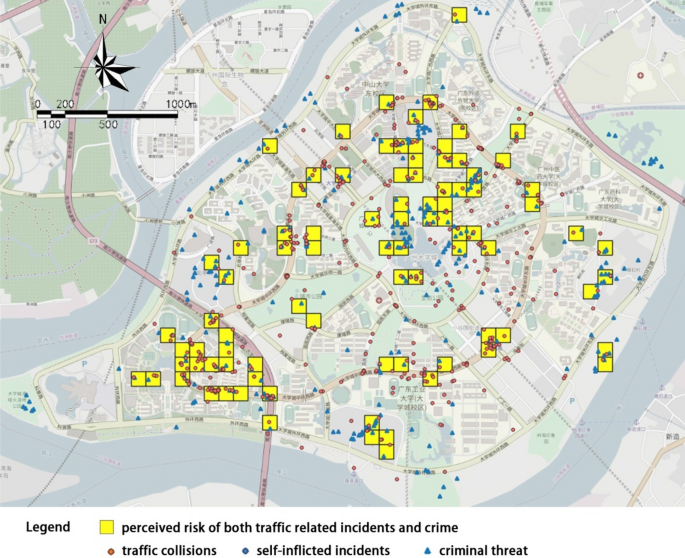
The spatial concentration degree of different perceived dangers was tested by calculating the proportion of grids that comprise both crime and traffic incidents. The grid map above indicated 198 and 223 squares for crime and traffic incidents, respectively (156 for self-inflicted falls and 132 for traffic collisions, but some of them overlapped). Nearly half (88 out of 198) of the crime squares also contained places with perceived risk for traffic incidents, resulting in a relatively high degree of spatial concentration of different perceived dangers. Most of the grids with crime and traffic incidents were located outside campus, mainly concentrated in green spaces and near campus borders (Fig. 7).
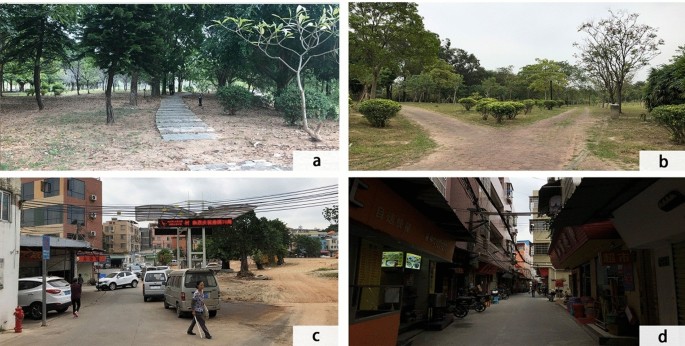
One of the commonalities of these unsafe places was that they were separated from students' daily routines. The physical environmental factors that decreased the visibility of the surroundings (e.g. poor lighting conditions or plants blocking the view) and natural surveillance (e.g. few pedestrians) could negatively impact students’ perceived safety (Fig. 8a). According to students, the lack or poor design of directional signs in green spaces was also regarded as fear-provoking factors (Fig. 8b). Vehicle-pedestrians mixed-flow was positively related to the perceived risk of traffic collisions (Fig. 8c). Dark and shallow alleys with limited viewshed in urban villages could also stimulate some level of personal fear (Fig. 8d).
Safety perceptions by individual characteristics
In addition to the environmental factors mentioned above, personal factors also influenced the safety mappings of students. Students with high general safety perception marked significantly fewer unsafe places than those with more fearful general feelings (χ2 test, p < 0.001***). Besides, previous experiences of victimisation can also be negatively correlated with safety perception. For example, the number of threats marked by students who had experienced or heard about crime incidents on campus was also significantly larger than those marked by students without related experiences (χ2 test, p = 0.006**).
The distribution of unsafe places also differed by gender. For instance, only women reported fear of crime on the northern part of the Outer Ring Road (Fig. 9) and were more likely to indicate unsafe places on green spaces (χ2 test, p = 0.008**). Freshmen marked slightly more unsafe places of traffic collisions on the Middle Ring Road compared to those of seniors. Students who felt unsafe also placed more unsafe markings within Central Lake Park and urban villages (χ2 test, p = 0.001***).
Discussion
Levels of safety perception and individual characteristics
In the present study, we examine the levels of college students’ perceived safety on campus, with a particular focus on the risk of crime and traffic incidents (both traffic collisions and self-inflicted falls). Overall, the perception of danger concerns most students in the studied university town, especially when compared to other universities in the downtown areas of Guangzhou (Huang et al., 2018). Safety perception was affected by individual and environmental factors and differed by the time of day (Sreetheran and van den Bosch, 2014) and potential events.
To be specific, male students feel safer compared to females, which is consistent with those of previous studies (Petherick, 2000). Grade can also affect the safety perception of students; for instance, freshmen are more fearful of traffic collisions incidents than seniors. This may result from the fact that senior students are more familiar with the surroundings. This result supports Odufuwa et al. (2019) who found that respondents who were familiar with sites felt safer than those who were not. Unsurprisingly, students indicate significantly lower perceived safety after dark, regardless of whether they were commuting to class or strolling around the campus. One explanation is that poor lighting conditions and limited viewshed during night-time can generate a climate of fear among students.
Regarding the levels of safety perception concerning potential events, students felt safer in terms of traffic collisions and self-inflicted falls compared to crimes. Environmental factors—such as inadequate lighting conditions and the absence of others—that decrease the opportunity for natural surveillance were positively related to fear of crime.
Safety according to individual characteristics of the students
Gender can significantly affect the spatial patterns of unsafe places; for example, women indicated significantly more unsafe places for scary people than men in a neighbourhood in Espoo, Finland (Kyttä et al., 2014). Similar to Kyttä et al.’s (2014) findings, the number of unsafe places marked by females tends to be larger. Additionally, only female students indicate the northern part of Outer Ring Road as fearful in terms of crimes and mark more unsafe places on green spaces. Freshmen indicate more places with risk of traffic collisions on the Middle Ring Road than seniors. In addition, the general level of perceived safety and previous victimised experiences can also affect the number of unsafe markings.
Safe and unsafe places
Different types of safety mappings show a distinct spatial pattern in our study area. In general, dormitories, academic buildings, and libraries are the hot spots of safe places. The most mentioned reasons for these safe places are the presence of others and CCTV and adequate lighting conditions. All these environmental factors can contribute to the enhancement of natural surveillance. Students mark more safe places on campus than in urban villages and Central Lake Park. These results appear reasonable since all campuses are properly maintained, while the public spaces of urban villages have perceived signs of disorder. Therefore, future renewal programs should consider the importance of urban villages and green spaces to stimulate the vitality of the areas nearby university campuses. Mixed-use development should be advocated because this kind of development has been shown to promote the success of knowledge precincts (Yigitcanlar et al., 2008).
Regarding unsafe places, the Middle Ring Road, which connects the dormitories to academic buildings, is perceived as being the most dangerous regarding traffic collisions, since students must cross some parts of the road without traffic lights. Vehicle-pedestrians mixed-flow is also positively related to the perceived risk of traffic collisions. Places of potential self-inflicted falls display a more scattered pattern, and the reasons for those incidents vary from the lack of streetlights to the poor condition of road surfaces. In terms of threats, university campuses are perceived as the safest places in the university town, whereas more students indicate somewhat fearful perceptions of green spaces and urban villages. Our result also supports Sreetheran and van den Bosch (2014), who considered the absence of others as a social attribute that evokes the fear of crime. Therefore, the use of space and care with the environmental design within university towns should be optimised during all day (and all year around) to enhance the natural surveillance of the surroundings. For instance, public spaces close to campus but outside the campus physical boundary should be better cared for, making them more inviting and attractive to students. In this way, pedestrian activities can be supported, and environmental walkability can increase, providing more natural surveillance and likely increasing students' perceived safety.
The commonalities of unsafe places
Most unsafe places are located near campus but outside the official borders; this result is consistent with the geospatial analyses of campus crimes (Nobles et al., 2010). The university campuses consist of ten universities. The boundaries among the different university campuses are poorly managed and more likely to have signs of disorders than the campus areas since the ownership of the boundary areas is vague. Nevertheless, as Yigitcanlar et al. (2008) suggested, the boundaries between universities and the surrounding urban area should be blurred and indistinguishable. Furthermore, the resources of different universities should be shared to boost cross-boundary interactions. In addition, as time elapses, renovations should be made in these places with low perceived safety to prevent them from becoming ‘blind spots’ for crimes.
Street lighting conditions can significantly predict locations with criminal and traffic risks, since well-lit places can increase environmental visibility and create conditions for natural surveillance (Kim and Park, 2017). Similarly, other physical environmental factors that negatively affect the visibility of the surroundings can also be considered as fear-provoking cues, such as evergreen trees blocking the views (Lindgren and Nilsen, 2012). Similarly, the dark and shallow alleys with limited viewshed in urban villages are the commonality of those unsafe places. Moreover, a poorly maintained and managed environment can also stimulate some level of personal fear. The unimpressive design and low living quality in urban villages do not provide opportunities for optional activities that, according to Gehl (2013), reflect the quality of the city and its spaces. The littered public spaces are occupied by cars, and they lack a sense of community; therefore, the villages are unattractive for outdoor activities and can easily turn into crime generators. Even though it would be difficult to improve the existing building layout to increase environmental visibility, litter can be cleared, and the public space can be better designed. In addition, the idea of active frontages should be implemented in urban villages; for instance, future infill development projects should consider accommodating retail use, such as restaurants, shops, and outdoor cafes. Pedestrian activities could provide passive surveillance and enhance users’ safety perception, liveliness, and comfort (Heffernan et al., 2013). In this way, the sense of community and conviviality of public spaces can be improved, as well as the safety perception of inhabitants.
Implications for landscape and urban planning
Our findings have the potential to grasp several implications for landscape and urban planning. First, if each university was considered as a whole, we might conclude that each campus was perceived as being safe since most of the markings for safe places and a few markings for threats were located on campuses. Unfortunately, it is not realistic for students to consider their university campus as safe without taking the safety condition of their surroundings into account. Hence future planning processes should focus on the whole picture of university towns rather than merely on the university campus. More attention should be given to other land uses to promote mixed-use development in the university town and blur the boundaries of those areas used for studying, working, living and recreation (Yigitcanlar et al., 2008). Second, green spaces that lack activities and are separate from students’ daily routines are perceived as unsafe. Pedestrian flows should be encouraged to go through green spaces to increase their attractiveness and avoid situations where these locations are too far away from or disconnected from students’ daily routes. The environmental design of park entrances should also be more inviting, with more attractive features. Third, designers should offer more spaces considering the ‘edge effect’ principle that Gehl (2013) suggested. According to Gehl (2013), active edges offer people a broad view and physical and psychological support to cover and protect themselves. Providing this space will encourage and invite students to walk by and stay. These views can be designed to be partially obstructed by foliage to engage users’ interests and tempt them to explore the area further (Kaplan and Kaplan, 1989). The environmental design of these mysterious settings should inhibit the perceived danger by ensuring opportunities for both locomotor and visual access (Herzog and Kutzli, 2016).
Conclusion
This study set out to investigate the environmental nature of safety perceptions of university students on campus by adopting a holistic perspective, focusing on safety perceptions of places expected to attract crime and/or traffic incidents (self-inflicted or in collisions). In particular, the study explores the nature of safety from a holistic public-health perspective, focusing on perceptions of crime but also of traffic collisions and self-inflicted falls. The study shows that in addition to the students' individuals’ characteristics, their safety perceptions are also affected by lighting conditions, the presence of others, the installation of CCTVs, and vehicle–pedestrian mixed-flow. Safety is a complex, multifaceted phenomenon with a clear environmental dimension that must be considered when implementing campus safety interventions.
To better assess the nature of safety in different urban settings, we encourage future studies to adopt the PPGIS method combined with photograph survey, which will make it possible to investigate why and how some settings can stimulate fearful feelings. Improving the walkability and visibility of those unsafe places to enhance natural surveillance and create a safe and convivial university town is fundamental. Our findings indicate that most unsafe places indicated by the students are in the vicinity of campus but outside its official borders, which highlights the importance of taking a ‘whole journey approach’ (from door-to-door) when planning for safe university campuses. This requires the cooperation of multiple stakeholders who can deliver basic campus services to students and demand action from housing companies, transport operators, the municipality, and the police.
A limitation of this study is that the sample was restricted to university students and excluded other social groups, such as staff and residents. The study’s reliance on a convenience sample makes it difficult to generalise results to the whole population. Future study should collect larger samples to better understand how intersectional characteristics of individuals (sexual orientation, gender nonconformity, race, ethnicity, age, disability) affect the fear of incidence of crime or traffic injuries in relation to the environmental characteristics of the campuses. Additionally, this study only focuses on localized information collected from participants. Therefore, future research should consider also assessing the perceived safety in light of the official statistics on these unsafe places. Despite these limitations, this study highlights the need for a more comprehensive understanding of the relationship between perceived safety and urban environments in university campuses, especially those that are an integral part of the cities’ urban fabric. The study works a reference to other university towns worldwide when it refers to safety planning on campus as an integral part of the city’s sustainability.
Change history
01 June 2022
A Correction to this paper has been published: https://doi.org/10.1057/s41300-022-00150-4
References
Brown, G., and M. Kyttä. 2014. Key issues and research priorities for public participation GIS (PPGIS): A synthesis based on empirical research. Applied Geography 46: 122–136.
Ceccato, V., and F. Snickars. 2000. Adapting GIS technology to the needs of local planning. Environment and Planning B: Planning and Design 27: 923–937.
Ceccato, V., and O. Willems. 2019. Temporal and spatial dynamics of falls among older pedestrians in Sweden. Applied Geography 103: 122–133.
Chekwa, C., E. Thomas, and V.J. Jones. 2013. What are college students’ perceptions about campus safety? Contemporary Issues in Education Research 6: 325–332.
Fagerholm, N., M. Torralba, G. Moreno, M. Girardello, F. Herzog, S. Aviron, P. Burgess, J. Crous-Duran, N. Ferreiro-Domínguez, A. Graves, T. Hartel, V. Măcicăsan, S. Kay, A. Pantera, A. Varga, and T. Plieninger. 2019. Cross-site analysis of perceived ecosystem service benefits in multifunctional landscapes. Global Environmental Change 56: 134–147.
Fedina, L., J.L. Holmes, and B.L. Backes. 2018. Campus sexual assault: A systematic review of prevalence research from 2000 to 2015. Trauma, Violence & Abuse 19: 76–93.
Fox, J.A., and D.A. Hellman. 1985. Location and other correlates of campus crime. Journal Uf Criminal Jusrice 13: 429–444.
Gargiulo, I., X. Garcia, M. Benages-Albert, J. Martinez, J., K. Pfeffer, and P. Vall-Casas. 2020. Women’s safety perception assessment in an urban stream corridor: Developing a safety map based on qualitative GIS. Landscape and Urban Planning, 198.
Gehl, J. 2013. Cities for People. Washington: D.C., Island press.
Heffernan, E., T. Heffernan, and W. Pan. 2013. The relationship between the quality of active frontages and public perceptions of public spaces. Urban Design International 19: 92–102.
Herzog, T.R., and G.E. Kutzli. 2016. Preference and perceived danger in field/forest settings. Environment and Behavior 34: 819–835.
Hites, L.S., M. Fifolt, H. Beck, W. Su, S. Kerbawy, J. Wakelee, and A. Nassel. 2013. A geospatial mixed methods approach to assessing campus safety. Evaluation Review 37: 347–369.
Hu, J., G. Zhong, Z. Cheng, and D. Wang. 2012. GIS-based road safety evaluation model for cyclist in campus of higher education mega center. In 15th International IEEE Conference on Intelligent Transportation Systems.
Huang, D., B. Jiang, and L. Yuan. 2022. Analyzing the effects of nature exposure on perceived satisfaction with running routes: An activity path-based measure approach. Urban Forestry & Urban Greening, 68.
Huang, D., W. Lai, and R. Xue. 2018. Environmental safety evaluation of university campus based on CPTED Theory-South China University of Technology (Wushan) as an example. Landscape Architecture (chinese) 25: 36–41.
Jennings, W.G., A.R. Gover, and D. Pudrzynska. 2007. Are institutions of higher learning safe? A descriptive study of campus safety issues and self-reported campus victimization among male and female college students. Journal of Criminal Justice Education 18: 191–208.
Kajosaari, A., and T.P. Pasanen. 2021. Restorative benefits of everyday green exercise: A spatial approach. Landscape and Urban Planning, 206.
Kaplan, R., and S. Kaplan. 1989. The Experience of Nature: A Psychological Perspective, CUP Archive.
Kim, D., and S. Park. 2017. Improving community street lighting using CPTED: A case study of three communities in Korea. Sustainable Cities and Society 28: 233–241.
Kingston, R., S. Carver, A. Evans, and I. Turton. 2000. Web-based public participation geographical information systems: An aid to local environmental decision-making. Computers, Environment and Urban Systems 109–125.
Kyttä, M., M. Kahila, and A. Broberg. 2010. Perceived environmental quality as an input to urban infill policy-making. Urban Design International 16: 19–35.
Kyttä, M., J. Kuoppa, J. Hirvonen, E. Ahmadi, and T. Tzoulas. 2014. Perceived safety of the retrofit neighborhood: A location-based approach. Urban Design International 19: 311–328.
Li, X., C. Zhang, and W. Li. 2015. Does the visibility of greenery increase perceived safety in urban areas? Evidence from the place pulse 1.0 dataset. ISPRS International Journal of Geo-Information 4: 1166–1183.
Lindgren, T., and M.R. Nilsen. 2012. Safety in residential areas. Tijdschrift Voor Economische En Sociale Geografie 103: 196–208.
Loewen, L.J., G.D. Steel, and P. Suedfeld. 1993. Perceived safety from crime in the urban environment. JournaI of Environmental Psychology 13: 323–331.
Maier, S.L., and B.T. Deprince. 2019. College students’ fear of crime and perception of safety: The influence of personal and university prevention measures. Journal of Criminal Justice Education 31: 63–81.
Morency, P., C. Voyer, S. Burrows, and S. Goudreau. 2012. Outdoor falls in an urban context: Winter weather impacts and geographical variations. Canadian Journal of Public Health 103: 218–222.
Nobles, M.R., K.A. Fox, D.N. Khey, and A.J. Lizotte. 2010. Community and campus crime. Crime & Delinquency 59: 1131–1156.
Odufuwa, B., A.I. Badiora, D.O. Olaleye, P.A. Akinlotan, and T.M. Adebara. 2019. Perceived personal safety in built environment facilities: A Nigerian case study of urban recreation sites. Journal of Outdoor Recreation and Tourism 25: 24–35.
Patton, R.C., and D.E. Gregory. 2014. Perceptions of safety by on-campus location, rurality, and type of security/police force: The Case of the Community College. Journal of College Student Development 55: 451–460.
Paydar, M., A. Kamani-Fard, and R. Etminani-Ghasrodashti. 2017. Perceived security of women in relation to their path choice toward sustainable neighborhood in Santiago, Chile. Cities 60: 289–300.
Perumean-Chaney, S.E., and L.M. Sutton. 2012. Students and perceived school safety: The impact of school security measures. American Journal of Criminal Justice 38: 570–588.
Petherick, N. 2000. Environmental design and fear: The prospect-refuge model and the university college of the Cariboo Campus. Western Geography, 89–112.
Plieninger, T., M. Torralba, T. Hartel, and N. Fagerholm. 2019. Perceived ecosystem services synergies, trade-offs, and bundles in European high nature value farming landscapes. Landscape Ecology 34: 1565–1581.
Ramezani, S., T. Laatikainen, K. Hasanzadeh, and Kyttä, M. 2019. Shopping trip mode choice of older adults: An application of activity space and hybrid choice models in understanding the effects of built environment and personal goals. Transportation 48: 505–536.
Regehr, C., G.D. Glancy, A. Carter, and L. Ramshaw. 2017. A comprehensive approach to managing threats of violence on a university or college campus. International Journal of Law and Psychiatry 54: 140–147.
Richardson, E.A., and R. Mitchell. 2010. Gender differences in relationships between urban green space and health in the United Kingdom. Social Science and Medicine 71: 568–575.
Rolison, J.J., and S. Moutari. 2020. Combinations of factors contribute to young driver crashes. Journal of Safety Research 73: 171–177.
Scarborough, B.K., T.Z. Like-Haislip, K.J. Novak, W.L. Lucas, and L.F. Alarid. 2010. Assessing the relationship between individual characteristics, neighborhood context, and fear of crime. Journal of Criminal Justice 38: 819–826.
Schepers, P., B. den Brinker, R. Methorst, and M. Helbich. 2017. Pedestrian falls: A review of the literature and future research directions. Journal of Safety Research 62: 227–234.
Schneider, R.J., A.J. Khattak, and C.V. Zegeer. 2001. Method of improving pedestrian safety proactively with geographic information systems example from a college campus. Transportation Research Record 1773: 97–107.
Shariati, A., and R.T. Guerette. 2019. Resident students’ perception of safety in on-campus residential facilities: Does crime prevention through environmental design (CPTED) make a difference? Journal of School Violence 18: 570–584.
Sreetheran, M., and C.C.K. van den Bosch. 2014. A socio-ecological exploration of fear of crime in urban green spaces—A systematic review. Urban Forestry & Urban Greening 13: 1–18.
van Rijswijk, L., and A. Haans. 2017. Illuminating for safety: Investigating the role of lighting appraisals on the perception of safety in the urban environment. Environment and Behavior 50: 889–912.
Wood, L., T. Shannon, M. Bulsara, T. Pikora, G. McCormack, and B. Giles-Corti. 2008. The anatomy of the safe and social suburb: An exploratory study of the built environment, social capital and residents’ perceptions of safety. Health & Place 14: 15–31.
Yigitcanlar, T., F.J. Carrillo, K. Velibeyoglu, and C. Martinez-Fernandez. 2008. Rising knowledge cities: The role of urban knowledge precincts. Journal of Knowledge Management 12: 8–20.
Zheng, C. 2016. Female Student Killed on Guangzhou University Campus. China Daily.
Zou, Y., and R.I. Mawby. 2020. Perceptions of safety among visitors to China: Feeling safe in an unfamiliar environment. SAFER COMMUNITIES, 1–16.
Author information
Authors and Affiliations
Corresponding author
Ethics declarations
Conflict of interest
On behalf of all authors, the corresponding author states that there is no conflict of interest.
Additional information
Publisher's Note
Springer Nature remains neutral with regard to jurisdictional claims in published maps and institutional affiliations.
Rights and permissions
Open Access This article is licensed under a Creative Commons Attribution 4.0 International License, which permits use, sharing, adaptation, distribution and reproduction in any medium or format, as long as you give appropriate credit to the original author(s) and the source, provide a link to the Creative Commons licence, and indicate if changes were made. The images or other third party material in this article are included in the article's Creative Commons licence, unless indicated otherwise in a credit line to the material. If material is not included in the article's Creative Commons licence and your intended use is not permitted by statutory regulation or exceeds the permitted use, you will need to obtain permission directly from the copyright holder. To view a copy of this licence, visit http://creativecommons.org/licenses/by/4.0/.
About this article
Cite this article
Huang, D., Ceccato, V. & Kyttä, M. Safety perceptions in university campuses: the role of environment. Crime Prev Community Saf 24, 266–285 (2022). https://doi.org/10.1057/s41300-022-00148-y
Accepted:
Published:
Issue Date:
DOI: https://doi.org/10.1057/s41300-022-00148-y


