
Abstract
The Tarim River Basin in Xinjiang, China, has a typical desert riparian forest ecosystem. Analysis of the resilience of this type of ecosystem under extreme drought conditions and ecological rehabilitation projects could provide a theoretical basis for understanding ecosystem stability and resistance, and provide new ecological rehabilitation measures to improve ecosystem resilience. We employed a quantitative framework to assess net primary productivity (NPP) resilience, emphasizing four aspects of NPP dynamics: NPP, NPP stability, NPP resistance, and maximum NPP potential. We compared ecosystem resilience across four time periods: before the implementation of ecological rehabilitation projects (1990–2000), during construction and partial implementation of ecological rehabilitation projects (2001–2012), during the initial project stage of ecological rehabilitation (2013–2015), and during the late project stage of ecological rehabilitation (2016–2018). There are three main finding of this research. (1) Mean NPP was increased significantly from 2013 and was decreased from 2016, especially in the main stream of the Tarim River and in the basins of eight of its nine tributary rivers. (2) Ecosystem resilience in 2013–2018 was greater than in 1990–2012, with the greatest NPP stability, mean NPP and NPP resistance, especially in part one of the river basin (the Aksu River, the Weigan-Kuche River, the Dina River, the Kaidu-Konqi River, and the main stream of the Tarim River). Ecosystem resilience in 2001–2012 was lowest when compared to 1990–2000 and 2013–2018, with lowest mean NPP, NPP stability, NPP resistance and maximum NPP potential, particularly in part two of the river basin (the Kashigr River, the Yarkand River and the Hotan River basins). Therefore, part one was most affected by ecological restoration projects. When 2013–2018 was divided into two distinct stages, 2013–2015 and 2016–2018, resilience in the latter stage was the lowest, with lowest mean NPP, NPP resistance and maximum NPP potential, especially in the main stream of the Tarim River. This may be due to unreasonable water conveyance in 2014–2015. (3) Ecological resilience has increased significantly in 2013–2015 after the implementation of ecological water transfer projects, river regulation, and natural vegetation enclosure projects. Ecosystem resilience could continue to increase even more in the future with the continued implementation of reasonable ecological water transfer projects.
Introduction
Climate change and the intensification of human activities have led to serious external disturbances to ecosystems, including drought1,2, short-term climate anomalies3,4,5, lack of resources6,7, species invasion7, and fire8. Ecosystem resilience theory may help us to understand how ecosystems deal with these threats9,10,11, as both scientists and the general public have become deeply concerned about the ongoing resilience of ecosystems to external disturbances12,13.
Resilience research has, for the most part, focused on wetland, river, mountain, city, farmland, forest, and cold desert shrub land ecosystems1,2,3,5,6,7, while there has been little exploration of the resilience of desert riparian forest ecosystems. Desert riparian forests, consisting primarily of Populus euphratica (desert Poplar), are found along rivers that run through deserts. The world’s three major Populus euphratica forests are located in China: in the Tarim River Basin and Yiwu County, both in Xinjiang Province, and in Ejina Banner in Inner Mongolia, with 90% of Populus euphratica forest located in the Tarim River Basin. Desert riparian forests are a valuable natural forest resource that14 plays an important role in preventing wind and sand erosion, controlling desertification, maintaining regional economic development and ecological security, protecting biodiversity, and ensuring oasis agricultural and animal husbandry production15,16. In recent years, driven by regional population growth and economic development, the large-scale exploitation of water and land resources has led to the year-round cessation of the course of the Tarim River, ultimately causing Lake Titema to dry up, the groundwater level to drop significantly, the desert riparian forest ecosystem to degenerate, and the vegetation to decline17. To restore this severely damaged ecosystem, the local governments have invested and implemented various ecological rehabilitation engineering measures with remarkable ecological restoration benefits18. Among these benefits has been an increase in the height of the water table near the course of the river19, and a certain level of vegetation restoration in some areas20. However, full restoration and the natural regeneration of vegetation have not yet been achieved. Therefore, new control measures are required, and understanding the resilience of the desert riparian forest ecosystem to external disturbance is a scientific problem that needs to be urgently solved.
Scholars have used a variety of methods to assess the resilience of different ecosystems. These include quantifying the factors affecting forest ecosystem resilience21, comprehensive analysis of soil and water conservancy characteristics, the analysis of land use and climate factors in the ecosystem community22, monitoring of soil water content and soil temperature23, the response of surface vegetation to precipitation, changes in water use efficiency24, and calculating ecosystem resilience using linear regression modeling of the Normalized Difference Vegetation Index (NDVI), drought index (SPEI), and air temperature3. These methods incorporate many factors, including climate, hydrology, vegetation, and soil. There is some research that uses in-depth analysis of the effects of vegetation factors on ecosystem stability and resistance2. For example, Frazier et al.25 analyzed total primary productivity (TPP), Ponce Campos et al.24 analyzed the sensitivity of the above-ground net primary production (NPP) of terrestrial ecosystems to altered hydroclimatic conditions to reflect ecosystem resilience, Kahiluoto et al.26 and Li et al.2 used crop yield data to study the resilience of crops to climatic disturbances, and Li et al.27 analyzed gymnosperm resilience using tree ring data. The resilience indices of terrestrial ecosystems used in each of these studies was related to the productivity of surface vegetation24,25,26,27. Based on this earlier scholarship, this paper considers the productivity of desert riparian forests. Tree ring data is only suitable for trees, and not for shrubs and herbs. Given that desert riparian forests are composed of trees, shrubs, and herbs, tree ring data cannot fully reflect the productivity of desert riparian forests. Primary production (PP) is defined as the quantity of products that an autotroph produces through photosynthesis or chemosynthesis12,28. Net primary productivity (NPP) is TPP minus consumption by autotrophs for photosynthesis or chemosynthesis12,28, and includes consumption by autotrophs29. NPP, therefore, reflects the productivity of the plant community under natural environmental conditions29. Thus, in this research, vegetation NPP was selected to assess ecosystem stability and resistance to reflect desert riparian forest ecosystem resilience. In other words, NPP is a measure of the productivity and eco-environmental quality of vegetation under natural conditions28, climate warming can directly affect the NPP of terrestrial ecosystems through photosynthesis, as well as indirectly through soil absorption30. Therefore, the impact of vegetation on ecosystem resilience is generally expressed according to vegetation NPP30.
To understand external environmental stress, scholars have focused on climate change stress1,2,3,4,5 and species invasion stress7, while there has been little focus on the integrated impact of climate change and human activities.
In recent decades, the Tarim River Basin has both suffered from extreme drought and benefited from ecological management31,32. Ecological management has changed water demand and supply in the desert riparian forest32, affecting vegetation growth18. Understanding how ecosystem resilience changes under these two environmental stresses is a key issue in the restoration of the damaged ecosystem. To help understand this change, we propose a framework to compare the impacts of ecological management on NPP resilience by referring to the research of Li et al.2, which explored agro-ecosystem resilience by analyzing yield stability and resistance according to yield change. In the case of this current research, agricultural yield was replaced with NPP. There are four parts to the framework: (1) statistical analysis of NPP and NPP trends, (2) NPP stability, (3) NPP resistance, and (4) maximum NPP potential. Statistical analysis of NPP and trends over time can reveal warning signals of change in the state of the system resulting from climate change and management-induced changes to ecosystem processes that might impair or improve long-term resilience. NPP stability measures the ability of the desert riparian forest ecosystem to maintain consistent NPP over time within normal environmental variation, such as temperature and water resources fluctuations. NPP resistance reflects the ability of desert riparian forest ecosystems to mitigate the risk of NPP decline due to extreme drought, while maximum NPP potential measures the ability of systems to produce high NPP under optimum conditions. Based on the research of Li et al.2, the larger the mean NPP, NPP stability, NPP resistance and maximum NPP potential, the greater the ecosystem resilience. This approach provides a strong foundation for future analysis of resilience across different ecological management types and provides insights into the design of sustainable ecological management measures that go beyond NPP maximization to consider resilience.
Study area and method
Site description
The desert riparian forest of the Tarim River Basin (Fig. 1 (ArcGIS 10.2.2 software, URL: https://www.esri.com)) is located in southern Xinjiang Uygur Autonomous Region, China, and has an area of 11.4 × 10⁴ km2. The Tarim River Basin is composed of the basins of the Aksu River, the Yarkand River, the Hotan River, the Kaidu-Konqi River, the Weigan-Kuche River, the Kashigr River, the Dina River, the Keliy River, the Cheercheng River, and the main stream of the Tarim River (Fig. 1). Due to differences in topography and geomorphology, the desert riparian forest is mostly distributed in the middle and lower reaches of each river basin and along the entire main stream of the Tarim River33. According to existing literature, there is no evident desert riparian forest boundary between the upper, middle, and lower reaches of these tributaries, so a comparative analysis of ecosystem resilience between the upper, middle, and lower reaches of each river basin was not conducted. However, spatial variability for desert riparian forest as a whole was explored. Land use data were derived from the Global Land Cover Characterization from the International Geosphere-Biosphere Program (IGBP) (http://nsidc.org/data/ease/ancillary.html#igbp_classes) in 2018. From these data, a routine integrated classification of land use/cover change (LUCC) characteristics was obtained based on feature fusion processes. The landscape is composed of 45% barren land, 35% grassland and 16% farmland, urban land, and water. Although only 4% of the land is forested, forest is very important to the maintenance of ecosystem service functions. Among the dominant constructive species are Populus euphratica, Tamarix ramosissima and Alhagi chinensis. Between 1990 and 2018, the area of desert riparian forest reduced by a significant 1.78 × 10⁴ km2 due to a combination of drought and economic development34.

Distribution map of the Tarim River Basin desert riparian forest, Xinjiang, China.
The Tarim River Basin has a temperate continental climate characterized by little rain and strong evaporation. In the early Tertiary Period, around 22 million years ago, the collision of India with the Eurasian Plate and the subsequent uplift of the Tibetan Plateau changed atmospheric circulation and geographic patterns in Asia, forming the basic topography of the Tarim River Basin35. The current desert environment in southern Xinjiang was formed during the last glacial maximum (20,000–14,000 years ago)35. Average annual precipitation is 17.4–42.8 mm, the evaporation capacity is 1800–2900 mm, with a maximum wind speed of 40 m/s, the annual average temperature is 10.7 °C, with a maximum temperature of 39–42 °C, and 2550–3500 of sunshine hours.
The primary water resources in the Tarim River are glacial and snow meltwater from the alpine area to the west. This water flows through the oasis and the desert riparian forest before finally disappearing into the desert or terminal lakes. Water resources, therefore, are incredibly scarce. With an increase in population from 8.26 million in 1998 to over 10.61 million in 2018, and attendant socio-economic development, water from the ecosystem is increasingly used in production and urban living. Climatic conditions have caused the river course to be truncated, and there has been significant decline in the natural vegetation in the lower reaches of the basin. In 2001, the local government implemented conservation and restoration projects for desert riparian forests along the Tarim River Basin to alleviate the serious and on-going degradation of natural vegetation. These projects include ecological water conveyance, river regulation, and natural vegetation enclosure projects20,32. River regulation has reduced water loss due to leakage20,32,36, while the loss of vegetation due to human and animal impacts has been reduced, and the natural restoration of vegetation has been promoted through natural vegetation enclosure projects37. From 2001 to 2018, an ecological emergency water transfer project was implemented in the lower reaches of the main stream of the Tarim River38, with a cumulative discharge of 7700 million m3. The largest average discharge of 759 million m3 occurred in 2011–2012. The quantity of ecological water to promote the restoration of the desert riparian forest has been increased39, and the groundwater level has risen40 through ecological water conveyance in the lower reaches of the main stream of the Tarim River. The construction of these projects was completed by the end of 201218. Therefore, 2001–2012 was a period during which some projects were constructed and others were implemented. From 2013, all projects were formally implemented, resulting in 7471 km of canal seepage control, 824.60 km of water conveyance dams to harness the main stream, 37 km2 of farmland closed to cultivation and 3590 km2 of protected forest and grasslands18. Previous research has found remarkable ecological restoration benefits following the implementation of part of these ecological rehabilitation projects18. However, the concept of NPP has not yet been applied to an analysis of ecosystem restoration efforts.
Date and methods
The desert riparian forest of the Tarim River Basin has suffered both negative stress (extreme drought) and positive stress (the implementation of ecological rehabilitation projects). We took 1990–2000, 2001–2012, and 2013–2018 as before intervention, during the construction period, and after the implementation of ecological rehabilitation projects, respectively, to explore the change, stability, and resistance of NPP as a reflection of ecosystem resilience.
Data collection
The Light Utilization Ratio Model was used to calculate NPP from 1990 to 2018 (see41 for the specific calculation method). Climate data, including air temperature, sun light intensity, and sunshine hours, were derived from the Chinese Meteorological Science data-sharing service network (https://data.cma.cn/). Normalized Difference Vegetation Index (NDVI) data for the relevant counties from 1990 to 2018 were retrieved from the Climatic Research Unit (http://www.cru.uea.ac.uk/web/cru/). Groundwater depth data in the middle and lower reaches of the main stream of the Tarim River in 2000–2010 were obtained from long-term field monitoring by our research team. The location map of the monitoring wells is shown in Supplementary Figure S1. Groundwater depth monitoring wells distributed in the lower reaches of the basins of the Aksu River, the Hotan River, the Yarkand River, the Kaidu-Konqi River, the Weigan-Kuche River, the Kashigr River, and the Dina River were set up in 2018. At the time of writing, there are only three years of continuous monitoring data, so these cannot be used to explain the effect of groundwater depth on ecosystem resilience. Groundwater depth change in the middle and lower reaches of the main stream of the Tarim River (see the box area in Supplementary Figure S1) was analyzed to reflect the impact of groundwater depth on ecosystem resilience.
Mean NPP and trends
All statistical analyses were performed using SPSS Statistics 12.0, SigmaPlot 12.0 and Microsoft Excel 10.0. Long term mean NPP for the three periods were analyzed using a linear mixed-effects model with NPP as the fixed effect and year as the random effect. Post-hoc Tukey multiple comparisons of means were applied to compare mean NPP across the three periods with confidence intervals adjusted using the Sidak method2. The three periods were allowed to have different within-group variances in the model to account for the non-homogeneity of variance. The assumption of normal distribution of residues was verified with the Shapiro–Wilk normality test2.
NPP stability
Four NPP stability metrics per period were calculated and compared: (1) NPP range, (2) coefficient of variation (CV), (3) NPP variance, and (4) Finlay-Wilkinson (FW) regression slope2. NPP range represents the range between the highest and lowest NPP of each period. The other three stability metrics were obtained based on de-trended NPP data (i.e., residuals from regressing NPP against year with period-specific intercepts and slopes) to remove potential biases from NPP increases associated with the implementation of ecological rehabilitation projects2. The CV was calculated by dividing the temporal standard deviation by the mean NPP. NPP variance represents temporal variance over the three periods. FW regression slopes were obtained by regressing the de-trended NPP of each period to the environmental index (EI)2. EI is expressed as the average of annual de-trended NPP over the three periods and is used as an indication for the overall NPP ability at the respective environmental condition2. Periods with smaller NPP range, CV, NPP variance, and FW slopes indicate higher NPP stability2. The overall NPP stability of each period was ranked based on the mean stability rank for the four stability metrics2.
NPP resistance
NPP resistance is a key property of resilience and represents the ability of systems to avoid NPP failure under stressful conditions2. NPP resistance was calculated using two metrics: (1) probability of NPP failure based on frequency distributions, and (2) predictions of minimum NPP according to EI2.
Probabilities of low NPP were performed by estimating the probability densities of NPP in each period. The probabilities of the three periods to achieve low NPP (< 10th percentile of the pooled NPP distribution estimate) were extracted2. The significance of the probabilities of low NPP was determined by comparing each period to the probabilities of low NPP from 1553 randomized NPP sets. The pseudo-p for low NPP probability represents the percentage of times that each period would have NPP lower than the distribution of randomized NPP using a left-tail test2. The second method compared the predictions of minimum NPP in the three periods under unfavorable growing conditions (lowest EI) based on a linear mixed-effects model with EI and system as fixed effects and block as the random effect2. To indicate actual NPP ranges, de-trended NPP was re-centered to the mean NPP of each period (i.e., adding mean NPP to de-trended data).
Maximum NPP potential
Using the same method as NPP resistance, we estimated the probabilities to obtain high NPP (> 90th percentile of the pooled NPP distribution estimate) in the three periods, and the maximum NPP potential under favorable conditions (highest EI)2. This measurement helped to indicate management-induced differences in the potential of NPP to capitalize on favorable growing conditions.
Results
Mean NPP and trends
There was no significant difference in mean NPP between 1990–2000, 2001–2012, and 2013–2018 (F2, 4659 = 0.13, Sig. = 0.27), but there was a significant difference between 2013–2015 and 2016–2018 (F1,3103 = 12.24, Sig. = 0). There were also significant differences for 1990–2000, 2001–2012, 2013–2018 compared to 2013–2015 and 2016–2018 (F1,3103 = 3.51, Sig. = 0) (Fig. 2). This indicates that NPP varied from 2013 onward. NPP was largest in 2013–2015 and smallest in 2016–2018, exhibiting an increasing trend in 1996–1999, 2002–2007, and 2013–2015, and a decreasing trend in the other time intervals (Fig. 3). NPP was decreased in 2007–2013 due to a dry year in 2007–2009, when there was almost no water supply to the ecosystem from the Tarim River. Runoff increased from 2010, but NPP did not recover until 201342. After 2013, NPP was increased rapidly, but fluctuated between 2016 and 2018. Because NPP was increased significantly in 2013–2015, and then was decreased in 2016–2018, we used two separate phases (2013–2015 and 2016–2018) to analyze ecosystem resilience.
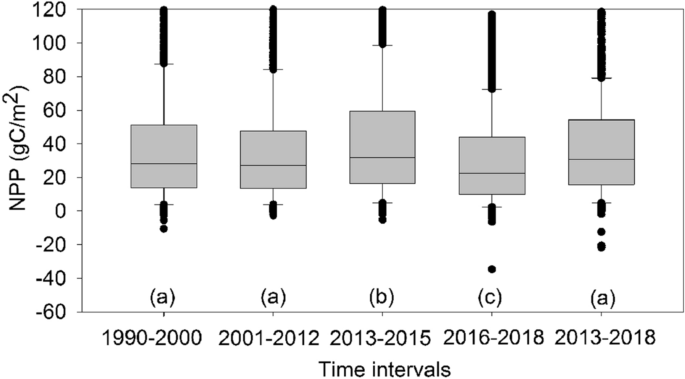
Mean NPP at three time intervals. Letters represent significant differences in mean NPP at the 0.05 significance level.
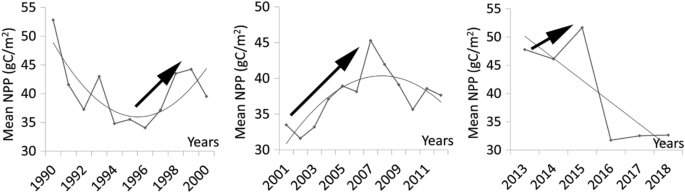
Trend of NPP in (a) 1990–2000, (b) 2001–2012, and (c) 2013–2018.
Spatial variations of NPP in 1990–2018 were analyzed (Fig. 4). According to the geographical location and distribution of each river basin in the Tarim River Basin system (Fig. 1), we artificially divided the desert riparian forest into five parts. Part one consisted of the basins of the Aksu River, the Weigan-Kuche River, the Dina River, the Kaidu-Konqi River, and the main stream of the Tarim River. Part two consisted of the basins of the Kashigr River and the Yarkand River. Part three consisted of the Hotan River basin. Part four consisted of the Keliy River basin. Part five consisted of the Cheercheng River basin. NPP was significantly different between most of the river basins (F1169 = 2.61, Sig. = 0). No significant difference (F1169 = 2.61, Sig. = 0.14) was found between parts two and three, so these were regrouped into part two. Finally, the desert riparian forests of the Tarim River Basin were divided into four parts.

The spatial variation of NPP in the different time intervals.
Further analysis was conducted on variations in NPP in the desert riparian forest in each part during the different time intervals (Fig. 4).
In part one, NPP exceeded 57 gC/m2 and was increased significantly in 2013–2018 compared to 1990–2012. NPP was increased at a rate of 29.27% (F677 = 2.94, Sig. = 0) in 2013–2015 compared to 1990–2012, and was decreased after 2015 at a rate of 38.69% (F677 = 2.94, Sig. = 0) compared to 1990–2012.
In part two, NPP in 2013–2015 was increased by 12.88% (F539 = 0.71, Sig. = 0) compared to 1990–2012, and was decreased after 2015 with the bigger decrease rate of 25.32% (F539 = 0.71, Sig. = 0) compared to 1990–2012.
In part three, NPP in 2013–2018 was increased significantly (F238 = 0.69, Sig. = 0.02) compared to 2001–2012. In 2013–2015, NPP was increased significantly at a rate of 24.08% (F238 = 0.69, Sig. = 0.01) compared to 1990–2012, but was decreased in 2016–2018 at a rate of 14.29% (F238 = 0.69, Sig. = 0.05) compared to 1990–2000.
In part four, there were no significant differences between the time intervals (F215 = 0.12, Sig. = 0.31) with an annual average NPP of 26 gC/m2 and, therefore, no obvious increase or decrease in vegetation productivity level over the 29-year period.
NPP stability
When 2013–2018 is considered as a whole, NPP during this period was the most stable, with the lowest NPP range, CV and FW slope of the three intervals compared to 1990–2000 according to ranking (Table 1). The FW slope in 2001–2012 was negative (Fig. 5, R2 = 0.89), indicating that NPP in 2001–2012 decreased as EI increased, and vegetation continued to gradually degrade alongside improvements to environmental conditions. When 2013–2018 is considered as two distinct stages, 2013–2015 and 2016–2018, the FW slopes in 2013–2015 and 2016–2018 were positive, but non-significant (Fig. 5, R2 = 0.04 and 0.13). According to the ranks in the different time intervals, ecosystem stability was the same in 2013–2015 and 2016–2018 (Table 1). The least stable stage was 1990–2000 (Table 1).
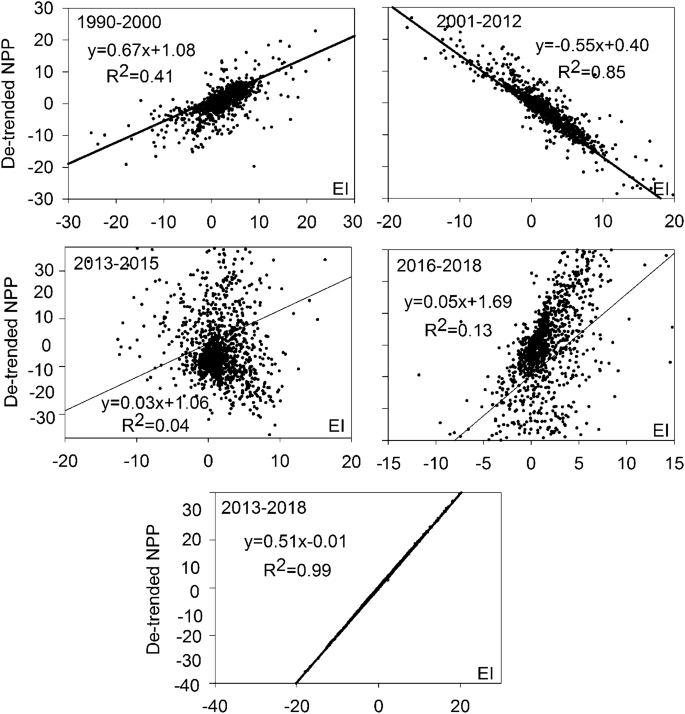
NPP stability by regressing de–trended NPP in the different time intervals against the environmental index (EI) calculated as the yearly mean de–trended NPP.
NPP resistance
When 2013–2018 is considered in two stages, 2013–2015 and 2016–2018, ecological management significantly decreased the risk of low NPP, with the lowest probability of NPP failure (< 10th percentile) at 3.30% and 3.00% in 2013–2015 and 2016–2018, respectively, compared to 5.35% in 1990–2000 (Table 2), especially in parts one and three (Table 2). The possibility of high NPP increased non-significantly (Table 2). When 2013–2018 is considered as a whole, ecological rehabilitation significantly decreased the risk of low NPP (Table 2), indicating that the average response of vegetation was favorable in 2013–2018 (i.e., highest EI), compared to 1990–2000.
Over the entire basin, vegetation was more resistant to unfavorable conditions in 2013–2018, as indicated by a higher minimum NPP potential (0.30 gC/m2), than in 2001–2012 (0.10 gC/m2) and 1990–2000 (0.16 gC/m2), under the lowest EI (Table 2), especially in parts one, two and four. Minimum and maximum NPP potentials increased briefly and significantly in 2013–2015 compared to 1990–2000, but decreased precipitously in 2016–2018. This suggests that the implementation of ecosystem rehabilitation projects decreased the probability of low NPP, but with the possibility of ongoing fluctuations.
Ecosystem resilience
Ecosystem resilience in 2013–2018 was highest when compared to 1990–2012 (Fig. 6a), with the highest NPP stability, mean NPP, and NPP resistance, especially in part one (Fig. 6d), where the average ratio of the four indicators was highest in 2013–2018. When 2013–2018 is considered in two stages, 2013–2015 and 2016–2018, ecosystem resilience in 2016–2018 was lowest when compared to other time intervals (Fig. 6b), especially in part one (Fig. 6e). Ecosystem resilience in 2001–2012 was lowest when compared to 1990–2000 and 2013–2018 (Fig. 6a), with the lowest mean NPP, NPP stability, NPP resistance and maximum NPP potential, especially in part two (Fig. 6c). Therefore, areas in part one were most affected by ecological restoration projects.

Summaries of NPP resilience in 1990–2000, 2001–2012, 2013–2015, 2016–2018, and 2013–2018, in the different regions. Values represent the ratio of the NPP performance at each time interval to the maximum. NPP stability is the average ratio of four stability metrics (see Table 1). NPP resistance is the ratio of minimum NPP potential (see Table 2).
Discussion
Resilience assessment method of desert riparian forest ecosystems
The resilience of desert riparian forest ecosystems under the stresses of extreme drought and ecological engineering has been ignored by scholars. Thus far, no suitable method to assess the resilience of desert riparian forest ecosystems had been proposed. Building on the work of Li et al.2, this innovative research applied a comparative analysis of NPP resilience to the desert riparian forest before and after the construction of ecological engineering projects. We proposed and implemented an NPP resilience assessment framework, which quantified four core aspects of long-term NPP dynamics: absolute NPP, NPP stability, NPP resistance, and maximum NPP potential. The framework allowed a better integration of resilience and stability metrics into desert riparian forest ecosystem performance assessments based on long-term NPP dynamics and provided a strong foundation for the long-term comparison of ecological engineering approaches. In this paper, the framework successfully identified NPP-specific resilience responses to the implementation of ecological rehabilitation projects.
The impact of climate change on resilience
An analysis of the correlation between NPP and air temperature, precipitation, sunshine duration, and light intensity was conducted (Table 3). The results show that only the correlation between NPP and sunshine duration was significant in the Tarim River Basin, and non-significant with other climatic factors. However, there was no obvious increase or decrease in annual sunshine duration (R2 = 0.04) and NPP (R2 = 0.03) in 1990–2015 (Supplementary Figure S2). Therefore, we do not believe that a change in sunshine hours plays a dominant role in NPP and ecosystem resilience.
The impact on resilience of water quantity change used for natural vegetation growth
The vegetation in the Tarim River Basin desert riparian forest is composed of trees dominated by Populus euphratica, shrubs dominated by Tamarix ramosissima and herbaceous plant. The occurrence of young Populus euphratica forests is limited to the flood plain and near the river course43, and the number is very small, Most are mature and over-mature Populus euphratica44. Therefore, in this paper, the response of the resilience of young Populus euphratica on ecological rehabilitation projects can be neglected.
The vegetation in the Tarim River Basin desert riparian forest has declined considerably under the stress of long-term extreme drought31,32. To restore this seriously damaged ecosystem, the local government has implemented a series of ecological management projects18. Ecological engineering has varied water management and allocation in the basin, which has made the groundwater depth shallower in the lower reaches of the main stream of the Tarim River (Supplementary Figure S4)41. The growth of vegetation is mainly influenced by the groundwater44. As the groundwater depth became shallower, average NPP and ecological resilience increased significantly in 2013–2018 (Figs. 2, 6), which showed that the groundwater depth significantly affected the ecological resilience. The ecological restoration benefits of these projects are remarkable45. Runoff distribution at the point where the Aksu River, the Kashigr River, the Yarkand River, and the Hotan River flow into the Tarim River, and ecological water conveyance in the lower reaches of the Tarim River exhibited increasing trends in 1990–2018 (Supplementary Figure S3(a, b)), with the exception of 2014. Water consumption for production and urban living decreased slightly but non-significantly (R2 = 0.07) in the main stream of the Tarim River in 1990–2016 (Supplementary Figure S3(c)), and the amount of water used for ecological protection increased in the same period (Supplementary Figure S3(d)), with the exception of 2014. Moreover, as of 2015, no ecological water diversion projects have been implemented in the tributaries of the Tarim River, but such projects have been implemented in the lower reaches of the main stream of the Tarim River46. The effects of existing projects reached their peak in 2013–2015, after which the effects weakened, and vegetation began to rapidly degrade. This may be one reason for the decline in NPP in 2016–2018. Moreover, there is a lag in the effect of ecological water delivery on the growth of surface vegetation, and ecological water delivery in 2014–2015 only started in summer and missed the vegetation growing season, which may be another reason for the decline in NPP in 2016–2018. In general, increased environmental flow has fostered the rehabilitation of degraded riparian forests. Since 2016, the Tarim River Basin Authority has also carried out ecological water transfer projects in the middle and lower reaches of the tributaries of the Tarim River. Cumulative water discharge from these projects was 52.7 million m3 in 2016, 120.8 million m3 in 2017, 152.4 million m3 in 2018, and 80 million m3 in 201947,48. We assume that, if ecological water delivery can be continually implemented in conjunction with the vegetation growing season, the restoration of vegetation will continue.
Conclusions
The focus of desert riparian forest ecosystem resilience studies must move away from the effects of a variety of comprehensive restoration projects to the prominent influence of single projects within the context of comprehensive projects, such as ecological water conveyance. Our proposed framework of integrating NPP, NPP temporal stability, NPP resistance to unfavorable conditions, and NPP potential to maximize NPP to optimal conditions provides insights for comparing the NPP resilience of different forms of ecological water delivery. Mean NPP, NPP resistance, NPP stability, and maximum NPP potential were greatest in 2013–2018, and especially in 2013–2015. The decline in NPP in 2016–2018 may be due to a lag in the effect of ecological water delivery on the growth of surface vegetation, as ecological water delivery in 2014–2015 started in summer and missed the vegetation growing season. Therefore, the continuing implementation of reasonable water transfer is likely to further promote ecological recovery.
References
Huai, J. J. Dynamics of resilience of wheat to drought in Australia from 1991–2010. Sci. Rep. 7, 9532 (2017).
Li, M., Peterson, C. A., Tautges, N. E., Scow, K. M. & Gaudin, A. C. M. Yields and resilience outcomes of organic cover crop, and conventional practices in a Mediterranean climate. Sci. Rep. 9, 12283 (2019).
Keersmaecker, W. D. et al. A model quantifying global vegetation resistance and resilience to short-term climate anomalies and their relationship with vegetation cover. Glob. Ecol. Biogeogr. 24, 539–548 (2015).
Griffith, G. P. et al. Ecological resilience of Arctic marine food webs to climate change. Nat. Clim. Change 9, 868–872 (2019).
You, N. S., Meng, J. J. & Zhu, L. K. Sensitivity and resilience of ecosystems to climate variability in the semi-arid to hyper-arid areas of Northern China: a case study in the Heihe River Basin. Ecol. Res. 33, 161–174 (2018).
Reijers, V. C. et al. Resilience of beach grasses along a biogeomorphic successive gradient: resource availability vs. clonal integration. Oceologia https://doi.org/10.1007/s00442-019-04568-w (2019).
Chambers, J. C. et al. Resilience to stress and disturbance, and resistance to Bromus tectorum L. invasion in clod desert shrublands of western North America. Ecosystems 17, 360–375 (2014).
Driessen, M. M. Fire resilience of a rare, freshwater crustacean in a fire-prone ecosystem and the implications for fire management. Austral Ecol. 44, 1030–1039 (2019).
Ren, H., Lu, H. F., Li, Y. D. & Wen, Y. G. Vegetation restoration and its research advancement in Southern China. J. Trop. Subtrop. Bot. 27(5), 469–480 (2019).
Yan, H. M., Zhan, J. Y. & Zhang, T. Review of ecosystem resilience research progress. Prog. Geogr. 31(3), 303–314 (2012).
Zhan, J. Y., Yan, H. M., Deng, X. Z. & Zhang, T. Assessment of forest ecosystem resilience in Lianhua County of Jiangxi Province. J. Nat. Resour. 27(8), 1304–1315 (2012).
Pérez-Girón, J. C., Álvarez-Álvarez, P., Díaz-Valera, E. R. & Lopes, D. M. M. Influence of climate variations on primary production indicators and on the resilience of forest ecosystems in a future scenario of climate change: application to sweet chestnut agroforestry systems in the Iberian Peninsula. Ecol. Indic. 113, 106199 (2020).
Meng, Y. Y. et al. Analysis of ecological resilience to evaluate the inherent maintenance capacity of a forest ecosystem using a dense Landsat time series. Ecol. Inform. 57, 101064 (2020).
Han, L. et al. Species composition, community structure, and floristic characteristics of desert riparian forest community along the mainstream of Tarim River. Plant Sci. J. 37(3), 324–336 (2019).
Zhou, H. H. et al. Climate change may accelerate the decline of desert riparian forest in the lower Tarim River, Northwestern China: evidence from tree-rings of Populus euphratica. Ecol. Indic. 111, 105997 (2020).
Aini, A. et al. Analysis of stakeholders’ cognition on desert riparian forest ecosystem services in the lower reaches of Tarim River, China. Res. Soil Water Conserv. 23(1), 205–209 (2016).
Li, Y. Q., Chen, Y. N., Zhang, Y. Q. & Xia, Y. Rehabilitating China’s largest inland river. Conserv. Biol. 23(3), 531–536 (2009).
Dai, J. S. Evaluation of eco-environment and socio-economic benefits on comprehensive reclamation projects on the Tarim River Basin. Doctoral Dissertation of Xinjiang Agricultural University (2015).
Han, L., Wang, H. Z., Niu, J. L., Wang, J. Q. & Liu, W. Y. Response of Populus euphratica communities in a desert riparian forest to the groundwater level gradient in the Tarim River Basin. Acta Ecol. Sin. 37, 6836–6846 (2017).
Yang, G. & Guo, Y. P. The change and prospect of vegetation in the end of the lower reaches of Tarim River after ecological water delivery. J. Desert Res. 24(2), 167–172 (2004).
Yan, H. M., Zhan, J. Y. & Zhang, T. Resilience of forest ecosystems and its influencing factors. Procedia Environ. Sci. 10, 2201–2206 (2011).
Abenayake, C. C., Mikami, Y., Matsuda, Y. & Jayasinghe, A. Ecosystem service-based composite indicator for assessing community resilience to floods. Environ. Dev. 27, 34–46 (2018).
Maestas, J. D., Campbell, S. B., Chambers, J. C., Pellant, M. & Miller, R. F. Tapping soil survey information for rapid assessment of sagebrush ecosystem resilience and resistance. Rangelands 38(3), 120–128 (2016).
Ponce-Campos, G. E. et al. Ecosystem resilience despite large-scale altered hydroclimatic conditions. Nature 494, 349–352 (2013).
Frazier, A. E., Renschler, C. S. & Miles, S. B. Evaluating post-disaster ecosystem resilience using MODIS GPP data. Int. J. Appl. Earth Obs. Geoinform. 21, 43–52 (2013).
Kahiluoto, H. et al. Decline in climate resilience of European wheat. PNAS 116(1), 123–128 (2019).
Li, X. Y. et al. Temporal trade-off between gymnosperm resistance and resilience increases forest sensitivity to extreme drought. Nat. Ecol. Evolut. 4, 1075–1083 (2020).
Li, C. H., Zhou, M., Wang, Y. T., Zhu, T. B., Sun, H., Yin, H. H., Cao, H. J., Han, H. Y. Inter-annual variations of vegetation net primary productivity and their spatial-temporal contribution and climate driving in arid Northwest China: a case study of Hexi Corridor. Chin. J. Ecol. (2020).
Song, J. et al. A global database of plant production and carbon exchange from global change manipulative experiments. Sci. Data 7, 1–7 (2020).
Yang, G. et al. Research progress of ecosystem resilience assessment. Zhejiang Agric. Sci. 60(3), 508–513 (2019).
Liu, J. Z. & Chen, Y. N. Analysis on converse succession of plant communities at the lower reaches of Tarim River. Arid Land Geogr. 25(3), 231–236 (2002).
Chen, X., Bao, A. M., Wang, X. P., Guli, J. P. E. & Huang, Y. Recent ecological effectiveness assessment of integrated management projects in the Tarim River. Bull. Chin. Acad. Sci. 32(1), 20–28 (2017).
Zhao, H., Yan, L. & Ji, F. The dynamics of land utilization in the upper reaches of Tarim River. J. Arid Land Resour. Environ. 15(4), 40–43 (2001).
Sun, F., Wang, Y. & Chen, Y. N. Dynamics of desert-oasis ecotone and its influencing factors in the Tarim Basin. Chin. J. Ecol. 39(10), 1–11 (2020).
Xu, G. H. A genetic explanation of the recent changes of ecological environment in the Tarim River Basin, southern Xinjiang. Xinjiang Meteorol. 28–31 (2005).
Kamkin, A. & Lozinsky, I. Mechanically Gated Channels and Their Regulation (Springer, 2012).
Feyisa, K. et al. Effects of enclosure management on carbon sequestration, soil properties and vegetation attributes in East African rangelands. CATENA 159, 9–19 (2017).
Wang, G. H., Ren, Y. J. & Gou, Q. Q. The changes of soil physical and chemical property during the enclosure process in a typical desert oasis ecotone of the Hexi Corridor in northwestern China. J. Desert Res. 40(2), 222–231 (2020).
Xu, H. L., Ye, M. & Li, J. M. Changes in groundwater levels and the response of natural vegetation to the transfer of water to the lower reaches of the Tarim River. J. Environ. Sci. 19(10), 1199–1207 (2007).
Zhang, P. F., Guli, J., Bao, A. M., Meng, F. H. & Guo, H. Ecological effects evaluation for short term planning of the Tarim River. Arid Land Geogr. 40(1), 156–164 (2017).
Gulimire, H., Wang, G. Y., Zhang, Y., Liu, Q. Q. & Su, L. T. Influence mechanisms of intermittent ecological water conveyance on groundwater level and vegetation in arid land. Arid Land Geogr. 41(4), 726–733 (2018).
Guo, H. W., Xu, H. L. & Ling, H. B. Study of ecological water transfer mode and ecological compensation scheme of the Tarim River Basin in dry years. J. Nat. Resour. 32(10), 1705–1717 (2017).
Wu, T. Z., Ding, J., Guan, W. K., Ruan, C. J. & Guan, Y. Populus euphratica forest replacement and photosynthetic characteristics in Tarim Populus euphratica national nature reserve. Prot. For. Sci. Technol. 8, 1–4 (2020).
Zhu, C. G., Aikeremu, A., Li, W. H. & Zhou, H. H. Ecosystem restoration of Populus euphratica forest under the ecological water conveyance in the lower reaches of Tarim River. Arid Land Geography, 44(3), 629–636 (2021).
Chen, Y. N. Study on Eco-hydrological Problems of the Tarim River Basin in Xinjiang (Science Press, 2010).
Halik, U., Aishan, T., Betz, F., Kurban, A. & Rouzi, A. Effectiveness and challenges of ecological engineering for desert riparian forest restoration along China’s largest inland river. Ecol. Eng. 127, 11–22 (2019).
Xinjiang Morning News. In the past three years, the area of the Populus euphratica forest reserve in the Tarim River Basin has increased by 569.95 km2. https://www.sohu.com/a/308626663_100034331?sec=wd (2019).
China News Service. Ecological water transfer for desert vegetation in lower reaches of Konqi River in Xinjiang. https://news.sina.com.cn/o/2020-02-22/doc-iimxyqvz4945915.shtml (2020).
Acknowledgements
This study was financially supported by the Strategic Priority Research Program of the Chinese Academy of Sciences (Grant No. XDA20100303), Xinjiang Uygur Autonomous Region "Tianshan Mountain Cedar Project" Technology Innovation Leadership Programme (No. 2020XS11), the Guangdong Foundation for Program of Science and Technology Research (2020B1111530001), the Special Foundation for National Science and Technology Basic Research Program of China (2019FY100203), the National Natural Science Foundation of China (U1903114).
Author information
Authors and Affiliations
Contributions
A.F. wrote the manuscript and substantially revised the text. Y.L. and C.Z. created some of the figures. W.L. drafted the work. Y.C. was involved in the analysis of data. H.H. was involved in the acquisition of data. Y.W. and F.S. contributed to the analysis and interpretation of data. H.Z. collected some of the climate data. X.H. edited the format of the article.
Corresponding authors
Ethics declarations
Competing interests
The authors declare no competing interests.
Additional information
Publisher's note
Springer Nature remains neutral with regard to jurisdictional claims in published maps and institutional affiliations.
Supplementary Information
Rights and permissions
Open Access This article is licensed under a Creative Commons Attribution 4.0 International License, which permits use, sharing, adaptation, distribution and reproduction in any medium or format, as long as you give appropriate credit to the original author(s) and the source, provide a link to the Creative Commons licence, and indicate if changes were made. The images or other third party material in this article are included in the article's Creative Commons licence, unless indicated otherwise in a credit line to the material. If material is not included in the article's Creative Commons licence and your intended use is not permitted by statutory regulation or exceeds the permitted use, you will need to obtain permission directly from the copyright holder. To view a copy of this licence, visit http://creativecommons.org/licenses/by/4.0/.
About this article

Cite this article
Fu, A., Li, W., Chen, Y. et al. The effects of ecological rehabilitation projects on the resilience of an extremely drought-prone desert riparian forest ecosystem in the Tarim River Basin, Xinjiang, China. Sci Rep 11, 18485 (2021). https://doi.org/10.1038/s41598-021-96742-5
Received:
Accepted:
Published:
DOI: https://doi.org/10.1038/s41598-021-96742-5
- Springer Nature Limited
This article is cited by
-
Does a scaling exist in urban ecological infrastructure? A case for sustainability trade-off in China
Environmental Science and Pollution Research (2023)
-
Short-term effect of meteorological factors and extreme weather events on daily outpatient visits for dry eye disease between 2013 and 2020: a time-series study in Urumqi, China
Environmental Science and Pollution Research (2023)
-
Identification of soil particle size distribution in different sedimentary environments at river basin scale by fractal dimension
Scientific Reports (2022)