
Abstract
In this systematic review, we analyzed and evaluated the findings of studies on prosodic features of vocal productions of people with autism spectrum disorder (ASD) in order to recognize the statistically significant, most confirmed and reliable prosodic differences distinguishing people with ASD from typically developing individuals. Using suitable keywords, three major databases including Web of Science, PubMed and Scopus, were searched. The results for prosodic features such as mean pitch, pitch range and variability, speech rate, intensity and voice duration were extracted from eligible studies. The pooled standard mean difference between ASD and control groups was extracted or calculated. Using I2 statistic and Cochrane Q-test, between-study heterogeneity was evaluated. Furthermore, publication bias was assessed using funnel plot and its significance was evaluated using Egger’s and Begg’s tests. Thirty-nine eligible studies were retrieved (including 910 and 850 participants for ASD and control groups, respectively). This systematic review and meta-analysis showed that ASD group members had a significantly larger mean pitch (SMD = − 0.4, 95% CI [− 0.70, − 0.10]), larger pitch range (SMD = − 0.78, 95% CI [− 1.34, − 0.21]), longer voice duration (SMD = − 0.43, 95% CI [− 0.72, − 0.15]), and larger pitch variability (SMD = − 0.46, 95% CI [− 0.84, − 0.08]), compared with typically developing control group. However, no significant differences in pitch standard deviation, voice intensity and speech rate were found between groups. Chronological age of participants and voice elicitation tasks were two sources of between-study heterogeneity. Furthermore, no publication bias was observed during analyses (p > 0.05). Mean pitch, pitch range, pitch variability and voice duration were recognized as the prosodic features reliably distinguishing people with ASD from TD individuals.
Introduction
Autism spectrum disorder (ADS) is a common neurodevelopmental disorder1. According to World Health Organization Fact Sheet on June 2021, about one out of 160 children in the world suffers from ASD. This neurodevelopmental disorder is characterized by difficulty in social interaction, atypical patterns of behavior, and communication challenges2. In terms of communication difficulties, one of the earliest symptoms of ASD is language impairment3,4 that is manifested in different forms, from being completely nonverbal to having unusual prosody5,6,7.
Prosody is concerned with suprasegmental features of speech and refers to the speech rhythm8 and also affective, pragmatic and syntactic communicative functions9. Therefore, prosody may determine the way that language is perceived by audiences10. Considering the fact that cross-linguistic evidence shows the early development of prosodic sensitivity to ambient language in newborns11,12, it is important to investigate if prosodic characteristics of the human voice are potent to obtain useful information for neurodevelopmental disorders like ASD.
Acoustic characteristics expressing prosody are pitch (also known as fundamental frequency), duration and intensity13 and pitch attributes such as pitch contour, pitch range and pitch variability. The pitch measure is related to the vibrational frequency of vocal cords and pitch contour shows the pitch variability during time evolution and is related to the information content of the utterance13. The pitch range is defined as the distance between maximum and minimum pitch values and determines the extent of variation that a speaker uses in a produced utterance. People with ASD show different pitch characteristics as compared with typically developing (TD) individuals14. However, inconsistencies are observed between studies. For example, some people with ASD exhibit a wider pitch range, while some other ASD people exhibit a shorter pitch range during speaking compared with TD individuals14. Furthermore, some studies showed that people with ASD had higher mean pitch and wider pitch range15, while according to other studies, the variation might not be significant16 or even different17. One possible factor that made the results inconsistent might be the experimental condition that voice is produced18. It was shown that emotional state affected acoustic properties of the speech19, Furthermore, the mental status during voice production, for example, stress condition, might affect the quality and characteristics of the produced voice20.
Duration, the time spent for producing utterances, also seems to be different between ASD and TD groups in a way that people with ASD have longer utterance duration compared with TD individuals10,13. This is not in accordance with the other results reported for the duration of the paired syllable18 or contrastive argument17. Furthermore, the duration for producing stressed and unstressed syllables is more different for TD individuals as compared with people with ASD16. Although the utterance duration has been reported to be influenced by the emotional state of TD individuals and is significantly longer in the sad emotional state compared with happy or neutral states, such a difference has not been reported for ASD people21.
The intensity of produced voice, sometimes is referred to as voice loudness or voice pressure level (dB), is another measure that has been widely investigated to capture differences between ASD and TD individuals10,13,22. Diehl et al. reported that following elicitation of question-like speech, there was no difference between speech intensity of TD and ASD groups13. Drimalla et al. found no difference between ASD and TD groups regarding the intensity of produced voice22 and Filipe et al. reported that the intensity of voice was not different between ASD and TD groups for both falling and rising intonations10. However, according to Olivati et al., the maximum and minimum intensity of vocal productions were significantly different between ASD and TD individuals, in which for both cases, ASD individuals showed higher values for minimum and maximum intensities23.
In studies regarding the comparison between prosodic features among ASD and TD individuals, it is important to consider factors such as gender, age, IQ or expressive spoken language of participants. It is well known that speech rate, pitch and voice intensity are correlated factors with speaker age24. Also, it was reported that the voice fundamental frequency of children reduced by increasing the age25. For school-age typically developing children, the pitch variation was shown to be greater than pre-school samples26. Gender is another important factor that affects prosodic features27. In general, prosodic attributes of female speakers show higher pitch value, longer duration and a wider pitch range28. According to Nadig and Shaw, IQ might also be correlated with acoustic pitch range in high functioning ASD individuals during a structured communication task, while no relationship was found for conversational communication29. Furthermore, a correlation between IQ measure and linguistic prosody task accuracy was reported for specific language impairment children30. Other factors such as the expressive language of participants or musical background are also effective on the prosodic features of an acoustic utterance. For example, lexical stress assignment is performed in a different manner between different languages31. In this regard, several studies used prosodic features for identifying the spoken language of participants32. Also, the correlation between prosodic features and factors such as age, gender and IQ is very complex and interaction should be considered between them. As an example for such interaction, it was shown that fundamental frequency changed differently between male and female samples after adulthood (i.e. decrease of voice fundamental frequency in women and increase of fundamental frequency in men); however, such change depends on the age span33.
Overall, extensive inconsistencies exist in the literature for the main differences of prosodic features between ASD and TD groups. Performing a systematic review and inclusion of previously conducted studies may help to solve such inconsistencies. By aggregating individual studies, systematic reviews minimize the bias of the obtained results, obtain more reproducible results and increase the power of statistical analyses due to larger sample sizes compared with individual studies. It also generates useful conceptual frameworks and guidelines for future studies by obtaining the effect of eligible confounding factors34.
To the best of our knowledge, Fusaroli et al. (2017) have performed the last systematic review about the acoustic features of people with ASD and the differences with TD individuals. According to Fusaroli et al., cumulative results showed that mean pitch and pitch range was the most significant different features between ASD and TD groups (Cohen’s d = 0.4–0.5)35. In their study, between-study heterogeneity for the included studies was negligible except for the mean pitch and pitch range. However, due to the lack of sufficient evidence, the reliable pooled effect for ASD for voice intensity and quality of voice was not reported35. After the study of Fusaroli et al. several new studies have been performed to investigate the acoustic characteristics of speech articulated by ASD sufferers.
The current study is an update for the last performed systematic review conducted by Fusaroli et al., increasing the study sample size from 30 to 39 and ASD participant sample size from 407 to 910 samples. However, it should be noted that, in Fusaroli et al., some other voice characteristics such as voice quality were also studied. They also considered multivariate studies of acoustic patterns which are out of the scope of the current study. The increased study and participant sample size enabled us to obtain more precise estimates. The main purpose of the current systematic review was to investigate which prosodic features could be considered as reliable markers for discriminating people with ASD from TD individuals. Performing cumulative research by considering newly obtained evidences will increase the sample size and hence improve the statistical power of outcomes. Furthermore, analyses regarding the impact of confounding factors such as the age of participants, gender and the type of voice elicitation tasks on the prosodic characteristics were performed. The result of this study can be used by researchers to develop machine-learning approaches for discriminating ASD and TD individuals or for screening people with ASD. Furthermore, the result can be useful for developing rehabilitation intervention strategies for improving the speaking abilities of people with ASD.
Results
The flow diagram for performing the current systematic review according to Preferred Reporting Items for Systematic Reviews and Meta-Analyses (PRISMA) guidelines is shown in Fig. 1.
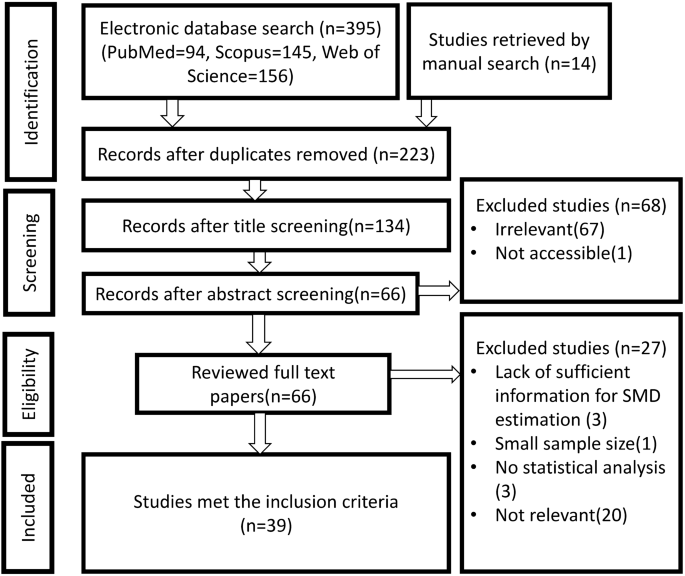
Flow diagram of the search procedure according to the PRISMA guidelines.
Initial searches in major databases (PubMed, Scopus and Web of Science) provided 395 studies. Furthermore, by the manual search of the reference list of review articles, related meta-analyses and eligible studies, 14 studies were obtained. After title and abstract screening, 66 studies remained, while only 39 of them contained results that enable us to calculate reliable effect size (i.e. standard mean difference). Although the total sample size of ASD and TD groups were 910 and 850, respectively, separate analysis for each prosodic feature (pitch, intensity, duration and speech rate) was performed with a smaller sample size.
Table 1 shows the retrieved eligible studies that were included in the current systematic review. According to the Newcastle-Ottawa scale (NOS), the quality of all studies was high (NOS ≥ 7) except for Refs.36,37,38,39 (NOS = 5, 4, 3, 6, respectively). Since the prevalence of ASD is higher in males and ASD is a male-biased disorder40, in the case of studies that reported results according to gender, the results for males were only considered. It should be noted that for such studies the sample size for females was relatively small; therefore, the inclusion of effect sizes for the female group increased the risk of small-study effect in the analyses41.
The results of this systematic review are as follows.
Mean pitch value
Twenty-two studies investigated the difference in mean pitch value between ASD and TD individuals. The results of these studies were completely inconsistent. Two studies14,62 reported lower mean pitch value for vocal productions of people with ASD, while ten other studies10,17,22,38,39,47,61,62,64,65 found higher mean pitch value for ASD individuals. Sheinkopf et al., investigating the acoustic characteristics of infants’ crying sound reported two mean pitch values for pain-related and non-pain-related cries. Furthermore, 11 studies13,15,18,29,38,45,49,58,59,60,63 found no significant difference (p > 0.05) between groups. By analyzing adult male participants (age > 13), Nayak et al. found a higher mean pitch value for ASD than TD group, while for younger male participants (age < 13), the mean pitch value was not different between groups38.
As Fig. 2 represents, the pooled mean difference for included studies (13 studies, 310 people with ASD and 268 TD individuals) was SMD = − 0.4 (95% CI [− 0.70, − 0.10]), while a moderate to high between-study heterogeneity was observed (I2 = 67.4%, p < 0.05). To investigate the source of heterogeneity, two confounding factors (voice elicitation task and the age span of participants) were considered. For this purpose, studies were grouped according to the experimental task that was used for voice elicitation (i.e. Narration, Conversation, Focus and Cry) and the age span of ASD participants (i.e. infancy, childhood, adolescence and adulthood). The results for these subgroup analyses were reported in Table 2.

Forest plot for mean pitch value measure. The negative sign shows that the mean pitch value is larger for ASD individuals as compared with TD individuals.
Student t-test showed that the mean pitch value for TD and ASD groups was statistically different (p = 0.037; t-value = 1.876). For subgroups (according to the type of voice elicitation task and age span), statistical analysis using a two-way analysis of variance (ANOVA) was performed. The ANOVA model of \({y}_{ijt}=\mu +{\alpha }_{i}+{\beta }_{j}+{\gamma }_{ij}+{\varepsilon }_{ijt}\) was used in which alpha showed the effect of different treatments related to the first independent variable (task type, i: Cry, Focus, Narration, Conversation), beta was related to the second independent variable (age, j: Infancy, Childhood, Adolescence, Adulthood) and the gamma coefficient was related to the combination of treatments of two independent variables (i.e. interaction between age and task). The epsilon showed the error term. Multiple comparisons correction using the Bonferroni method was applied to the ANOVA outcome. The results showed no main effect of task type (F(3,8) = 0.36, p = 0.79), age (F(2,8) = 2.07, p = 0.188), and interaction between task type and age span (F(2,8) = 0.29, p = 0.76).
In order to check the impact of elicitation task and age span simultaneously, a more detailed subgroup analysis was performed and the results were reported in supporting materials (see supporting material file, Supplementary Appendix Sect. B).
Pitch standard deviation
In the current systematic review, in terms of pitch standard deviation, 16 studies reported the difference between ASD and TD groups. The total sample size of the retrieved studies, considered pitch standard deviation, was 305 and 329 samples for ASD and TD groups, respectively. Eight studies10,13,15,17,47,52,66,67 reported larger pitch standard deviation for people with ASD, while three studies26,38,46 obtained smaller pitch standard deviation for ASD individuals. Other studies reported no significant differences between ASD and TD individuals26,29,59,60,62,63. In the study of Nakai et al. lower pitch standard deviation was observed for school-aged ASD individuals, while the pre-school aged group did not show such a difference26. Among the included studies, nine studies reported the necessary information for calculating SMD (including 13 effect sizes since some of the studies reported more than one effect size). The pooled mean difference for acoustic pitch standard deviation between ASD and TD groups was SMD = − 0.07 (95% CI [− 0.55, 0.42], I2 = 83.5%, p < 0.01), which was a very small and non-significant difference. Subgroup analyses considering different types of voice elicitation tasks were shown in Table 3. Since just one study was available for adolescence and adulthood, these age spans were excluded for further analysis.
The results of this meta-analysis indicated that pitch standard deviation was not significantly different between ASD and TD groups, even when confounding factors were adjusted.
Two-way analysis of variance showed that there was no main effect for task (F(3,6) = 0.4, p = 0.76), age (F(3,6) = 0.92, p = 0.48) or interaction between age and task type factors (F(4,12) = 0.87, p = 0.26).
Pitch range
Pitch range, the distance between the maximum and minimum pitch values68, is one of the measures that along with pitch standard deviation has been used extensively for voice pitch variability assessment10,21,45,53,61. In the current study, pitch range was considered as a measure for the broadness of fundamental frequency used by ASD or TD individuals during voice production.
The systematic search found 21 studies for the pitch range difference between ASD and TD groups. Thirteen studies reported the wider pitch range in ASD individuals’ vocal productions10,13,15,21,29,38,45,52,53,61,62,69,70, while only one study55 reported a narrower pitch range in ASD group. In seven studies, no significant difference between ASD and TD groups was found for pitch range (Refs.14,18,23,26,39,59 for one-word and16 for pseudowords). Among 21 eligible studies, 14 cases (17 mean difference values) had the necessary information for performing a meta-analysis. The total sample size of these 14 studies was 239 for ASD and 232 for TD individuals. The pooled mean difference for this analysis was SMD = − 0.78 (95% CI [− 1.34, − 0.21], I2 = 89.9%, p < 0.001). As the result showed, there was between-study heterogeneity. To investigate the source of heterogeneity, subgroup analyses were performed considering the age of participants and the voice elicitation method. Table 4 reports the results of the above-mentioned subgroup analyses.
Student t-test showed that the pitch range value for TD and ASD groups was statistically different (p = 0.002; t-value = 3.21). According to the two-way ANOVA test, there was no main effect for age (F(2,9) = 0.2, p = 0.82), task type (F(2,9) = 0.13, p = 0.88) on standard mean difference of pitch range between ASD and TD groups. Furthermore, the two-way ANOVA test showed that there was no age and task type interaction (F(3,9) = 0.33, p = 0.806).
Pitch variability
Pitch variability is usually computed according to the standard deviation of fundamental frequencies or the range of fundamental frequencies i.e. the distance between the maximum and minimum pitch values18. The pitch standard deviation might better explain pitch variability than pitch range since the latter is a more sensitive measure to outliers. In order to be consistent with the definition of pitch variability in the literature (i.e. considering both pitch standard deviation and pitch range measures), the results of studies of “Pitch standard deviation” and “Pitch range” sections were combined. The systematic search retrieved 22 studies that investigated pitch variability (544 and 561samples for ASD and TD groups, respectively). These studies reported 30 effect sizes. The pooled mean difference for pitch variability measure was SMD = − 0.462 (95% CI [− 0.84, − 0.08], I2 = 88.7%, p < 0.001). This result showed larger pitch variability for ASD group, while between-study heterogeneity was observed. To investigate the source of heterogeneity, subgroup analyses were performed considering the age of participants and the voice elicitation method. Table 5 reports the results of the above-mentioned subgroup analyses.
Student t-test showed that the pitch variability for TD and ASD groups was statistically different (p = 0.008; t-value = 2.53). The two-way ANOVA test showed no main effect for age (F(3,19) = 0.22, p = 0.88), while the main effect for task type (F(3,19) = 8.03, p = 0.04) on the standard mean difference for pitch variability between groups was obtained. The post-hoc analysis showed that for narration-type tasks the pitch variability was larger for ASD samples. Furthermore, analysis of variance showed that there was no interaction between age and task type (F(4,19) = 0.6, p = 0.65).
Intensity
The difference in the intensity of vocal productions between ASD and TD individuals was found in 12 studies. Two studies21,23 reported higher intensity for ASD individuals, while two others58,60 found the lower intensity for ASD individuals. In addition, there was not any report of significant differences between ASD and TD groups in terms of voice intensity level in eight studies10,17,22,29,36,59,62,63. Among the eligible studies, ten of them had necessary information for calculating the pooled mean difference between ASD and TD groups for acoustic intensity10,17,21,23,29,58,59,60,62,63. Some of them reported more than one mean difference (for minimum or maximum intensity, during different time spans or due to different elicitation methods); therefore, 14 mean difference values were found for performing the meta-analysis. The total sample size for this analysis was 222 people with ASD and 182 TD individuals. The pooled SMD for acoustic intensity deference between ASD and TD groups was SMD = − 0.14 (95% CI [− 0.58, 0.29], I2 = 82.1%, p < 0.001), which indicated the small and non-significant difference between groups (since mean difference contained zero). In Table 6, the results for subgroup analyses, considering the age span of ASD participants and vocal production elicitation methods, were shown.
It should be noted that Ochi et al. (2019) also reported lower variation in the acoustic intensity of people with ASD58, while other studies like60,62 reported no significant difference between these groups. In the study of Choi and Lee, it was reported that intensity variation for people with ASD was significantly larger (p < 0.05) compared with TD individuals (SMD = − 0.998, 95% CI [− 1.61, − 0.38])48.
Student t-test showed that the voice intensity for TD and ASD groups was not statistically different (p = 0.305; t-value = 0.524). Two-way ANOVA test for standard mean differences for voice intensity between ASD and TD groups showed a main effect of age (F(3,7) = 10.48, p = 0.006), while there were no significant effects for task type (F(3,7) = 0.17, p = 0.911) or the interaction between age and task type (F(4,7) = 0.2, p = 0.356). The post-hoc Bonferroni-corrected contrast analysis showed that the mean value for voice intensity was higher for adolescent ASD subjects in the conversation-type task.
Speech rate
Patel et al. found a significantly smaller speech rate for people with ASD as compared with TD individuals18, while two other studies29,58 refused the significant difference between the speech rate of ASD and TD individuals. Sufficient information was available for calculating SMD from three studies including18,29,58. The pooled mean difference for the eligible studies (ASD and TD group sample size was 132 and 69, respectively) showed weak and non-significant difference between speech rates of ASD and TD groups (SMD = 0.09 (95% CI [− 0.44, 0.62], I2 = 49.4%, p = 0.115)).
Voice duration
For the difference of mean voice duration between ASD and TD groups, 22 eligible studies were retrieved. The total sample size of the included studies was 257 and 234 for ASD and TD groups, respectively. Ten studies16,17,29,42,43,46,49,54,58,62 did not find any statistical difference in voice duration between ASD and TD groups. However, 11 other studies reported longer utterance/word duration for people with ASD10,13,21,29,36,50,52,58,64,71,72. Demouy et al. reported four SMD values for different types of intonations (i.e. descending, falling, floating, rising). Another study, which investigated the crying sounds of infants, reported shorter voice duration for ASD children63. Among the eligible studies, the standard mean difference could be calculated for 15 studies with 27 mean difference values, since in some studies several mean difference values were reported. Although between-study heterogeneity was observed (I2 = 72.1%), the performed meta-analysis for the difference of voice duration between ASD and TD groups obtained the pooled difference of SMD = -0.43 (95% CI [− 0.72, − 0.15], I2 = 72.1%, p < 0.01)), which indicated the significant longer duration for vocal productions in people with ASD.
Student t-test showed that the voice duration value for TD and ASD groups was statistically different (p = 0.017; t-value = 2.23). However, the two-way ANOVA test revealed that there was a main effect for age (F(3,20) = 8.68, p = 0.027), while no significant effect was found for task type (F(3,20) = 1.18, p = 0.344) or interaction between age and task type (F(4,20) = 1.37, p = 0.28) on standard mean difference of voice duration between ASD and TD groups. Post-hoc analysis revealed that such difference was mainly due to the statistical difference between childhood (t-value = 1.78, p = 0.048) and adolescence (t-value = 2.09, p = 0.04) subgroups.
From Fig. 3, it was clear that one possible source of between-study heterogeneity for voice duration might be the type of voice elicitation task. When participants were motivated to produce words and sentences in a word repetition or picture naming task (Force category in Fig. 3), between-study heterogeneity was moderate (I2 = 65.8%, p < 0.01), while the mean difference of duration was longer for ASD group (SMD = − 0.38, 95% CI [− 0.69, − 0.08]). For cases in which voice duration was calculated for the crying period, studies were heterogeneous (I2 = 75.3%, p = 0.007). In the case of narration, one study23 showed non-significant heterogeneity, while due to the common sample population, it could not be considered as a reliable result. Another source of between-study heterogeneity was the age span of participants (see Fig. 4). According to Fig. 4, in the case of vocal production in infants, a non-significant and negligible heterogeneity (I2 = 0.00%, p = 0.579) was obtained, and there was a shorter voice duration for crying sounds for people with ASD (SMD = 0.38, 95% CI [− 0.02, 0.79]). For the adolescence and childhood periods, significant between-study heterogeneity was also observed (I2 = 71.3% and 71.6%, respectively, p < 0.01).

Forest plot for the subgroup meta-analysis of the difference of voice duration between ASD and TD groups. The confounding factor for this analysis was the type of voice elicitation task.

Forest plot for the subgroup meta-analysis of the difference of voice duration between ASD and TD groups. The confounding factor for this analysis was the age span of participants.
Other measures
In some limited numbers of studies, other features such as pitch slope and voice quality were considered. Bone et al. reported that the median pitch slope correlated with ASD severity and a more negatively sloped pitch was observed in children with severe ASD73. Pitch slope determines intonation73 or the perceived oddness of prosody74, where a more negative pitch slope is related to a flatter intonation73. The performance of participants during speech production was another measure for comparing ASD and TD individuals75. Furthermore, voice quality is used as a measure for comparing ASD and TD individuals; however, there are no universal measures for quantifying the voice quality35.
Publication bias
The results for publication bias according to Egger’s and Begg’s tests were reported in Table 7. The threshold level of 0.05 was used to indicate significant publication bias. The related funnel plot for representing publication bias can be found in Supplementary Appendix D in the Supporting Material.
Discussion
Study outcomes
Autism spectrum disorder (ASD) is a frequent neurodevelopmental disorder1. Recognizing common early symptoms and warning signs of ASD leads to early diagnosis and better treatment assessments. Since ASD is associated with language deficit, in this systematic study, we reviewed the literatures focused on prosodic features of pitch, duration, speech rate and intensity.
As the results of this study (Fig. 2) revealed, the pooled mean difference for mean pitch measure between ASD and TD groups was negative (SMD = − 0.4). The negative sign indicated a larger mean pitch for people with ASD. The confidence interval (95% CI [− 0.7, − 0.1]) did not include zero, therefore, the mean difference should be considered as a significant difference. Subgroup analysis (Table 2) revealed a higher mean pitch for people with ASD especially in adulthood (− 0.94 (95% CI [− 1.36, − 0.52])). This implied that the pitch difference between ASD and TD individuals was specifically significant during adulthood compared to other age spans in which studies showed inconsistent results.
Between-study heterogeneity for mean pitch difference was moderate (I2 = 67.4%, p < 0.001). Subgroup analysis revealed that both age and voice elicitation tasks were the sources of heterogeneity (see Table 2). For conversation-type tasks, when social interaction existed during vocal production, between-study heterogeneity was relatively high and significant (I2 = 80.7%, p < 0.05). Social interaction problems are the hallmarks of ASD76, therefore, a significant difference in the prosodic features of ASD individuals’ vocal production during social interactions in comparison with TD people is not surprising. This might be the reason that conversation-type tasks were an important source of the observed between-study heterogeneity. Furthermore, subgroup analysis according to the age span of participants showed that after childhood period (i.e. in adolescence and adulthood period) the results of studies regarding acoustic mean pitch difference between ASD and TD individuals were more homogenous. Previous studies revealed that mean pitch value decreased during development and it reaches the mature adult voice pitch value in 13–18 years of age77,78. Furthermore, Lee et al. reported that the acoustic features converged to a canonical level at the age of 1579. The convergence of prosodic features after childhood might be the reason for more homogenous differences for acoustic features in the adulthood age span between ASD and TD groups.
When pitch standard deviation was used, the current meta-analysis did not find a significant difference between ASD and TD groups (SMD = − 0.07 (95% CI [− 0.55, 0.42]). While for another measure of pitch variability, i.e. pitch range, the current systematic review showed a significantly wider pitch range for the ASD group (SMD = − 0.78(95% CI [− 1.34, − 0.21]). This can be attributed to the discomfort of ASD patients during speaking37. Lyakso et al. reported that a negative/positive trend in pitch variability (falling/rising pitch contour) usually shows the discomfort/comfort state in the speaking, while the flat pitch contour is related to the natural speaking37. According to Table 4, pitch range difference reduced during development. Since speech and language abilities enhance during development80, people with ASD might feel more comfortable speaking at older ages during social communication and this resulted in the smaller pitch range difference between ASD and TD groups that was observed in our study. It was also in accordance with the findings of Nakai et al. that reported a negative correlation between pitch variation and social reciprocal interaction in Japanese-speaking pre-school children26.
The current meta-analysis found a weak mean difference for voice intensity between ASD and TD groups (SMD = − 0.14 (95% CI [− 0.58, 0.29]); however, the difference was not significant. Subglottic pressure, the rate of airflow, the glottal resistance81 and the vocal fold vibration properties82 are factors affecting intensity. Kostyuk et al. reported the weakness of respiratory muscles of ASD sufferers and Stewart et al. reported the abnormal lower long airway doublet branching in ASD children83 that might influence the air pressure for vibrating vocal cords. Therefore, the difference in voice intensity and pitch properties of vocal productions’ of ASD people can be attributed to the structural abnormalities in vocal tract of the ASD individuals. In addition, the mean pitch is the fundamental frequency (F0) of a voice. The mean value for F0 and its range is mainly determined by the vocal cord characteristic features such as thickness and length84. X-ray images from larynx of ASD and their TD counterparts revealed that the hyoid height of people with ASD was lower compared with controls85. Different larynx anatomy might be the reason for larger mean pitch and the larger pitch range in ASD individuals.
The pooled voice duration difference between ASD and TD groups showed significantly longer duration for ASD individuals (SMD = − 0.43 (95% CI [− 0.72, − 0.15]). This result indicated that people with ASD needed more time for producing utterances as compared with TD individuals.
Assessment of publication bias using funnel plot as well as Egger’s and Begg’s rank tests revealed that there was no symptom of publication bias for performed analyses (see Table 7, Fig S3, supporting material). According to Table 7, both Egger’s and Begg’s tests obtained p values larger than 0.05, however, for pitch variability and duration Egger’s test had marginal p values (p < 0.1). This indicated that the result for publication bias obtained by Egger’s test should be considered with caution, especially for pitch variability and voice duration measures.
A deeper investigation in the results obtained by subgroup analyses revealed that the differences of prosodic features between ASD and TD groups were mainly seen for narration-type tasks. For narration-type tasks, significant longer mean pitch value, larger pitch range, higher pitch variability and longer voice duration were observed for people with ASD. While for focus-type tasks, the significant difference between groups was observed for limited numbers of acoustic features (mean pitch and voice duration). For conversation-type tasks, no statistically significant differences were observed (i.e. confidence interval included zero). This useful outcome should be considered for designing future studies.
Considering the age span of participants, pitch range, pitch variability and voice duration were significantly different between ASD and TD groups for the adolescence group. The mean pitch value was also significantly higher for adult ASD participants compared with TD peers. These results showed that the main differences were observed for adolescent and adult age spans. It should be noted that the structural features of the larynx and vocal cords are the most influential factor on the pitch, intensity and variation of a produced voice by human. The majority of structural changes in the larynx and vocal cords begin around puberty, i.e. during adolescence and finally, voice stabilizes in the early years of adulthood. Voice stabilization reduces the intrinsic voice variability86 for acoustic features and highlights the inter-subject differences. This might be the reason that why the main differences between acoustic features of ASD and TD groups were mainly seen at older ages (adolescence and adulthood).
Comparison with the last performed systematic review
The previous systematic review performed by Fusaroli et al. found that the mean pitch and pitch range were two acoustic features that were distinct between ASD and TD groups35. According to Fusaroli et al., the standard mean difference for mean pitch was SMD = − 0.41 (95% CI [− 0.68, − 0.15], 16 studies) which is very close to our estimate (SMD = − 0.4 (95% CI [− 0.7, − 0.1], 22 studies). This confirms that mean pitch value can be considered as a reliable feature to distinguish ASD from TD individuals. For pitch range measure, the previous meta-analysis obtained the pooled mean difference of SMD = − 0.5 (95% CI [− 0.77, − 0.24], 17 studies), while the current analysis obtained the pooled mean difference of SMD = − 0.78 (95% CI [− 1.34, − 0.21], 21 studies) that showed the stronger capability of pitch range for distinguishing ASD and TD individuals. In fact, our result obtained a wider pitch range difference between ASD and TD individuals compared with Fusaroli et al.35. Inclusion of recently reported studies also showed that voice duration might be another measure that was significantly longer for ASD group (SMD = − 0.43 (95% CI [− 0.72, − 0.15])). In accordance with the systematic review performed by Fusaroli et al., the current systematic review did not find any evidence for voice intensity, pitch standard deviation and speech rate to be as differentiating features between ASD and TD individuals.
Study limitations
Even though systematic reviews and meta-analyses provide the framework for combining results of several studies, the obtained results should be taken with caution due to several issues including heterogeneity between studies and publication bias87. Furthermore, for the topic of the current study, the spoken language of participants and the task that was used for voice elicitation were different extensively between studies. Such factors were effective on prosodic features32 and made studies heterogeneous. Anyway, the outcomes from a systematic review/meta-analysis study can be considered as a starting point in future studies for investigating the effect of potential confounding factors. In this perspective, Fusaroli et al. performed a cumulative yet self-correcting approach according to the outcomes of their previous meta-analysis35 in order to propose guidelines for overcoming the naïve shortcoming of a systematic review/meta-analysis study87.
In addition, the current study was performed according to the classical method for meta-analysis. However, another choice is Bayesian meta-analysis, which considers that both data and model parameters are random variables. It includes the a priori knowledge in the model and in this way enriches the meta-analysis88,89. Finally, during the systematic search, we found several studies that could not be included in the meta-analysis due to missing reported data. The missing data imputation strategies can be effective methods for including such studies in the meta-analysis90.
Conclusion
Several studies have reported altered vocal production in people with ASD. In this regard, it is important to investigate if prosodic characteristics of vocal productions of people with ASD are different enough to be used as the distinguishing factors between ASD and TD individuals. Because children start vocal productions from the first stages of development, reaching this conclusion is promising for ASD sufferers. The result may lead to the early diagnosis of ASD and better outcomes of their assessment. The current systematic review of the studies on prosodic features of vocal productions articulated by ASD sufferers was conducted to find the statistically frequently reported varieties between ASD and TD individuals. This study showed that some features like mean pitch, pitch range, pitch variability and voice duration were discriminative features. However, these findings were dependent on the age span of participants and the type of task used for voice elicitation. For voice elicitation tasks in which interaction with others was required or subjects engaged in a problem-solving task before voice elicitation, discriminative markers obtained lower statistical significance, while prosodic features during general narration showed a statistically significant difference between people with ASD and the normal group. Furthermore, mean differences in discriminative features between ASD and TD groups were usually observed for adolescents and adults. The findings showed that some other prosodic features such as voice intensity, pitch variability or speech rate were not potent to distinguish ASD individuals from TD people. The obtained results can be considered for developing intelligent methods for distinguishing people with ASD from TD individuals. For future works, we propose using enhanced statistical methods such as Bayesian meta-analysis frameworks.
Materials and methods
For performing the current systematic review, the Preferred Reporting Items for Systematic Reviews and Meta-Analyses guidelines (PRISMA) were used.
Search procedure
For finding eligible sources in line with the purpose of the current study, three major databases namely PubMed, Web of Science and Scopus were searched using the advanced search engine in each database. For the systematic search, the following search terms were used:(autism OR “Autism spectrum disorder” OR ASD OR “Asperger syndrome”) AND (“phonological disorder” OR “phonological difficulties” OR “phonological impairment” OR “speech disorder” OR “speech impairment” OR “speech difficulties” OR “voice disorder” OR “voice difficulties” OR “voice impairment” OR “phonology disorder” OR “phonology impairment” OR “phonology difficulties” OR phonology OR phonological OR phonetic) AND (“fundamental frequency” OR formants OR “acoustic energy” OR pitch). For searching eligible studies, no restriction on language or date of publication was applied.
Inclusion and exclusion criteria
As inclusion criteria: (1) Original research articles, conference papers, clinical trial or randomized control trial articles were included. (2) Studies were included if the difference in acoustic properties between autism spectrum disorder and typically developing conditions had been investigated. (3) Only studies were included that had investigated the acoustic features from an articulatory point of view. (4) Studies contained participants with hearing loss or other neurological disorders rather than ASD were excluded.
As exclusion criteria: (1) Review articles or related systematic review studies were excluded, even though their reference lists were searched for finding missing related studies. In addition, case reports and letter to the editor studies were not included. (2) Studies in which ASD group had been compared with people with language impairment and studies on ASD individuals without comparing them with TD control group, were excluded. (3) Studies with a very small sample size (n ≤ 3) were excluded from further analysis. (4) Studies that investigated speech perception or focused on brain mechanisms (for example elicited event-related potentials during speech production) were excluded. 5) Studies that had used specific tests to score verbal abilities or prosodic capabilities of participants91 were also excluded.
Study selection
The search procedure was performed by two independent authors (S.F and E.J) and retrieved references were transferred to a single EndNote library. After duplicate removal and title, abstract and full-text screening, eligible studies were found. Any disagreement in study selection between authors was resolved by discussion. A PICO model (Population: people with autism spectrum disorder and language- or age-matched typically developing group; Intervention: tasks for eliciting voice production in participants, including simple narrative tasks, two-sided interviews, picture-naming tasks and so on; Comparison: intensity, duration and pitch of produced utterance; and Outcome: the standard mean difference between ASD and TD groups) was used to select eligible studies. Some studies were ruled out from further analyses due to their lack of enough information to calculate the standardized mean difference between groups.
Data extraction
Using a data extraction form, information such as author name, publication year, type of study design, study sample size (number of ASD or TD individuals included in the study), number of male participants in each group, mean age of participants, procedures adopted in the study, the acoustic features used in the study, the main outcomes of the study and calculated or reported mean differences were extracted. For studies reporting several mean differences, all reported differences were considered for further analysis.
In the current study, we focused on acoustic features like intensity (loudness or pressure level), mean and variability of pitch (or fundamental frequency), duration for utterance production and speech rate. Other measures such as turn-taking44, correct word repetition rate, voice quality73 or pause duration were not considered.
Between-study heterogeneity, quality assessment and statistical analysis
Between-study heterogeneity was assessed using Cochran's Q-test and I2 statistic92. I2 value higher than 75% was considered as high heterogeneity, lower than 25% as small heterogeneity and between these two edges (i.e. 25% and 75%) was considered as moderate heterogeneity. To assess publication bias, funnel plot as a visualization tool was used and the Begg’s and Egger’s tests were used to quantify the possible bias93. Newcastle-Ottawa Scale (NOS)94, developed for nonrandomized studies used to evaluate the quality of studies. The difference between ASD and TD groups was calculated based on the standard mean difference (SMD) using Cohen’s d formula. During SMD calculation, the first group was TD and the second group was ASD. In this regard, the negative SMD value implied a larger value for ASD group. The adopted statistical significance level was 0.05. It should be noted that Cohen’s d is biased upward for small samples. To correct such bias, the corrected d (d*) measure was used using the following formula95 during calculation.
In which, Mi was the mean value for i-th group, N was the sample size or number of studies. SDpooled was the pooled standard deviation and was calculated according to Eq. (2).
In Eq. (2), ni was the sample size and SDi was the standard deviation for i-the group.
Statistical comparison between acoustic features among ASD and TD groups was performed according to Kolmogorov–Smirnov normality test followed by independent t-test for normal distributed cases or the Mann–Whitney non-parametric U test for non-normal distribution cases. The significance level of 0.05 was considered for statistical analyses. Analysis of Variance (ANOVA) for testing the differences between groups in terms of two confounding factors (i.e. age span of participants and type of voice elicitation task) was performed (Two-way ANOVA) and post-hoc analysis according to the Bonferroni multiple comparisons correction test was used for finding the possible significant differences. For performing meta-analsis, STATA version 14 (StataCorp, College Station, TX, USA) was used, while for t-test and ANOVA analyses Matlab 2017b(MathWorks, MA, USA) was used.
Voice production tasks
It is hypothesized that different brain mechanisms are engaged for producing different types of human voices (i.e. unconstrained vs. constrained voice). It was shown that in some neurological and neurodevelopmental diseases the type of voice elicitation task was effective on produced prosodic features89. The selected studies were categorized based on different tasks used to elicit vocal production from participants and three categories of constrained voice production, unconstrained voice production and voice produced during crying were considered. In the first category, referred to ‘Focus’, participants were forced to have vocal production in response to a question, request of word imitation, word repetition or picture-naming tasks. Unconstrained category consisted of two subcategories of (1) without interaction with others where vocal production was done during story-telling or general narration tasks and (2) during communication with others. After this, the former was referred to as “Narration” and the latter was referred to as “Conversation”. Considering these two subcategories is important due to the ASD individuals’ impaired social communication behavior96.
Abbreviations
- ASD:
-
Autism spectrum disorder
- TD:
-
Typically developing
- SMD:
-
Standard mean difference
- F0:
-
Fundamental frequency
- NOS:
-
Newcastle-Ottawa scale
- PVI:
-
Pairwise variability index
References
Baird, G. et al. Prevalence of disorders of the autism spectrum in a population cohort of children in South Thames: The special needs and autism project (SNAP). Lancet 368, 210–215. https://doi.org/10.1016/s0140-6736(06)69041-7 (2006).
Masi, A., DeMayo, M. M., Glozier, N. & Guastella, A. J. An overview of autism spectrum disorder, heterogeneity and treatment options. Neurosci. Bull. 33, 183–193. https://doi.org/10.1007/s12264-017-0100-y (2017).
Kurita, H. Infantile autism with speech loss before the age of thirty months. J. Am. Acad. Child Psychiatry 24, 191–196. https://doi.org/10.1016/s0002-7138(09)60447-7 (1985).
Lord, C. & Paul, R. Language and Communication in Autism. In D.J. Cohen & F.R. Volkmar (Eds.), Handbook of autism and pervasive developmental disorders (2nd ed.) (1997).
Mody, M. & Belliveau, J. W. Speech and language impairments in autism: Insights from behavior and neuroimaging. N. Am. J. Med. Sci. (Boston) 5, 157–161. https://doi.org/10.7156/v5i3p157 (2013).
Luyster, R. J., Kadlec, M. B., Carter, A. & Tager-Flusberg, H. Language assessment and development in toddlers with autism spectrum disorders. J. Autism Dev. Disord. 38, 1426–1438. https://doi.org/10.1007/s10803-007-0510-1 (2008).
Shriberg, L. D. et al. Speech and prosody characteristics of adolescents and adults with high-functioning autism and Asperger syndrome. J. Speech Lang. Hear. Res. 44, 1097–1115. https://doi.org/10.1044/1092-4388(2001/087) (2001).
Belyk, M. & Brown, S. Perception of affective and linguistic prosody: An ALE meta-analysis of neuroimaging studies. Soc. Cogn. Affect. Neurosci. 9, 1395–1403. https://doi.org/10.1093/scan/nst124 (2014).
McCann, J., Peppé, S., Gibbon, F. E., O’Hare, A. & Rutherford, M. Prosody and its relationship to language in school-aged children with high-functioning autism. Int. J. Lang. Commun. Disord. 42, 682–702. https://doi.org/10.1080/13682820601170102 (2007).
Filipe, M. G., Frota, S., Castro, S. L. & Vicente, S. G. Atypical prosody in Asperger syndrome: Perceptual and acoustic measurements. J. Autism Dev. Disord. 44, 1972–1981. https://doi.org/10.1007/s10803-014-2073-2 (2014).
Frota, S. & Butler, J. The Development of Prosody in First Language Acquisition (John Benjamins, 2018).
Prieto, P. & Esteve-Gibert, N. The Development of Prosody in First Language Acquisition (John Benjamins, 2018).
Diehl, J. J. & Paul, R. Acoustic and perceptual measurements of prosody production on the profiling elements of prosodic systems in children by children with autism spectrum disorders. Appl. Psycholinguist. 34, 135–161. https://doi.org/10.1017/s0142716411000646 (2013).
Lehnert-LeHouillier, H., Terrazas, S. & Sandoval, S. Prosodic entrainment in conversations of verbal children and teens on the autism spectrum. Front. Psychol. https://doi.org/10.3389/fpsyg.2020.582221 (2020).
Diehl, J. J., Watson, D., Bennetto, L., McDonough, J. & Gunlogson, C. An acoustic analysis of prosody in high-functioning autism. Appl. Psycholinguist. 30, 385–404. https://doi.org/10.1017/S0142716409090201 (2009).
Paul, R., Bianchi, N., Augustyn, A., Klin, A. & Volkmar, F. R. Production of syllable stress in speakers with autism spectrum disorders. Res. Autism Spectr. Disord. 2, 110–124. https://doi.org/10.1016/j.rasd.2007.04.001 (2008).
Van Santen, J., Prud’hommeaux, E. T., Black, L. M. & Mitchell, M. Computational prosodic markers for autism. Autism 14, 215–236. https://doi.org/10.1177/1362361309363281 (2010).
Patel, S. P. et al. An acoustic characterization of prosodic differences in autism spectrum disorder and first-degree relatives. J. Autism Dev. Disord. 50, 3032–3045. https://doi.org/10.1007/s10803-020-04392-9 (2020).
Johnstone, T. & Scherer, K. The effects of emotions on voice quality. In Proc. XIVth International Congress of Phonetic Sciences (1999).
Godin, K. W. & Hansen, J. H. Physical task stress and speaker variability in voice quality. Eurasip. J. Audio Speech Music Process. 1, 1–13. https://doi.org/10.1186/s13636-015-0072-7 (2015).
Hubbard, D. J., Faso, D. J., Assmann, P. F. & Sasson, N. J. Production and perception of emotional prosody by adults with autism spectrum disorder. Autism Res. 10, 1991–2001. https://doi.org/10.1002/aur.1847 (2017).
Drimalla, H. et al. Towards the automatic detection of social biomarkers in autism spectrum disorder: Introducing the simulated interaction task (SIT). NPJ Digit. Med. 3, 25. https://doi.org/10.1038/s41746-020-0227-5 (2020).
Olivati, A. G., Assumpção, F. B. J. & Misquiatti, A. R. Acoustic analysis of speech intonation pattern of individuals with autism spectrum disorders. Codas 29, e20160081. https://doi.org/10.1590/2317-1782/20172016081 (2017).
Müller, C. (ed.) Speaker Classification I: Fundamentals, Features, and Methods 88–107 (Springer, 2007).
Delaune, Heather, Differences between the acoustic parameters of prosody in speakers with asd and typically developing speakers ages three to six. LSU Master's Theses. 4914. https://digitalcommons.lsu.edu/gradschool_theses/4914 (2019).
Nakai, Y., Takashima, R., Takiguchi, T. & Takada, S. Speech intonation in children with autism spectrum disorder. Brain Dev. 36, 516–522. https://doi.org/10.1016/j.braindev.2013.07.006 (2014).
Kwon, H.-B. Gender difference in speech intelligibility using speech intelligibility tests and acoustic analyses. J. Adv. Prosthodont. 2, 71–76. https://doi.org/10.4047/jap.2010.2.3.71 (2010).
Hiramoto-Sanders, M. Proc. Annual Meeting of the Berkeley Linguistics Society, 101–112.
Nadig, A. & Shaw, H. Acoustic and perceptual measurement of expressive prosody in high-functioning autism: Increased pitch range and what it means to listeners. J. Autism Dev. Disord. 42, 499–511. https://doi.org/10.1007/s10803-011-1264-3 (2012).
Fisher, J., Plante, E., Vance, R., Gerken, L. & Glattke, T. J. Do children and adults with language impairment recognize prosodic cues? J. Speech Lang. Hear. Res. 50, 746–758. https://doi.org/10.1044/1092-4388(2007/052) (2007).
Domahs, U., Plag, I. & Carroll, R. Word stress assignment in German, English and Dutch: Quantity-sensitivity and extrametricality revisited. J. Compar. Germanic Linguist. 17, 59–96. https://doi.org/10.1007/s10828-014-9063-9 (2014).
Ng, R. W. M., Lee, T., Leung, C., Ma, B. & Li, H. Spoken language recognition with prosodic features. IEEE Trans. Audio Speech Lang. Process 21, 1841–1853. https://doi.org/10.1109/TASL.2013.2260157 (2013).
Stathopoulos, E., Huber, J. & Sussman, J. Changes in acoustic characteristics of the voice across the life span: Measures from individuals 4–93 years of age. J. Speech Hear. Res. 54, 1011–1021 (2011).
Hulland, J. & Houston, M. B. Why systematic review papers and meta-analyses matter: An introduction to the special issue on generalizations in marketing. J. Acad. Mark. Sci. 48, 351–359. https://doi.org/10.1007/s11747-020-00721-7 (2020).
Fusaroli, R., Lambrechts, A., Bang, D., Bowler, D. M. & Gaigg, S. B. Is voice a marker for Autism spectrum disorder? A systematic review and meta-analysis. Autism Res. 10, 384–407. https://doi.org/10.1002/aur.1678 (2017).
Grossman, R. B., Bemis, R. H., Plesa Skwerer, D. & Tager-Flusberg, H. Lexical and affective prosody in children with high-functioning autism. J. Speech Lang. Hear. Res. 53, 778–793. https://doi.org/10.1044/1092-4388(2009/08-0127) (2010).
Lyakso, E., Frolova, O. & Grigorev, A. Lecture Notes in Computer Science (Including Subseries Lecture Notes in Artificial Intelligence and Lecture Notes in Bioinformatics), LNCS, Vol. 9811, 43–50 (2016).
Nayak, V., Deshmukh, R. & Waghmare, S. Pitch pattern analysis in speech of children with autism spectrum disorder. Int. J. Innov. Technol. Explor. Eng. 9, 4209–4212. https://doi.org/10.35940/ijitee.A6119.119119 (2019).
Wehrle, S., Cangemi, F., Hanekamp, H., Vogeley, K. & Grice, M. Proc. International Conference on Speech Prosody, 809–813.
Werling, D. M. & Geschwind, D. H. Sex differences in autism spectrum disorders. Curr. Opin. Neurol. 26, 146–153. https://doi.org/10.1097/WCO.0b013e32835ee548 (2013).
Schwarzer, G., Carpenter, J. & Rücker, G. Small-Study Effects in Meta-Analysis 107–141 (Springer, 2015).
Arciuli, J. & Bailey, B. An acoustic study of lexical stress contrastivity in children with and without autism spectrum disorders. J. Child Lang. 46, 142–152. https://doi.org/10.1017/s0305000918000272 (2019).
Arciuli, J., Colombo, L. & Surian, L. Lexical stress contrastivity in Italian children with autism spectrum disorders: An exploratory acoustic study. J. Child Lang. 47, 870–880. https://doi.org/10.1017/s0305000919000795 (2020).
Bone, D., Bishop, S., Gupta, R., Lee, S. & Narayanan, S. Proc. Annual Conference of the International Speech Communication Association, INTERSPEECH, 1185–1189.
Bonneh, Y. S., Levanon, Y., Dean-Pardo, O., Lossos, L. & Adini, Y. Abnormal speech spectrum and increased pitch variability in young autistic children. Front. Hum. Neurosci. https://doi.org/10.3389/fnhum.2010.00237 (2010).
Brisson, J., Martel, K., Serres, J., Sirois, S. & Adrien, J. L. Acoustic analysis of oral productions of infants later diagnosed with autism and their mother. Infant Ment. Health J. 35, 285–295. https://doi.org/10.1002/imhj.21442 (2014).
Chan, K. K. & To, C. K. Do individuals with high-functioning autism who speak a tone language show intonation deficits? J. Autism Dev. Disord. 46, 1784–1792. https://doi.org/10.1007/s10803-016-2709-5 (2016).
Choi, J. & Lee, Y. Conversational factors discriminating between high-functioning autism spectrum disorders and typical development: Perceptual rating scale. Commun. Sci. Disord. 24, 343–353. https://doi.org/10.12963/csd.19618 (2019).
Depape, A. M., Chen, A., Hall, G. B. & Trainor, L. J. Use of prosody and information structure in high functioning adults with autism in relation to language ability. Front. Psychol. 3, 72. https://doi.org/10.3389/fpsyg.2012.00072 (2012).
Demouy, J. et al. Differential language markers of pathology in autism, pervasive developmental disorder not otherwise specified and specific language impairment. Res. Autism Spectr. Disord. 5, 1402–1412. https://doi.org/10.1016/j.rasd.2011.01.026 (2011).
Esposito, G. & Venuti, P. Comparative analysis of crying in children with autism, developmental delays, and typical development. Focus Autism Other Dev. Disabl. 24, 240–247. https://doi.org/10.1177/1088357609336449 (2009).
Fosnot, S. M. & Jun, S. Proc. 14th International Congress of Phonetic Sciences, 1925–1928.
Hubbard, K. & Trauner, D. A. Intonation and emotion in autistic spectrum disorders. J. Psycholing. Res. 36, 159–173. https://doi.org/10.1007/s10936-006-9037-4 (2007).
Hudenko, W. J., Stone, W. & Bachorowski, J. A. Laughter differs in children with autism: An acoustic analysis of laughs produced by children with and without the disorder. J. Autism Dev. Disord. 39, 1392–1400. https://doi.org/10.1007/s10803-009-0752-1 (2009).
Kaland, C., Swerts, M. & Krahmer, E. Accounting for the listener: Comparing the production of contrastive intonation in typically-developing speakers and speakers with autism. J. Acoust. Soc. Am. 134, 2182–2196. https://doi.org/10.1121/1.4816544 (2013).
Nadig, A. & Mulligan, A. Intact non-word repetition and similar error patterns in language-matched children with autism spectrum disorders: A pilot study. J. Commun. Disord. 66, 13–21. https://doi.org/10.1016/j.jcomdis.2017.03.003 (2017).
Nadig, A. & Shaw, H. Acoustic marking of prominence: How do preadolescent speakers with and without high-functioning autism mark contrast in an interactive task? Lang. Cogn. Neurosci. 30, 32–47. https://doi.org/10.1080/01690965.2012.753150 (2015).
Ochi, K. et al. Quantification of speech and synchrony in the conversation of adults with autism spectrum disorder. PLoS ONE 14, e0225377. https://doi.org/10.1371/journal.pone.0225377 (2019).
Quigley, J., McNally, S. & Lawson, S. Prosodic patterns in interaction of low-risk and at-risk-of-autism spectrum disorders infants and their mothers at 12 and 18 months. Lang. Learn. Dev. 12, 295–310. https://doi.org/10.1080/15475441.2015.1075405 (2016).
Scharfstein, L. A., Beidel, D. C., Sims, V. K. & Finnell, L. R. Social skills deficits and vocal characteristics of children with social phobia or Asperger’s disorder: A comparative study. J Abnorm. Child Psychol. 39, 865–875. https://doi.org/10.1007/s10802-011-9498-2 (2011).
Sharda, M. et al. Sounds of melody–pitch patterns of speech in autism. Neurosci. Lett. 478, 42–45. https://doi.org/10.1016/j.neulet.2010.04.066 (2010).
Sheinkopf, S. J., Iverson, J. M., Rinaldi, M. L. & Lester, B. M. Atypical cry acoustics in 6-month-old infants at risk for autism spectrum disorder. Autism Res. 5, 331–339. https://doi.org/10.1002/aur.1244 (2012).
Unwin, L. M. et al. Acoustic Properties of cries in 12-month old infants at high-risk of autism spectrum disorder. J. Autism Dev. Disord. 47, 2108–2119. https://doi.org/10.1007/s10803-017-3119-z (2017).
Frolova, O.et al. Lecture Notes in Computer Science (Including Subseries Lecture Notes in Artificial Intelligence and Lecture Notes in Bioinformatics), LNAI, Vol. 11658, 103–112 (2019).
Lyakso, E., Frolova, O. & Grigorev, A. Lecture Notes in Computer Science (including subseries Lecture Notes in Artificial Intelligence and Lecture Notes in Bioinformatics), LNAI, Vol. 10458, 602–612 (2017).
Green, H. & Tobin, Y. Prosodic analysis is difficult … but worth it: A study in high functioning autism. Int. J. Speech Lang. Pathol. 11, 308–315. https://doi.org/10.1080/17549500903003060 (2009).
Bonnel, A. et al. Enhanced pure-tone pitch discrimination among persons with autism but not Asperger syndrome. Neuropsychologia 48, 2465–2475. https://doi.org/10.1016/j.neuropsychologia.2010.04.020 (2010).
Yeung, Y. T., Lee, T. & Leung, C. Supervised single-microphone multi-talker speech separation with conditional random fields. IEEE/ACM Trans. Audio Speech Lang. Process 23, 2334–2342. https://doi.org/10.1109/TASLP.2015.2479039 (2015).
Edelson, L., Grossman, R. & Tager-Flusberg, H. Poster Session Presented at the Annual International Meeting for Autism Research (2007).
Green, H. & Tobin, Y. Proc. 4th International Conference on Speech Prosody, SP 2008, 237–240.
Santos, J. F. et al. 2013 IEEE International Conference on Acoustics, Speech and Signal Processing, 7567–7571.
Parish-Morris, J. et al. Exploring autism spectrum disorders using HLT. Proc. Conf. Assoc. Comput. Linguist. Meet. 2016, 74. https://doi.org/10.18653/v1/w16-0308 (2016).
Bone, D. et al. The psychologist as an interlocutor in autism spectrum disorder assessment: Insights from a study of spontaneous prosody. J. Speech Lang. Hear. Res. 57, 1162–1177. https://doi.org/10.1044/2014_jslhr-s-13-0062 (2014).
Paccia, J. M. & Curcio, F. Language processing and forms of immediate echolalia in autistic children. J. Speech Hear. Res. 25, 42–47. https://doi.org/10.1044/jshr.2501.42 (1982).
Applebaum, E., Egel, A. L., Koegel, R. L. & Imhoff, B. Measuring musical abilities of autistic children. J. Autism Dev. Disord. 9, 279–285. https://doi.org/10.1007/bf01531742 (1979).
McConnell, S. R. Interventions to facilitate social interaction for young children with autism: Review of available research and recommendations for educational intervention and future research. J. Autism Dev. Disord. 32, 351–372. https://doi.org/10.1023/A:1020537805154 (2002).
Kent, R. D. & Vorperian, H. K. Static measurements of vowel formant frequencies and bandwidths: A review. J. Commun. Disord. 74, 74–97. https://doi.org/10.1016/j.jcomdis.2018.05.004 (2018).
Kent, R. D. Anatomical and neuromuscular maturation of the speech mechanism: Evidence from acoustic studies. J. Speech Hear. Res. 19, 421–447. https://doi.org/10.1044/jshr.1903.421 (1976).
Lee, S., Potamianos, A. & Narayanan, S. Acoustics of children’s speech: Developmental changes of temporal and spectral parameters. J. Acoust. Soc. Am. 105, 1455–1468. https://doi.org/10.1121/1.426686 (1999).
Coplan, J. Normal speech and language development: an overview. Pediatr. Rev. 16, 91–100. https://doi.org/10.1542/pir.16-3-91 (1995).
Zhang, Z. Regulation of glottal closure and airflow in a three-dimensional phonation model: Implications for vocal intensity control. J. Acoust. Soc. Am. 137, 898–910. https://doi.org/10.1121/1.4906272 (2015).
Plant, R. L. & Younger, R. M. The interrelationship of subglottic air pressure, fundamental frequency, and vocal intensity during speech. J. Voice 14, 170–177. https://doi.org/10.1016/s0892-1997(00)80024-7 (2000).
Stewart, B. A. & Klar, A. J. S. Can bronchoscopic airway anatomy be an indicator of autism? J. Autism Dev. Disord. 43, 911–916. https://doi.org/10.1007/s10803-012-1635-4 (2013).
Titze, I., Riede, T. & Mau, T. Predicting achievable fundamental frequency ranges in vocalization across species. PLoS Comput. Biol. 12, e1004907. https://doi.org/10.1371/journal.pcbi.1004907 (2016).
Lee, J.-H., Kim, G.-W. & Kim, S.-T. Laryngeal height and voice characteristics in children with autism spectrum disorders. Phonet. Speech Sci. 13, 91–101. https://doi.org/10.13064/ksss.2021.13.2.091 (2021).
Lavan, N., Burton, A. M., Scott, S. K. & McGettigan, C. Flexible voices: Identity perception from variable vocal signals. Psychon. Bull. Rev. 26, 90–102. https://doi.org/10.3758/s13423-018-1497-7 (2019).
Fusaroli, R. et al. Towards a cumulative science of vocal markers of autism: A cross-linguistic meta-analysis-based investigation of acoustic markers in American and Danish autistic children. BioRxiv. https://doi.org/10.1101/2021.07.13.452165 (2021).
Hackenberger, B. K. Bayesian meta-analysis now—Let’s do it. Croat. Med. J. 61, 564–568. https://doi.org/10.3325/cmj.2020.61.564 (2020).
Parola, A., Simonsen, A., Bliksted, V. & Fusaroli, R. Voice patterns in schizophrenia: A systematic review and Bayesian meta-analysis. Schizophr. Res. 216, 24–40. https://doi.org/10.1016/j.schres.2019.11.031 (2020).
Cox, C. M. M., Keren-Portnoy, T., Roepstorff, A. & Fusaroli, R. A Bayesian meta-analysis of infants’ ability to perceive audio-visual congruence for speech. Infancy https://doi.org/10.1111/infa.12436 (2021).
Peppé, S., McCann, J., Gibbon, F., O’Hare, A. & Rutherford, M. Receptive and expressive prosodic ability in children with high-functioning autism. J. Speech Lang. Hear. Res. 50, 1015–1028. https://doi.org/10.1044/1092-4388(2007/071) (2007).
Higgins, J. P. T., Thompson, S. G., Deeks, J. J. & Altman, D. G. Measuring inconsistency in meta-analyses. BMJ 327, 557–560. https://doi.org/10.1136/bmj.327.7414.557 (2003).
van Enst, W. A., Ochodo, E., Scholten, R. J., Hooft, L. & Leeflang, M. M. Investigation of publication bias in meta-analyses of diagnostic test accuracy: A meta-epidemiological study. BMC Med. Res. Methodol. 14, 70. https://doi.org/10.1186/1471-2288-14-70 (2014).
Luchini, C., Stubbs, B., Solmi, M. & Veronese, N. Assessing the quality of studies in meta-analyses: Advantages and limitations of the Newcastle Ottawa Scale. World J. Meta-Anal. 5, 80–84. https://doi.org/10.13105/wjma.v5.i4.80 (2017).
Durlak, J. A. How to select, calculate, and interpret effect sizes. J. Pediatr. Psychol. 34, 917–928. https://doi.org/10.1093/jpepsy/jsp004 (2009).
Frye, R. E. Social skills deficits in autism spectrum disorder: Potential biological origins and progress in developing therapeutic agents. CNS Drugs 32, 713–734. https://doi.org/10.1007/s40263-018-0556-y (2018).
Funding
This work was funded by Hamadan University of Medical Science, Hamadan, Iran No. 140004082979/IR.UMSHA.REC.1400.256.
Author information
Authors and Affiliations
Contributions
S.F. and E.J. performed systematic searches. S.F performed statistical analyses, meta-analysis and wrote the manuscript. S.B, S.A, S.F and E.J designed the study, performed the discussion and revised the manuscript.
Corresponding authors
Ethics declarations
Competing interests
The authors declare no competing interests.
Additional information
Publisher's note
Springer Nature remains neutral with regard to jurisdictional claims in published maps and institutional affiliations.
Supplementary Information
Rights and permissions
Open Access This article is licensed under a Creative Commons Attribution 4.0 International License, which permits use, sharing, adaptation, distribution and reproduction in any medium or format, as long as you give appropriate credit to the original author(s) and the source, provide a link to the Creative Commons licence, and indicate if changes were made. The images or other third party material in this article are included in the article's Creative Commons licence, unless indicated otherwise in a credit line to the material. If material is not included in the article's Creative Commons licence and your intended use is not permitted by statutory regulation or exceeds the permitted use, you will need to obtain permission directly from the copyright holder. To view a copy of this licence, visit http://creativecommons.org/licenses/by/4.0/.
About this article

Cite this article
Asghari, S.Z., Farashi, S., Bashirian, S. et al. Distinctive prosodic features of people with autism spectrum disorder: a systematic review and meta-analysis study. Sci Rep 11, 23093 (2021). https://doi.org/10.1038/s41598-021-02487-6
Received:
Accepted:
Published:
DOI: https://doi.org/10.1038/s41598-021-02487-6
- Springer Nature Limited
This article is cited by
-
Foundations of Vocal Category Development in Autistic Infants
Journal of Autism and Developmental Disorders (2024)
-
Predicting Social Competence in Autistic and Non-Autistic Children: Effects of Prosody and the Amount of Speech Input
Journal of Autism and Developmental Disorders (2024)
-
Endophenotype trait domains for advancing gene discovery in autism spectrum disorder
Journal of Neurodevelopmental Disorders (2023)
-
The role of interpersonal synchrony in forming impressions of autistic and non-autistic adults
Scientific Reports (2023)
-
Prosodic signatures of ASD severity and developmental delay in preschoolers
npj Digital Medicine (2023)