
Abstract
The methodology developed for predicting nuclear waste behavior under disposal conditions combines experimental approaches and modeling. A waste glass canister placed in contact with water undergoes irreversible chemical processes leading to its degradation into more stable phases. This transformation occurs in three kinetic stages: the initial alteration rate (stage I), the residual rate (stage II), and, in some cases, a resumption of alteration (stage III) related to zeolites precipitation. Affinity effects based on the transition state theory are used to account for the rate drop from stage I to stage II. However, modeling of stage III has not been extensively studied. This study investigates the ability of the "glass reactivity with allowance for the alteration layer" (GRAAL) model to describe the effect of zeolite precipitation on the dissolution kinetics of the international simple glass (ISG). The GRAAL model-based description of the alteration layer was adapted to account for alkaline pH alteration mechanisms. A model describing the nucleation and growth kinetics of zeolites was proposed based on simple formalisms whose parameters can be inferred from previous studies’ results. These improvements give a description of the moment where a resumption of alteration occurs. As the predictive capacity of the GRAAL model is strongly dependent on the appropriateness of the alteration layers’ description, this work shows the need to develop new functions to describe the evolution of their compositions and solubilities with pH changes. Calculations also show the importance of Al and Ca activities and the effect of Al on the silica solubility.
Introduction
In France, Japan, Russia, the UK, and the USA, high-level radioactive waste arising from dismantling operations or spent fuel recycling process, consisting of fission products and minor actinides, are confined by vitrification. The reference solution for the management of these waste packages over geological timescales is their storage in a deep, low-permeability and stable geological formation. The development of a methodology for predicting waste behavior under disposal conditions for much longer periods than those experimentally achievable began in the 1980s, marking the birth of “long-term behavior science” combining experimental approaches and modeling.1,2,3,4,5,6
A waste glass canister placed in contact with water undergoes irreversible chemical processes: water diffusion, ion-exchange, hydrolysis, condensation, and precipitation reactions. As a result, the glass components can form an amorphous, porous, hydrated, and potentially passivating material (hereafter called “gel”) or precipitate into crystalline phases. Under disposal conditions, the above processes are linked to different kinetic stages: the initial rate (stage I), followed by the rate drop to the residual rate (stage II), and in some cases a resumption of alteration (RA)7 (stage III) related to the precipitation of zeolites.
To date, affinity effects based on the transition state theory (TST) have been used to account for the rate drop. The first mechanistic model describing glass alteration was proposed by Grambow2 and was based on Aagaard and Helgeson’s first-order kinetic law.8 Equation (1)2 represents the achievement of a maximum rate that decreases with the increase in the H4SiO4 activity \(\left( {a_{{\mathrm{H}}_4{\mathrm{SiO}}_4}} \right)\) in solution with the reaction progress, ξ, and becomes theoretically null when \(a_{{\mathrm{H}}_4{\mathrm{SiO}}_4}\) = \(a_{{\mathrm{H}}_4{\mathrm{SiO}}_4,{\mathrm{sat}}}\) in the stationary state, defined as the saturation state with respect to amorphous silica \(\left( {a_{{\mathrm{H}}_4{\mathrm{SiO}}_4,{\mathrm{sat}}}} \right)\).
As described below, most of the models developed to date are based on an affinity term, that can be written with respect to a rate-limiting compound which could be a siliceous phase2,9 or a multi-element phase10,11,12 such as the pristine glass itself,13,14 a hydrated glassy structure depleted in alkalis15 or an amorphous gel.16 The nature and the way the rate-limiting phase forms is still a topic of debate. Glass dissolution is most often modeled by a first-order law meaning that the rate becomes null when equilibrium is reached. This does not agree with the experimental work showing that the alteration does not stop after the saturation conditions are reached.17,18,19 Grambow and Müller20 proposed an extension of the previous models coupling water diffusion and dissolution mechanisms where water penetration becomes a prerequisite for glass dissolution.
RA has also been the subject of modeling studies. Van Iseghem and Grambow21 were the first to model a RA using PHREEQE/GLASSOL codes. Their calculations predicted an acceleration of the alteration rate when Na and Al concentrations reached the solubility limit of analcime. Using this model, a RA can only be predicted by the first-order law if \(a_{{\mathrm{H}}_4{\mathrm{SiO}}_4}\) decreases, which is not at all the case in most experiments (Fournier et al.7 and references therein) and calls into question the rate-limiting step. Van Iseghem and Grambow’s calculations21 were also the first to indicate that some glass compositions are unstable with respect to zeolites. The scope of this work was extended by Strachan and Croak22,23,24 who based their calculations on the stability fields of potential glass alteration products depending on Si, Al, B, N, Ca, and Li glass contents, and reaction progress. Finally, the ACT™ model25 proposed a description of glasses based on their energy and entropy differences from a normative “crystalline reference state” and revealed that for most of the nuclear glass compositions investigated, the Si content is adequate to maintain a residual rate regime and avoid RA. These glass alteration models do not take into account the role of Al in the formation of a passivating gel, nor the need to maintain a sufficient Si density in the gel to ensure passivation. Moreover, these are not kinetic models where time is a parameter.
The "glass reactivity with allowance for the alteration layer" (GRAAL) model is based on the influence of the gel and its composition on the glass dissolution rate.26 The model is built using a kinetic law taking into account the coupling between the affinity effects and the diffusion processes in the gel and calculates mass balances to evaluate the distribution of the elements from glass alteration between solution, secondary minerals, and gel. Until now, the GRAAL model has been parametrized for pH values between 6 and 10 at temperatures of 25 and 90 °C and has been used to explain the effects of the glass surface area-to-solution volume-ratio, solution renewal rate27 and groundwater composition on glass long-term behavior,28 or to quantify the reactivity between glass and near-field minerals.29,30,31
The objective of this study is to examine the potential of the GRAAL model to describe the processes involved in glass RA. Such an approach would allow a temporal projection beyond durations accessible experimentally. Moreover, processes involving many mechanisms, the modeling allows understanding their potential couplings and the role of various parameter such as the pH or the solution composition. As GRAAL is implemented in the geochemical CHESS/HYTEC code,32 the question is to determine whether the formalism implemented in this code can help describe the nucleation-growth of zeolites to the detriment of glass. The main hypotheses and parameters were deduced from experiments conducted by Fournier et al.,33 dedicated to the understanding of RA. The glass used was the international simple glass (ISG) a six oxides (SiO2, B2O3, Na2O, Al2O3, CaO, and ZrO2) reference glass of nuclear interest.34,35 In Fournier et al.,33 glass RA characterization, easier at alkaline pH, was extended to lower pH levels thanks to seeding that reduces, or even eliminates, the latency period preceding RA. In such seeded tests, the zeolites growth prevails over any new nucleation, so that the joint use of seeded and unseeded tests allow for deconvoluting growth and nucleation-growth phenomena.
Results
Equations describing zeolites nucleation and growth
All the variables in the equations in the manuscript are summarized in Table 1. These equations were written to account for tests where zeolites nucleate and grow, and zeolite-seeded tests33 where seeds growth predominates compared to neoformed zeolite nucleation.
Case of unseeded tests
In the proposed approach, zeolite nucleation takes place on the outer surface S of the gel and is carried out at a rate: rn = γn × S. Assuming that the nucleation rate and surface are constant in time, the amount of formed nuclei as a function of time is expressed as: nn(t) = γn × S × t. This hypothesis of consistency of the nucleation surface seems reasonable since experiments show that zeolites precipitate on the outer surface area of the gel which remains constant over time. However, it does not take into account the surface reduction due to zeolite precipitation.
In the plane of the zeolite/gel interface, these nuclei occupy a surface area provided for growth Sc(t) = nn(t) × σn = γn × S × t × σn expressed as a function of their specific surface area σn projected in this same plane. At this stage, it is assumed that the zeolite crystals grow from nuclei in a single direction (perpendicular to the gel surface, Supplementary Fig. 1) in agreement with the main direction for zeolites growth as they cover the glass surface.
After nucleation, the zeolites grow (“perpendicularly to the glass surface”) at a dnz(t)/dt = γc × Sc(t) rate. Assuming that γc does not depend on time, integrating the rate leads to nz(t) = (γc × γn × S × σn/2) × t2 expressing the evolution of the zeolites amount formed in time as a function of t2. Note that γc actually varies with the solution supersaturation with respect to zeolites, and therefore with time. The CHESS/HYTEC code allows a numerical resolution of this dependency as it will be further explained. Since the specific surface area of the nuclei is not known, only the “nucleation frequency” fn = γn × σn can be derived from experimental data,33 using Eq. (2):
Seeded tests
In seeded tests, nucleation is assumed to be negligible compared to the growth of seeds initially introduced. In this case, the seeds surface area S c is independent of time. This hypothesis is justified by experimental evidence33 qualitatively indicating that the amount of neoformed zeolites is negligible and the seeds growth can be reasonably simulated by the unidirectional growth of a set of needles with a total surface area, S c , close to the geometrical surface area of the seeds (Supplementary Fig. 2). Equation (3) is then obtained, where the zeolites amount is a linear function of time.
Description of the alteration layer: gel and secondary phases
As already mentioned, the GRAAL model is currently parametrized for pH values between 6 and 10 at 25 and 90 °C, with a gel represented by a set of end-members (refer to the “Methods” section for more details). The model considers that the passivation properties of the gel are conditioned to the formation of a silico-aluminous end-member, called passivating reactive interphase (PRI). Thus, the current set of end-members cannot properly describe the gel formed at alkaline pH because the solutions are under-saturated with respect to the Si–Al composition of the PRI. Therefore, a new set of end-members must be defined to account for the gel formed in an alkaline medium where the RA is likely to take place.
Calculation of activities in solution
The activities of the dissolved elements are used to write dissolution-precipitation reactions and to calculate saturation indexes. We calculated the activities of Si, B, Na, and Al using the CHESS code and the ThermoChimie database as well as data from unseeded tests described in Fournier, et al.33 The activities of Ca and Zr cannot be derived from solution analyses (incoherent Ca concentrations and too low Zr concentrations). Therefore, the activity of Ca was approximated by considering the solubility product of the “CSH0.8” phase with a 0.8 Ca/Si ratio close to that measured by Gin et al.36 under close experimental conditions (Ca/Si ≈ 0.5). The activity of Zr was calculated at equilibrium using data from the most soluble phase of zirconium hydroxide in the database at the calculated average pH.
Gel passivating end-member: PRI
In the model, the glass alteration kinetics was described by the deviation-from equilibrium between PRI and the solution. The variation of the PRI ionic product, QPRI, must then account for the activities in solution before the resumption of alteration (this period is called “plateau phase” by Fournier et al.33) and the alteration rate variations. In an alkaline environment, it is necessary to make the PRI less soluble than in its current state so it can account for the dissolved Si activities during the plateau time period preceding the RA.33 We chose to add Ca into the PRI because it has a stronger affinity for the gel37 than Na. Given the chemical complexity of the system, it is necessary to make simplifying assumptions to carry out the calculations. Their relevance will be further discussed. We assumed that: the effect of Zr on QPRI is negligible, Ca is incorporated into the PRI maintaining a 1:2 Ca:Al ratio,38 and no Na is added to the PRI in the presence of Ca.38
To constrain the Si/Al ratio of the PRI, we use the PRI first-order dissolution law: r(t) = r0 × (1 − QPRI/KPRI) and compare the experimental QPRI/KPRI ratio, equal to 1 − r(t)/r0, to the calculated one at each sampling time. This indicates that the Si/Al ratio of the PRI should be in the 0.1–0.7 range. The best fit with the experimental data leads to the chosen stoichiometry: SiAl0.3Ca0.15O2.6. The solubility constant of the PRI, KPRI, is supposedly equal to QPRI when r(t)/r0 → 0 by assimilating the glass dissolution rate to that of the PRI. Thus, the solubility of the PRI can account for the concentrations during the plateau phase under alkaline pH as well as for the RA rate remaining lower than the initial rate.33 The characteristics of this end-member account for the roles of Al and Ca on Si condensation at pH > 10 and the inadequacy of Eq. (1) formalism that only takes into account silicon in the affinity term. Moreover, it reflects that the gel is enriched in Al and Ca compared to Si which is very soluble at pH > 10.39
Secondary phases: zeolites and C–S–H
Experimental data33 show that the mobilization of Al in the secondary phases is negligible during the plateau period and that Al is then progressively retained in the zeolites until it is entirely incorporated into alteration products during the RA. The same behavior is attributed to Ca mobilized in C–S–H. The amounts of Si mobilized in zeolites and C–S–H are calculated using molar ratios: Al/Si = 0.533 for zeolites and Ca/Si = 0.840 for C–S–H. At high reaction progress, it is hypothesized that zeolites and C–S–H eventually “control” Al and Ca activities, respectively.
The composition and solubility product of the Na-P2 zeolite observed in tests33 and absent from the ThermoChimie database41 are derived from dedicated experimental data (Supplementary Discussion). Its precipitation (Eq. (4)) and dissolution (Eq. (5)) rates are modeled using equations derived from TST.8 In Eqs. (4) and (5) below α and β are two empirical positive dimensionless numbers. Temkin’s coefficient, α, representing the destruction rate of the activated complex compared to the overall reaction rate, was set to 1 (typically α = 1, 2, or 342), while β was used to test the sensitivity of the reaction to the deviation-from-equilibrium. When β = 1 a linear-TST law was used, whereas when β → 0 (β = 10–20 in calculations), the affinity term was disabled and the precipitation or dissolution rates became independent of the degree of supersaturation of the solution.
Other siliceous, aluminous, and calcic secondary phases retrieved from the ThermoChimie database are allowed to precipitate: “SiO2(am)”, “calcite”, and the C–S–H studied by Blanc et al.40: “CSH0.8”, “CSH1.2”, and “CSH1.6”.
Gel non-passivating end-members
Given the previous hypotheses concerning the compositions of secondary phases and PRI, the non-passivating gel composition could be calculated at any time.
In particular, the stoichiometry of the “final gel”, i.e., the mineral where excess elements will precipitate after the formation of secondary phases could be deduced. The final gel controls the activities of Si and Zr at high reaction progress. At that time, all Zr is considered to be mobilized in the final gel and Na is integrated to compensate Zr charges, i.e., two Na atoms per Zr atom.38 The estimated stoichiometry of this final gel is then SiZr0.1Na0.2O2.3 (SiZr0.1Na0.2).
We need to define at least two additional end-members. Controlling the activities of the dissolved Zr and Al before the RA requires (i) a Zr-rich end-member with respect to Si because this element is mobilized in large amounts in solution at the beginning of the tests: SiZrNa2O5 (SiZrNa) and (ii) an Al-rich end-member to control the Al activity during the plateau phase while the PRI controls Si activity: SiAl3Ca1.5O8 (SiAlCa). The choices of these stoichiometries involve a degree of arbitrariness even if they are guided by the respect of the evolution of the gel composition evaluated by the experiments. The set of proposed end-members must allow the control of the activity of aqueous species during the plateau phase. In particular, having an end-member with a Si/Al ratio smaller than that of the SiZr0.1Na0.2 end-member makes it possible to describe the depletion of Zr compared to Si in the gel during the RA. The solubility products of the end-members are adjusted by a fitting approach to account for the activities of the elements they control (Supplementary Fig. 3 and Supplementary Table 1)
Determining γ c and f n using seeded and unseeded tests
The proposed approach was used to determine the zeolite growth rate γ c from seeded tests and the nucleation frequency fn = γn × σn from unseeded tests conducted by Fournier et al.33 at various imposed pH values. The values of these parameters were determined by dichotomy and comparison with experimental data through a fitting approach (Table 2). Their evolution with the pH is given in Fig. 1. When β → 0 the nucleation and growth rates increase with increasing pH. Conversely, when β = 1 the growth rate varies little with the pH and shows no trend.

Nucleation and growth parameters evolution with pH. Evolution of a the nucleation frequency fn and b the growth rate per unit area γc as a function of hydroxide concentration without taking into account the deviation-from-equilibrium (β → 0)
Figure 2 and Supplementary Figs. 4–7 compare the modeled concentrations and those measured in solution in the tests conducted by Fournier et al.33 The activities of B, Si, Al, and Na in solution were generally well reproduced by the model, although it may appear less convincing for the unseeded test at pH90°C = 10.1. However, given the uncertainties, this result remains acceptable and can illustrate the achievement of the limits of the model for the less alkaline pH. When β → 0, the zeolites precipitation rate is maintained high throughout the experiment, which leads to a marked increase in the computing time by decreasing the calculation time step as the unaltered glass quantity decreases to zero; thus, some modeled curves cannot be compared with experimental data over the entire test duration. Note that the pH regulation is modeled by an average flow of a sodium solution causing a slight dilution of the solution, visible through a decrease of modeled concentrations when the glass is completely altered. These cases occur at pH90°C ≥ 10.7: the total alteration of the glass results in reaching a final plateau.

Comparisons between modeled and experimental concentrations. Experimental B, Si, Na, and Al 33 (diamonds) and modeled (dashed line for β = 1 and dotted line for β → 0) concentrations in a unseeded and b seeded tests conducted at pH 10.7 maintained by adding NaOH in static conditions, at 90 °C, S/V = 1770 m−1 (other tested conditions are presented in Supplementary Figs. 4–7)
Application of the model for predictive purposes: case of unregulated pH medium
The parameterization obtained in the previous sections is then used to describe a medium where the initial pH value is 10.7 at 90 °C and then is allowed to change on its own. Figure 3 shows the results obtained when α = β = 1. At the first time, the model shows the formation of a very thin passivating layer that dissolves little. It is destabilized by the precipitation of a growing amount of zeolites and the glass reaches its maximum dissolution rate after about 10 days. Significant changes in the solution chemistry then occur: increase in Si concentration and decrease in Al concentration and pH; they cause an increase in the saturation index of the PRI, which tends towards 0 when the zeolites precipitation ceases. The decrease in pH is explained by the reduction of the alkalinity of the system due to zeolites precipitation (equation in Supplementary Discussion). Thus, in the absence of an external alkali source, the pH of the medium is determined by the ratio between the elements released by the glass behaving as weak acids and alkalis. For ISG this ratio is high enough to cause a decrease in pH. Such behavior has been observed recently for peraluminous glass.43 The precipitation rate of zeolites then slows down before becoming zero, the RA is then stopped. When the modeled pH reaches 10.4, the glass alteration rate is 7 × 10⁻³ g m−2 d−1 compared to 4 × 10⁻² g m−2 d−1 measured experimentally.33 The final pH stabilizes at 10.1.

Application of the model to a medium with pH varying freely from an initial value of 10.7. Other conditions (static, T, and S/V) remain the same. Evolutions predicted by the model for a PRI saturation index, b zeolite and glass quantities, and concentrations of c B, d Si, e Na, f Al, and g pH (with α = β = 1). The initial rate regime explains the calculated data for day 1
The same calculations can be carried out without taking into account the deviation-from-equilibrium. In this case, the precipitation rate is pH-dependent: γ′n and γ′g are calculated using the following formulas: γ = γ′ × [HO−]χ with χ = 1.1 for nucleation and 2.2 for growth (Fig. 1). This calculation, before the time step drops, makes it possible to compare the effects of the deviation-from-equilibrium with those of the pH (Fig. 4).

Comparison of the evolutions predicted by the model for a the pH and b the zeolites precipitation rate when the deviation-from-equilibrium is taken into account (β = 1) or when the zeolites precipitation rate is pH-dependent (β → 0)
Discussion
The following observations regarding the correlations between elementary concentrations can be made when comparing the measured solution concentrations in the seeded and unseeded tests33 (Fig. 2 and Supplementary Figs. 4–7) with those modeled.
-
Al–Si correlation. During the plateau time period, Al is present in the SiAlCa end-member and the PRI (Eqs. (7) and (8)). During the RA, the decrease in the Al concentration is allowed by the SiAlCa end-member dissolution and the zeolites precipitation which subsequently controls the Al activity (Fig. 5). This decrease in Al activity tends to be compensated by the increase in Si activity which tends toward saturation with respect to the PRI, which is nevertheless destabilized by zeolites and C–S–H growth (Eq. (9)40). Silicon is partly mobilized in these secondary phases and the excess Si precipitates in the amorphous layer, which is then depleted in Zr and Na relative to Si (transition SiZrNa → SiZr0.1Na0.2 in Supplementary Fig. 3).
$$\begin{array}{c}{^\prime}{^\prime}{\mathrm{PRI}}{^\prime}{^\prime} \left( {{\mathrm{SiAl}}_{{\mathrm{0}}{\mathrm{.3}}}{\mathrm{Ca}}_{{\mathrm{0}}{\mathrm{.15}}}{\mathrm{O}}_{{\mathrm{2}}{\mathrm{.6}}}} \right) + 1.4{\kern 1pt} {\mathrm{H}}_{\mathrm{2}}{\mathrm{O}} + 1.{\mathrm{2}}{\kern 1pt} {\mathrm{H}}^ + \cr \begin{array}{*{20}{c}} \leftrightarrows \cr \end{array}{\mathrm{H}}_{\mathrm{4}}{\mathrm{SiO}}_{\mathrm{4}} + 0.3{\kern 1pt} {\mathrm{Al}}^{3 + } + 0.15{\kern 1pt} {\mathrm{Ca}}^{2 + }\end{array}$$(7)$$\begin{array}{c}{^\prime}{^\prime} {\mathrm{SiAlCa}}{^\prime}{^\prime} \left( {{\mathrm{SiAl}}_{\mathrm{3}}{\mathrm{Ca}}_{{\mathrm{1}}{\mathrm{.5}}}{\mathrm{O}}_{\mathrm{8}}} \right) + {\mathrm{12}}{\kern 1pt} {\mathrm{H}}^ + \cr \begin{array}{*{20}{c}} \leftrightarrows \cr \end{array}{\mathrm{H}}_{\mathrm{4}}{\mathrm{SiO}}_4 + {\mathrm{3}}{\kern 1pt} {\mathrm{Al}}^{3 + } + {\mathrm{1}}{\mathrm{.5}}{\kern 1pt} {\mathrm{Ca}}^{2 + } + {\mathrm{4}}{\kern 1pt} {\mathrm{H}}_{\mathrm{2}}{\mathrm{O}}\end{array}$$(8)$$\begin{array}{c}{^\prime}{^\prime} {\mathrm{CSH0}}{\mathrm{.8}}{^\prime}{^\prime} \left( {{\mathrm{Ca}}_{{\mathrm{0}}{\mathrm{.8}}}{\mathrm{SiO}}_{2.5}\left( {{\mathrm{OH}}} \right)_{0.6}\cdot {\mathrm{1}}{\mathrm{.24}}{\kern 1pt} {\mathrm{H}}_{\mathrm{2}}{\mathrm{O}}} \right) + 1.6{\kern 1pt} {\mathrm{H}}^ + \cr \begin{array}{*{20}{c}} \leftrightarrows \cr \end{array}{\mathrm{H}}_{\mathrm{4}}{\mathrm{SiO}}_4 + {\mathrm{0}}{\mathrm{.8}}{\kern 1pt} {\mathrm{Ca}}^{2 + } + {\mathrm{0}}{\mathrm{.34}}{\kern 1pt} {\mathrm{H}}_{\mathrm{2}}{\mathrm{O}}\end{array}$$(9)Fig. 5 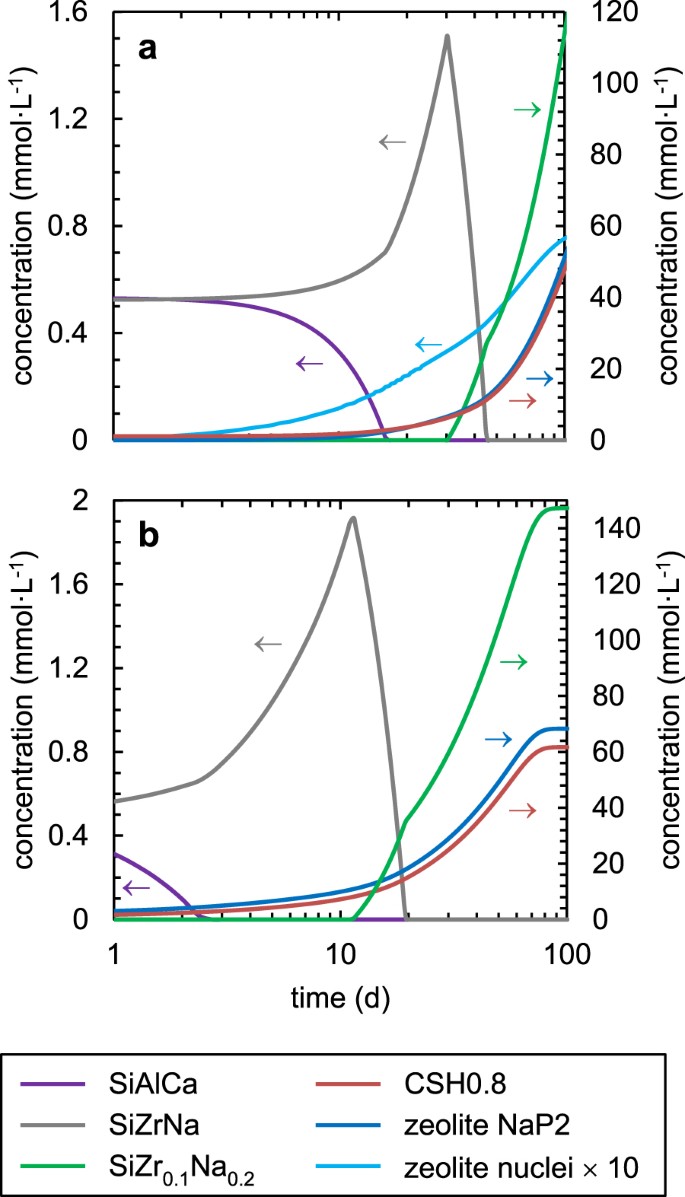
End-members behavior over time. Evolution of the end-member and secondary phase concentrations in the modeling of a an unseeded (US-1770-10.7 33) and b a seeded (S-1770-10.7 33) test. The arrows indicate which y-axis to refer to
-
B–Al correlation. The decrease of the Al concentration in solution indicates that zeolites precipitate. This drop also marks the transition between the plateau time period and the RA. Beyond this point, zeolites precipitation drives glass alteration (approximately day 25 in Fig. 2a).
-
B–Si correlation. The amount of B released during the plateau time period of the unseeded tests is consistent with the amount of dissolved Si required to reach the solubility of the PRI. This correlation confirms that the reactive diffusion is negligible given the conditions of the study. It should also be noted that for tests resulting in the complete alteration of the glass (pH ≥ 10.7), B concentrations are well reproduced by the model, confirming that B remains a good tracer of ISG alteration at high reaction progress in alkaline environments.
-
B–Na correlation. The description of the Na flux due to pH regulation is satisfactory. However, the uncertainties induced by adding NaOH to maintain the pH in the tests make the quantification of the Na retention in the secondary phases and depleted gel impossible.

The description of zeolite precipitation kinetics by a law depending on t for seeded tests and t2 for unseeded tests gives satisfactory results. However, the integration of the equations for minerals growing in several directions would show that the higher the dimensionality of the objects is, the higher the power of t will be.44 The simplest resolution proposed in this study is a limiting case considered because experimental results make it impossible to determine the power of t more precisely.
The nucleation and growth rates were determined at each pH by dichotomy and comparison with experimental data for two different values of the deviation-from-equilibrium coefficient β. When the deviation-from-equilibrium is not accounted for in calculations (β → 0), there is no feedback effect from the environment on the precipitation rate of zeolites. Growth rate, γc, variations are only affected by the pH and could be implemented in the code by applying a coefficient ≈2 to the HO− concentration (Fig. 1). Conversely, when β = 1, the growth rate does not significantly vary with the pH: these calculations illustrate another borderline case where the pH has no effect on the precipitation of the zeolites. The tests conducted by Fournier et al.33 do not allow to decorrelate the effects of the pH from those of the deviation-from-equilibrium, to precisely specify the value of β. However, it appears that when the precipitation rate of zeolites is pH-dependent, this phenomenon is faster and the decrease in pH is greater (Fig. 4), thus shows that the modeled pH value depends on both the zeolites precipitation and the gel description. Nevertheless, for the two values of β in the absence of alkalis inputs, the model predicts alkalinity consumption during the RA, which induces a reduction in the zeolites precipitation rate.
Although it is important to be knowledgeable about the precipitated secondary phases as demonstrated by the implementation of some thermodynamic data for Na-P2 zeolites, the panel of zeolites considered in these calculations remains reduced. The thermodynamic data estimated for the Na-P2 zeolite were used for all the modeled pH, but this zeolite is no longer kinetically favored below pH = 10.4 under the experimental conditions used.33 This limit is shown in Fig. 3 where the final pH stabilizes around 10.1, when the experimental data show that zeolites precipitation continues slowly. Moreover, other zeolites, such as analcime, could form in the long term,5,24 which makes the identification and acquisition of the thermodynamic data of these phases important.
The overall composition of the gel changes over time. This evolution is due to several factors. Among them, the change of the solution volume (changing the solution volume induces a change in gel composition as the elemental ratios in solution are different from those of the glass), and the pH variations that modify the speciation of elements in the solution and shift the equilibrium between the gel and the solution. There are another reasons related to the intrinsic evolution of the gel which undergoes hydrolysis and condensation reactions,45 and to the precipitation of the secondary phases. The proposed model has a minimal number of end-members whose stoichiometries and solubility products can, to a certain extent, be chosen in intervals bounded by experimental constraints. If the model adequately describes the experimental data, the definition of the end-members is based on the assumptions described above. Moreover, it is likely that other end-member sets can also reproduce the data.
The PRI defined in this study is quite different from the one implemented in the GRAAL model parameterized for the 6–10 pH interval. This Si–Al–Ca PRI contains higher Al/Si and Ca/Si ratios than those of the ISG. As already explained, a predominantly siliceous gel would be too soluble and could not form during the plateau phase at alkaline pH. The contents chosen for Al and Ca are arbitrary to a degree, although it is undeniable that these two elements are of primary importance during the RA, because of their consumption during the precipitation of zeolites and C–S–H, respectively. Taking into account the effect of Al on the Si solubility of the amorphous layer38 makes the modeling of RA possible. However, it is likely that the Si–Al–Ca PRI, as defined in this study, is under-saturated at circumneutral pH.
The proposed model highlights some limits related to the gel description. For an initially alkaline pH allowed to vary freely (Fig. 3) the predicted decrease in pH makes the silica less soluble, therefore promotes the formation of a gel richer in Si relative to Zr than the SiZr0.1Na0.2 end-member allows. The choice of this single end-member to describe the activities of Si and Zr was only appropriate to describe a gel formed after a RA in a highly alkaline environment. When the pH decreases below 10, the use of this end-member (richer in Zr than Si) leads to a rapid consumption of Zr, whose activity in solution becomes very small, which causes the dramatic fall of the calculation time step. Such a result illustrates the limits of a too discretized description of the gel and the need to learn more about its chemistry.
To conclude, this study proposes an approach aiming at the geochemical modeling of the RA phenomenon. The nucleation and growth kinetics of zeolites, driving forces of glass alteration during RA, were implemented in the GRAAL model26 and based on simple formalisms resulting in an evolution of the zeolites amount as a function of the square of the time for constant growth kinetics.
The description of the gel formed during glass alteration by the GRAAL model is based on a set of end-members. The composition and solubility products of these end-members, in particular those of the passivating end-member (or PRI), were adapted in this study to account for alkaline pH alteration mechanisms. In particular, some Ca was added to the PRI to make it less soluble and allow its formation during the plateau time period preceding the RA. The modeled dissolved activities are controlled by the solubility of the gel during the plateau time period, and subsequently by the secondary phases: zeolites and C–S–H, during the RA. The stoichiometries and solubilities of these phases must, therefore, be well characterized. In particular, the model validity depends on the PRI description and the ability of the geochemical code to account for its compositional variations due to pH changes and secondary phases precipitation.
The calculations carried out show the importance of the description of Al and Ca activities in the modeling of RA and the effect of Al on the silica solubility. In this study, the proposed description of the gel was based on a minimum number of end-members and had sufficient degrees of freedom to properly describe the experimental data. For the first time, the moment when a RA occurs is described. This is an important result because this phenomenon can be observed experimentally after many years.
The predictive nature of the GRAAL model is related to the relevance of the end-members choice. In addition, better characterization of the stoichiometry of the PRI would require the experimental study of simplified glasses, without Ca or Al. Furthermore, the PRI composition must be able to vary with pH in the GRAAL model. This will require new mathematical developments of the CHESS/HYTEC code. Generally, these results are evidence of the need to have an applicable end-members set from neutrality, as it is the case in the “current” GRAAL model, to alkaline pH values such as in this exercise.
Methods
The framework of the GRAAL model26 was chosen to model RA. The GRAAL model accounts for the chemistry and solubility of the amorphous layer formed during glass alteration and assumes that this layer is passivating when Si and Al are adequately retained. We chose this model because a high Si retention is needed to achieve passivation and a strong effect of Al on the apparent silica solubility was observed experimentally.38 The transport properties of the PRI are modeled using a diffusion coefficient DPRI constant in time and space. Thus, the elemental flow through the PRI is proportional to the diffusion coefficient and inversely proportional to the PRI thickness x. Equation (10) describes the variation of the PRI thickness dx/dt as a function of the glass initial dissolution rate r0, the PRI ionic product QPRI and solubility constant KPRI:
The PRI is differentiated from the non-passivating gel layer. The composition and the stoichiometry of the gel are modeled by a set of end-members composed of Si, Al, Ca, Zr, or Na. The compositions and solubilities of the end-members are derived from an empirical approach carried out on “simple” glasses.38
In this study, equations were implemented using the CHESS/HYTEC code v.3.2.32 The thermodynamic database used was ThermoChimie v.9.41 The diffusion coefficient through the PRI, DPRI, was derived from the study of Chave et al.46 using SON68 glass. It should be noted that it has never been demonstrated that the DPRI values given by Chave et al.46 could be extrapolated beyond pH = 10. However, taking the diffusion into account or not will not impact the results of the calculations carried out for alkaline pH.
Data availability
The data that support the findings of this study are available from the corresponding author upon reasonable request.
References
Nogues, J. L., Vernaz, E. Y. & Jacquet-Francillon, N. Nuclear glass corrosion mechanisms applied to the French LWR reference glass. MRS Proc. 44, 89–98 (1984).
Grambow, B. A general rate equation for nuclear waste glass corrosion. Mater. Res. Soc. Symp. Proc. 44, 15–27 (1984).
Poinssot, C., Fillet, C. & Gras, J. M. in Geological Repository Systems for Safe Disposal of Spent Nuclear Fuels and Radioactive Waste (eds Ahn, J. & Apted, M. J.) 421–493 (Woodhead Publishing, Cambridge, 2010).
Poinssot, C. & Gin, S. Long-term behavior science: The cornerstone approach for reliably assessing the long-term performance of nuclear waste. J. Nucl. Mater. 420, 182–192 (2012).
AFNOR Normalisation. NF EN 12920+A1 November 2008—Characterization of Waste: Methodology for the Determination of the Leaching Behaviour of Waste Under Specified Conditions. X30-421 (2008).
ASTM International. Prediction of the Long-Term Behavior of Materials, Including Waste Forms, Used in Engineered Barrier Systems (EBS) for Geological Disposal of High-Level Radioactive Waste. ASTM Standard C1174 (2013).
Fournier, M., Gin, S. & Frugier, P. Resumption of nuclear glass alteration: state of the art. J. Nucl. Mater. 448, 348–363 (2014).
Aagaard, P. & Helgeson, H. C. Thermodynamic and kinetic constraints on reaction rates among minerals and aqueous solutions. I. Theoretical considerations. Am. J. Sci. 282, 237–285 (1982).
Berger, G., Claparols, C., Guy, C. & Daux, V. Dissolution rate of a basalt glass in silica-rich solutions: Implications for long-term alteration. Geochim. Cosmochim. Acta 58, 4875–4886 (1994).
de Combarieu, G., Barboux, P., Godon, N., Minet, Y. & Gin, S. Modelling the alteration of SON-68 glass with nearfield materials. Mater. Res. Soc. Symp. Proc. 932, 86–94 (2006).
Gin, S. Control of R7T7 nuclear glass alteration kinetics under saturation conditions. Mater. Res. Soc. Symp. Proc. 412, 189–196 (1995).
McGrail, B. P., Ebert, W. L., Bakel, A. J. & Peeler, D. K. Measurement of kinetic rate law parameters on a Na-Ca-Al borosilicate glass for low-activity waste. J. Nucl. Mater. 249, 175–189 (1997).
Linard, Y., Advocat, T., Jegou, C. & Richet, P. Thermochemistry of nuclear glasses: application to weathering studies. J. Non-Cryst. Solids 289, 135–143 (2001).
Linard, Y., Yamashita, I., Atake, T., Rogez, J. & Richet, P. Thermochemistry of nuclear waste glasses: an experimental determination. J. Non-Cryst. Solids 286, 200–209 (2001).
Daux, V., Crovisier, J. L., Hemond, C. & Petit, J. C. Geochemical evolution of basaltic rocks subjected to weathering: fate of the major elements, rare earth elements, and thorium. Geochim. Cosmochim. Acta 58, 4941–4954 (1994).
Bourcier, W. L., Pfeiffer, D. W., Knauss, K. G., McKeegan, K. D. & Smith, D. K. A kinetic model for borosilicate glass dissolution affinity of a surface alteration layer. In scientific basis for nuclear waste management. Mater. Res. Soc. Symp. Proc. 176, 209–216 (1990).
Gin, S., Beaudoux, X., Angéli, F., Jégou, C. & Godon, N. Effect of composition on the short-term and long-term dissolution rates of ten borosilicate glasses of increasing complexity from 3 to 30 oxides. J. Non-Cryst. Solids 358, 2559–2570 (2012).
Gin, S., Frugier, P., Jollivet, P., Bruguier, F. & Curti, E. New insight into the residual rate of borosilicate glasses: effect of S/V and glass composition. Int. J. Appl. Glass Sci. 4, 371–382 (2013).
Gin, S. et al. Long-term behavior of R7T7-type nuclear glass: current state of knowledge and outlook. Mater. Res. Soc. Symp. Proc. 824, 327–332 (2004).
Grambow, B. & Müller, R. First-order dissolution rate law and the role of surface layers in glass performance assessment. J. Nucl. Mater. 298, 112–124 (2001).
Van Iseghem, P. & Grambow, B. The long-term corrosion and modelling of two simulated Belgian reference high-level waste glasses. Mater. Res. Soc. Symp. Proc. 112, 631–639 (1988).
Strachan, D. M. & Croak, T. L. in Proceedings of the Eighth International Conference, High-Level Radioactive Waste Management 616–618 (American Nuclear Society, Grange Park, IL, 1998).
Strachan, D. M. & Croak, T. L. Compositional effects on long-term dissolution of borosilicate glass. J. Non-Cryst. Solids 272, 22–33 (2000).
Strachan, D. M. Glass dissolution: testing and modeling for long-term behavior. J. Nucl. Mater. 298, 69–77 (2001).
Jantzen, C. M., Brown, K. G. & Pickett, J. B. Durable glass for thousands of years. Int. J. Appl. Glass Sci. 1, 38–62 (2010).
Frugier, P. et al. SON68 nuclear glass dissolution kinetics: current state of knowledge and basis of the new GRAAL model. J. Nucl. Mater. 380, 8–21 (2008).
Frugier, P., Chave, T., Gin, S. & Lartigue, J. E. Application of the GRAAL model to leaching experiments with SON68 nuclear glass in initially pure water. J. Nucl. Mater. 392, 552–567 (2009).
Jollivet, P. et al. Investigation of gel porosity clogging during glass leaching. J. Non-Cryst. Solids 354, 4952–4958 (2008).
Debure, M., Frugier, P., De Windt, L. & Gin, S. Borosilicate glass alteration driven by magnesium carbonates. J. Nucl. Mater. 420, 347–361 (2012).
Debure, M., Frugier, P., De Windt, L. & Gin, S. Dolomite effect on borosilicate glass alteration. Appl. Geochem. 33, 237–251 (2013).
Godon, N., Gin, S., Rebiscoul, D. & Frugier, P. SON68 glass alteration enhanced by magnetite. Proc. Earth Planet. Sci. 7, 300–303 (2013).
van der Lee, J., De Windt, L., Lagneau, V. & Goblet, P. Module-oriented modeling of reactive transport with HYTEC. Comput. Geosci. 29, 265–275 (2003).
Fournier, M., Gin, S., Frugier, P. & Mercado-Depierre, S. Contribution of zeolite seeded experiments to the understanding of resumption of glass alteration. npjMater. Degrad. 1, 17 (2017).
Gin, S. et al. An international initiative on long-term behavior of high-level nuclear waste glass. Mater. Today 16, 243–248 (2013).
Collin, M. et al. Structure of international simple glass and properties of passivating layer formed in circumneutral pH conditions. npjMater. Degrad. 2, 4 (2018).
Gin, S. et al. The fate of silicon during glass corrosion under alkaline conditions: a mechanistic and kinetic study with the international simple glass. Geochim. Cosmochim. Acta 151, 68–85 (2015).
Chave, T., Frugier, P., Gin, S., & Ayral, A. Glass-water interphase reactivity with calcium rich solutions. Geochim. Cosmochim. Acta 75, 4125–4139 (2011).
Rajmohan, N., Frugier, P. & Gin, S. Composition effects on synthetic glass alteration mechanisms: Part 1. Experiments. Chem. Geol. 279, 106–119 (2010).
Iler, R. K. The Chemistry of Silica: Solubility, Polymerization, Colloid and Surface Properties, and Biochemistry of Silica (Wiley & Sons Inc., Chichester, 1979).
Blanc, P., Bourbon, X., Lassin, A. & Gaucher, E. C. Chemical model for cement-based materials: temperature dependence of thermodynamic functions for nanocrystalline and crystalline C–S–H phases. Cem. Concr. Res. 40, 851–866 (2010).
Giffaut, E. et al. Andra thermodynamic database for performance assessment: thermochimie. Appl. Geochem. 49, 225–236 (2014).
Schott, J., Pokrovsky, O. S. & Oelkers, E. H. The link between mineral dissolution/precipitation kinetics and solution chemistry. Rev. Miner. Geochem. 70, 207–258 (2009).
Piovesan, V. et al. Chemical durability of peraluminous glasses for nuclear waste conditioning. npjMater. Degrad. 2, 7 (2017).
Vázquez, J., Villares, P. & Jiménez-Garay, R. A theoretical method for deducing the evolution with time of the fraction crystallized and obtaining the kinetic parameters by DSC, using non-isothermal techniques. J. Alloy Compd. 257, 259–265 (1997).
Gin, S. et al. Dynamics of self-reorganization explains passivation of silicate glasses. Nat. Commun. 9, Article number: 2169 (2018).
Chave, T., Frugier, P., Ayral, A. & Gin, S. Solid state diffusion during nuclear glass residual alteration in solution. J. Nucl. Mater. 362, 466–473 (2007).
Acknowledgements
This work was funded by the French Alternative Energies and Atomic Energy Commission (CEA) and ORANO.
Author information
Authors and Affiliations
Contributions
M.F. wrote the paper. M.F. and P.F. performed the modeling. S.G. supervised the study and was involved in data interpretation.
Corresponding author
Ethics declarations
Competing interests
The authors declare no competing interests.
Additional information
Publisher's note Springer Nature remains neutral with regard to jurisdictional claims in published maps and institutional affiliations.
Electronic supplementary material
Rights and permissions
Open Access This article is licensed under a Creative Commons Attribution 4.0 International License, which permits use, sharing, adaptation, distribution and reproduction in any medium or format, as long as you give appropriate credit to the original author(s) and the source, provide a link to the Creative Commons license, and indicate if changes were made. The images or other third party material in this article are included in the article’s Creative Commons license, unless indicated otherwise in a credit line to the material. If material is not included in the article’s Creative Commons license and your intended use is not permitted by statutory regulation or exceeds the permitted use, you will need to obtain permission directly from the copyright holder. To view a copy of this license, visit http://creativecommons.org/licenses/by/4.0/.
About this article

Cite this article
Fournier, M., Frugier, P. & Gin, S. Application of GRAAL model to the resumption of International Simple Glass alteration. npj Mater Degrad 2, 21 (2018). https://doi.org/10.1038/s41529-018-0043-4
Received:
Revised:
Accepted:
Published:
DOI: https://doi.org/10.1038/s41529-018-0043-4
- Springer Nature Limited
This article is cited by
-
Aqueous alteration of silicate glass: state of knowledge and perspectives
npj Materials Degradation (2021)
-
Forty years of durability assessment of nuclear waste glass by standard methods
npj Materials Degradation (2021)
-
Review of corrosion interactions between different materials relevant to disposal of high-level nuclear waste
npj Materials Degradation (2020)
-
In situ nuclear-glass corrosion under geological repository conditions
npj Materials Degradation (2019)
-
Modeling glass corrosion with GRAAL
npj Materials Degradation (2018)