
Abstract
Background/Objectives
Fat-mass (FM) assessment since birth using valid methodologies is crucial since excessive adiposity represents a risk factor for adverse metabolic outcomes. Aim: To develop infant FM prediction equations using anthropometry and validate them against air-displacement plethysmography (ADP).
Subjects/Methods
Clinical, anthropometric (weight, length, body-mass index –BMI–, circumferences, and skinfolds), and FM (ADP) data were collected from healthy-term infants at 1 (n = 133), 3 (n = 105), and 6 (n = 101) months enrolled in the OBESO perinatal cohort (Mexico City). FM prediction models were developed in 3 steps: 1) Variable Selection (LASSO regression), 2) Model behavior evaluation (12-fold cross-validation, using Theil-Sen regressions), and 3) Final model evaluation (Bland-Altman plots, Deming regression).
Results
Relevant variables in the FM prediction models included BMI, circumferences (waist, thigh, and calf), and skinfolds (waist, triceps, subscapular, thigh, and calf). The R2 of each model was 1 M: 0.54, 3 M: 0.69, 6 M: 0.63. Predicted FM showed high correlation values (r ≥ 0.73, p < 0.001) with FM measured with ADP. There were no significant differences between predicted vs measured FM (1 M: 0.62 vs 0.6; 3 M: 1.2 vs 1.35; 6 M: 1.65 vs 1.76 kg; p > 0.05). Bias were: 1 M −0.021 (95%CI: −0.050 to 0.008), 3 M: 0.014 (95%CI: 0.090–0.195), 6 M: 0.108 (95%CI: 0.046–0.169).
Conclusion
Anthropometry-based prediction equations are inexpensive and represent a more accessible method to estimate body composition. The proposed equations are useful for evaluating FM in Mexican infants.
Introduction
Body composition in early infancy may play a central role in programming metabolic diseases later in life [1, 2]. Accurate fat mass (FM) measurement is important from birth and throughout life [3, 4]. At present, information on body composition is still needed, and there is no consensus about the optimal FM percentage (%FM) in infants. Infants with rapid FM accretion during their first six months of life are likelier to remain with higher FM at four years old [5]. It is essential to have age- and ethnic-specific data [3, 6, 7], especially during early infancy, where rapid growth with a wide inter-individual variability occurs [3, 8]. There is conflicting evidence about differences in FM between females and males in infancy; some authors have reported differences at birth [9, 10], while others have not [11, 12]. Biologically, females have higher FM, but this difference could emerge around 5 months of age [13].
Air displacement plethysmography (ADP) is a valid body composition assessment method that estimates FM [14,15,16,17]. However, ADP is expensive, not widely accessible, and is mainly used in research studies. It is not practical for clinical assessment or population purposes, where body composition is generally estimated through surrogate methods. On the other hand, anthropometry is a relatively easy, simple, and inexpensive alternative for estimating adiposity [18, 19]. Adequate training and correct technique are essential for improving the accuracy when performing anthropometric measurements [20].
Different factors have been reported to predict FM in infants, such as sex, age, weight, length, circumferences, and skinfolds [8, 21,22,23]. Weight-for-length and body-mass index (BMI) are commonly used measures of body proportionality [24, 25]. BMI has shown high correlations with adiposity in adults [26] and moderate correlations in infants [25, 27]; however, is a limited predictor of adiposity in infancy as it does not reflect the amount or distribution of FM [25, 28, 29]. Skinfolds measure subcutaneous fat and have been used predominantly in adults to estimate total body fat. Some FM prediction equations in infants include skinfold measures [8, 21, 22].
Several prediction equations for estimating FM have been developed for neonates [21, 22, 30,31,32,33,34] and older children (≥8yo) [35,36,37,38,39], leaving a gap for infants in the first months of age. Some of these equations used in infants during the first year of life have shown poor agreement [3, 8, 40] with the reference method (DXA, ADP), probably due to age and ethnic differences in the group where equations were derived [3, 8]. Lingwood [41] and Schmelzle [8] developed prediction equations for 0 to 4-month-old Caucasian infants. Schmelzle’s prediction equation shows acceptable validation based on the sum of 4 skinfolds (triceps, biceps, suprailiac, subscapular) and length. Linwood’s FM equation requires the result of a prediction equation for FFM (from bioelectrical impedance analysis) in addition to weight, sex, and length. They reported wide limits of agreement and a 19–21% error in FM estimation. There are no specific equations derived from Hispanic/Mexican infants or a validated one for this population. Considering the relevance of FM in metabolic health, practical and valid body composition methods are needed in early infancy to facilitate the inclusion of FM measurements in clinical practice.
This study aims to develop FM prediction equations using anthropometric and clinical data from Mexican infants at 1, 3, and 6 months (1 M, 3 M, 6 M) of age and to validate them using ADP as the reference method.
Materials/Subjects and methods
The OBESO (Origen Bioquímico y Epigenético del Sobrepeso y la Obesidad) perinatal cohort is a multidisciplinary study conducted at the Instituto Nacional de Perinatología in Mexico City (2017-ongoing) that aims to determine whether different maternal characteristics (lifestyle, clinical, biochemical, epigenetics) can predict neurodevelopmental and body composition alterations in the child. The cohort characteristics have been described elsewhere [42]. The Ethics and Research Internal Review Board (Project No.3300-11402-01-575-17) approved the study. Participation was voluntary, and all participants signed informed consent.
Subjects
For this secondary analysis, we included healthy-term newborns (≥37 weeks of gestation) born from healthy adult women (≥18 years, without diseases before pregnancy) with complete anthropometric and FM data. Newborns with postnatal and/or congenital diseases or born from mothers with adverse maternal outcomes (gestational diabetes or preeclampsia) were excluded. Anthropometric and FM assessments were carried out on the same day at 1 M (n = 133), 3 M (n = 105), and 6 M (n = 101). Infants’ clinical data were obtained from the cohort records. Gestational age at birth was estimated based on the ultrasound in the first trimester of pregnancy.
FM measurement (ADP)
The PEAPOD device (COSMED Inc. USA, California, USA) was used to estimate infant FM (kilograms—kgFM) at 1 M, 3 M, and 6 M. The device was calibrated before each test according to the manufacturer’s protocol. FM measurement started by placing the infant (without clothes and with a cap on the head) on the integrated scale for weight measurement. Then, the infant was placed inside the chamber to measure the body volume. Body density was computed using weight and body volume measurements. Finally, the PEAPOD’s software computed the infant’s FM based on Fomon’s equation (43). We excluded all infants’ FM values <5% [22] from the analysis, due to the fact that it is below the minimum reported values [43,44,45,46].
Anthropometric measurements
Two experienced and trained nutrition professionals performed all anthropometric measurements in duplicate, following Lohman’s methodology [47] and computed the average. Infants were measured at birth (24–72 h), 1 M, 3 M, and 6 M. Birth weight were recorded to the nearest gram using a Baby/Mommy 1582 pediatric scale (Tanita, Tokyo, Japan). The length was measured by two professionals to the nearest millimeter using a SECA 207 infantometer (SECA, Hamburg, Germany). The correct placement of the infant in the Frankfort plane was assured, and the head’s crown and the foot’s heel were in contact with the infantometer. BMI (weight/length2) was computed. Nutrition status at birth was classified according to WHO criteria [48].
Circumferences of the head, waist, left arm, and left leg were measured to the nearest millimeter using a W606PM Lufkin tape (Apex Tool Group, Maryland, USA), with the infant in a supine position, except for the head (seated position). Head circumference (HC) was measured at the highest perimeter of the head (maximum point of the occiput and the glabella). The midpoint between the acromion and the olecranon was used as a reference to measure the mid-upper arm circumference (MUAC). Thigh circumference (TC) was measured at the midpoint between the greater trochanter of the femur and the patellar border. At the widest point of the calf, we measured the calf circumference (CC). Waist circumference (WC) was measured at the level of the umbilicus after exhaling.
Skinfolds (biceps –BSF–, triceps –TSF–, subscapular –SSF–, waist-WSF-, thigh –ThSF– and calf –CSF–) were measured using a Lange caliper (Beta Technology, California, USA) holding the skin (one centimeter above the measurement site) between the index finger and thumb. BSF and TSF were measured at the midpoint of the arm, grasping the skin parallel to the long bone. SSF was taken in a diagonal fold (45°) just below the scapula’s inferior angle in the skin’s natural cleavage lines. ThSF and CSF were measured taking the same reference as its circumferences, holding the skinfold parallel to the long bone. A difference >2 mm between both measurements required a third measurement.
Statistical analysis
Models for FM estimation were developed at 1 M, 3 M, and 6 M in 3 different steps:
-
1.
Variable Selection. Analysis of variable selection considered all variables: infant sex, gestational age at birth, weight, length, circumferences (head, waist, arm, thigh, calf), and skinfolds (biceps, triceps, subscapular, waist, thigh, calf). Data were divided into quintiles to guarantee homogeneity. Eighty percent of data were randomly extracted (Fig. 1a) from each quintile to compose the training set. The Least Absolute Shrinkage Selector Operator (LASSO) was used to select relevant variables. This method identifies non-relevant variables in FM prediction by assigning their betas a zero value. Due to the high variability in the LASSO training, a series of repetitions were performed (Fig. 1b) and the beta values were saved (Fig. 1c). This process was done in 100 blocks of 12 repetitions each. Considering 1200 betas for each variable, those different from zero were selected (Fig. 1d). Relevant variables for the analysis were those that did not get a zero value in at least 500 beta values (Fig. 1e).
Fig. 1: Statistical analysis diagram showing the three-step methodology applied. 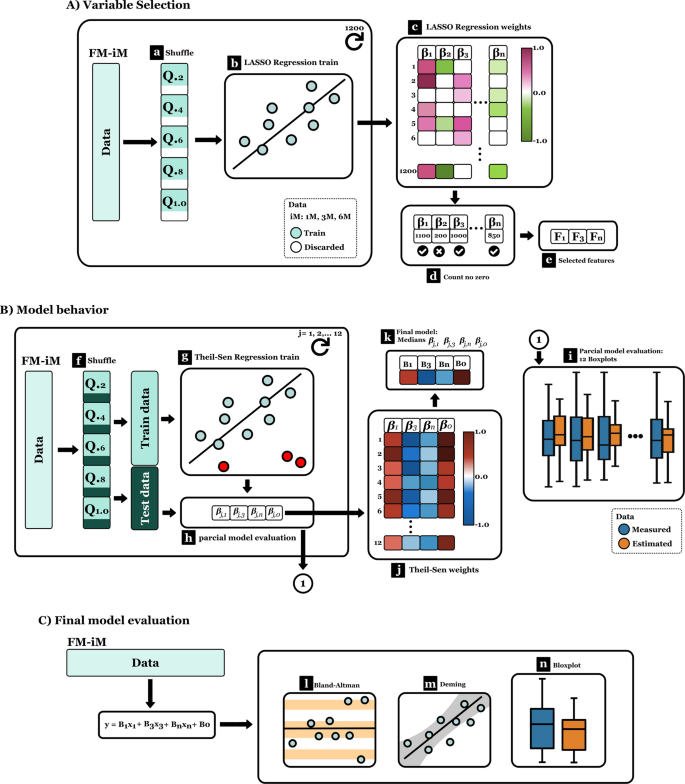
A Variable selection, B Model behavior evaluation, C Final model evaluation.
-
2.
Model behavior evaluation: A 12-fold cross-validation was performed to evaluate FM prediction in different scenarios. The same quintile strategy was used to train (70%) and test (30%) data. Models were trained using Theil-Sen regressions (Fig. 1g). A partial model was created in each fold (Fig. 1h). Test data and partial models were used to predict FM. Differences were contrasted using boxplot diagrams (Fig. 1i). Partial models were saved, and a final model was calculated based on the median of partial betas from each variable (Fig. 1j, k).
-
3.
Final model evaluation. Bland-Altman plots were generated to evaluate the concordance between predicted and measured FM (Fig. 1l). Deming regressions were used to assess the correlation between estimated and measured values; significant results generally are considered when the confidence intervals from the slope and the intercept contain 1 and 0, respectively, and the p-value from each one (One sample test against true mean value) is >0.05 (Fig. 1m). Boxplots were constructed, and the mean differences between predicted and measured FM were evaluated (Student’s t-test/U-Mann Whitney test) (Fig. 1n).

All data processing, model training, and validation was done with Python (v3.9, Python Software Foundation, USA) and scikit-learn (v1.1.1 Scikit-Learn Consortium at Inria Foundation). The software R was used to perform Bland-Altman (R v0.5.1 CRAN.r-project, Austria), Deming regression (R v1.4 CRAN.r-project, Austria), and statistical comparisons (R v4.2.1 R Foundation, Austria).
Results
From 348 participants in the OBESO cohort, we obtained data from 292 newborns (40 fetal losses, 16 lost to follow-up). We did not include data from 120 healthy infants (55 without specific data, 65 never returned for follow-up) and 33 preterm newborns. FM values < 5% from 7 infants were excluded from the analysis (1 M: n = 6, 3 M: n = 1, 6 M: n = 0). The final study sample for each visit included 133 infants (67 girls) at 1 M, 105 infants (51 girls) at 3 M, and 101 infants (53 girls) at 6 M. The mean (SD) gestational age at birth was 39.00 (1.06) weeks; for girls and boys, the mean (SD) birthweight was 2.90 (0.30) and 3.00 (0.36) kg, and length was 47.24 (1.67) and 47.78 (1.81) cm, respectively. Stunting was observed in 19.7% of newborns, 5.2% were small for gestational age, and no wasting was detected. No differences were observed by sex.
Anthropometric and body composition data
Table 1 shows infants’ descriptive anthropometric and FM data at 1 M, 3 M, and 6 M. The infants’ mean (SD) age in days at each visit was 35.18 (6.54), 93.71 (7.27), and 185.40 (6.59), respectively. No sex differences in anthropometric data were observed, except for boys who had higher weight, length, and HC in all study periods. MUAC was higher in boys at 6 M (Table 1). Regarding body composition, FM doubled from 1 M to 3 M and increased 33% from 3 M to 6 M. FM was similar between girls and boys at each visit (Table 1).
FM prediction equations
The equation at 1 M included TC, BMI, WSF, ThSF, and SSF (Table 2). No differences in predicted (0.62 kg) and measured FM (0.6 kg) were observed (p = 0.77) (Fig. 2a). Predicted values were concordant (Bias: −0.021, 95%CI: −0.050 to 0.008; Limits of Agreement (LoA): Lower: −0.352, 95%CI: −0.401 to −0.302; Upper: 0.310, 95%CI: 0.260 to 0.359). Predicted values outside of LoA were 3.01% for the lower and upper limits (Fig. 3a). Predicted FM showed a high correlation with measured FM (r = 0.734, p < 0.001) and an R2 of 0.54; intercept and slope in Deming were close to contain 0 and 1 respectively, but did not reach equivalence between methods (p < 0.001) (Fig. 3b).

At a 1 month, b 3 months, and c 6 months according to Theil–Sen regressions. In each time period the training validation models (left) and final median value from these models (right) are shown.

At a, b 1 month, c, d 3 months, and e, f 6 months. Limits of agreement and bias are shown for each Bland-Altman are shown (a, c, e). Correlation coefficient (r), the intercept and slope are presented for each Deming regression graph (b, d, f).
The equation at 3 M included WC, TC, CC, BMI, ThSF, SSF, TSF, and gestational age at birth (Table 2). No significant differences were observed between predicted and measured FM (kgFM: 1.2 kg vs 1.35 kg, respectively, p = 0.80) (Fig. 2b). The observed bias for this model was 0.014 (95%CI: 0.090 to 0.195) and LoA were: Lower: −0.377 (95%CI: −0.466 to −0.287), Upper: 0.663 (95%CI: 0.573 to 0.752). The percentage of results outside of LoA was 2.97% for lower and 1.98% for upper limits (Fig. 3c). Deming regression presented a high correlation value (r = 0.831, p < 0.001) and an R2 of 0.69; where the intercept (p = 0.029) and slope (p < 0.001) did not demonstrate equivalence between methods (p < 0.001) (Fig. 3d).
The 6 M prediction equation included TC, CC, WSF, ThSF, SSF, and gestational age at birth (Table 2). Predicted vs measured values of FM were 1.65 kg vs 1.76 kg, respectively, showing no statistical difference (p = 0.55) (Fig. 2c). In this model the bias was 0.108 (95%CI: 0.046 to 0.169) and estimated LoA values were: Lower: −0.478 (95%CI: −0.584 to −0.373), and Upper: 0.694 (95%CI: 0.589 to 0.800). The percentage of results outside of LoA was 1.08% (from lower and upper limits) (Fig. 3e). The intercept and slope in Deming regression did not contain 0 and 1, respectively (p = 0.008 and p < 0.001, respectively), but showed a high correlation value (r = 0.791, p < 0.001) and an R2 of 0.63 (Fig. 3f).
Discussion
In this work, we present anthropometry-based FM prediction equations in infants for the first 6 months of life. FM predicted with our equations showed high correlation values (r ≥ 0.73) with FM measured by Pea-Pod at 1 M, 3 M, and 6 M. Our models explained approximately 60% of FM variability at each period. This moderate determination coefficient may be related to the wide distribution of FM data in this group of infants; other published equations had shown moderate to high values [21, 22, 31, 33, 34]. We found significant bias at 3 M and 6 M, which represents a mean sub-estimation of 11.9% (95%CI: 7.5–16.2%) at 3 M and 6.54% (95%CI: 2.78–10.24%) at 6 M. It is not clear what would be an acceptable variation, without affecting their use in clinical practice. Bland-Altman analysis showed that at 3 M, 1.98% and 2.9% of infants were above or below the LoA, respectively. At 6 M, only 1.08% of infants were above and below LoA.
We decided to develop and validate our prediction formulas for Mexican infants in their first 6 months of life instead of using previously validated equations in other populations with different ages. Recent studies have shown different growth and body composition patterns among ethnicities [49]. Prediction equations have been developed for Caucasian [34], Asian [22], and German infants [8]; others have included multiethnic samples [21, 33]. Likewise, it is essential to consider the infant’s age when estimating FM. Slaughter’s equation was developed in children (8–18 years old) and validated in infants (0–4 M), showing significant bias, wide LoA, and high error in the estimation of FM [41]. Schmelzle evaluated in infants (0–4 months) the performance of five FM prediction equations developed in children (8–16 years old), which resulted in a weak correlation and a considerable systematic error overestimating FM [8].
Including different anthropometric measurements from diverse body regions in the equations improves the prediction of FM [29, 50, 51]. WC, ThSF, and CSF may improve the LoA with the reference methods when estimating FM percentage in infants (6–24 months). Many equations based their prediction on weight, length, and/or BMI [31, 33, 41, 52] and a few additional measurements. In two of the developed equations (1 M and 3 M), BMI was a predictive variable. FM prediction models for infants commonly include weight, length, circumferences and/or skinfolds (triceps, subscapular, flank, thigh). De Bruin [23] found that the best combination of anthropometric measurements to predict FM in infants were calf circumference, weight, and the sum of skinfolds (biceps, triceps, subscapular, supra iliac, quadriceps). A strength of our prediction equations is that they included total body mass indices, body circumferences, and skinfolds from the trunk area and the extremities.
The measurement of skinfolds is a well-established and more accessible method for assessing subcutaneous fat [53]. Skinfolds have shown a high degree of agreement and correlation (R2 = 0.948) with FM in term infants at birth and 2 and 4 months of age [8]. Josefson [32] found that adding one skinfold measure to weight and length improved the accuracy of estimating neonatal FM. Aris and cols [22] reported that adding SSF to the equation improved the prediction of neonatal FM. Most FM prediction models include at least one skinfold measurement, even for infants [8, 21]. Other FM estimation equations, such as Huvanandana’s [31] did not include skinfolds and reported lower R2 values. Skinfold measurement could be challenging in infants during the first months of life for several reasons, such as small body size, infants not staying still, and sensitive skin, among others. Likewise, skinfold measurements are prone to a high degree of error; hydration status, the personnel’s experience, the technique, and equipment used (caliper, site of measurement, time holding the skin) influence their measurement, affecting validity and reproducibility [54].
Our models included different body circumferences, which are easier to measure and more reproducible than skinfolds [23, 55]. Girth parameters are important as the human body is theoretically divided by cylinders [55] and have been used to establish theoretical models to predict body composition [33, 56]. WC measures central fatness and has been associated with metabolic alterations and cardiovascular risk. CC was the best single predictor of total body fat (R2 = 0.83) in the De Bruin analysis [23]. Daly-Wolfe [57] found that TC accounted for 63.0% of the variability of FM by ADP (p < 0.001) in term infants. Heymsfield hypothesizes that combining individual or multiple site circumference measurements with BMI may provide additional body composition information by constructing an individual’s “somatogram” [56].
FM is associated with different health outcomes throughout the life cycle [58]. Therefore, body composition assessment and adequate body fat classification are crucial. Considering the high accretion observed in this period [41, 59, 60], more studies are needed to define optimal FM in infants. Exclusive breastfeeding has been associated with higher FM, probably representing a programming factor in preventing obesity [60].
The strengths of our study are that we measured FM using ADP, a validated method to assess body composition in different populations of infants [14,15,16,17]. The outcome variable was absolute (kg) rather than relative (%) FM, which is a better indicator of body composition in anthropometry [22, 41]. The inter-observer coefficient values between both professionals were minimal. Equations for a specific month of life are advantageous because of accelerated growth and differences in FM accretion during the first six months [41, 59, 60]. The 12-run cross-validation allowed us to evaluate the variability of Theil-Sen regression estimations against different train/prediction groups instead of using only one validation group.
We recognize some limitations in our study. The relatively small sample size could restrict the prediction power of the models. Our models included many measurements, which can be challenging for clinicians, where some measurements, especially skinfolds, require trained personnel, adequate equipment, and standardized methodology.
Conclusion
Nutritional assessment should include body composition since early infancy because it could affect the programming of adiposity later in life. Estimating FM with anthropometry-based prediction equations is a more accesible and inexpensive alternative but should be validated for the population where they will be used. These equations are a valuable tool in research or in clinical settings for evaluating body fat in a similar population of infants, where more precise and reliable body composition methods are unavailable. Further research should focus on establishing FM cut-off points to define metabolic risk.
Data availability
The datasets generated and/or analyzed during the current study are available from the corresponding author on reasonable request.
References
Larqué E, Labayen I, Flodmark CE, Lissau I, Czernin S, Moreno LA, et al. From conception to infancy — early risk factors for childhood obesity. Nat Rev Endocrinol. 2019;15:456–78.
Sauder KA, Perng W, Palumbo MP, Bloemsma LD, Carey J, Glueck DH, et al. Fat mass accretion from birth to 5 years and metabolic homeostasis in childhood: The healthy start study. J Clin Endocrinol Metab. 2021;106:1684–91.
Cauble JS, Dewi M, Hull HR. Validity of anthropometric equations to estimate infant fat mass at birth and in early infancy. BMC Pediatr. 2017;17:88.
Wells JCK, Fewtrell MS. Is body composition important for paediatricians? Arch Dis Child. 2008;93:168–72.
van Beijsterveldt IALP, de Fluiter KS, Breij LM, van der Steen M, Hokken-Koelega ACS. Fat mass and fat-free mass track from infancy to childhood: New insights in body composition programming in early life. Obesity. 2021;29:1899–906.
Anand SS, Gupta MK, Schulze KM, Desai D, Abdalla N, Wahi G, et al. What accounts for ethnic differences in newborn skinfold thickness comparing South Asians and White Caucasians? Findings from the START and FAMILY birth cohorts. Int J Obes. 2016;40:239–44.
Bansal N, Ayoola OO, Gemmell I, Vyas A, Koudsi A, Oldroyd J, et al. Effects of early growth on blood pressure of infants of British European and South Asian origin at one year of age: the Manchester children’s growth and vascular health study. J Hypertens. 2008;26:412–8.
Schmelzle HR, Fusch C. Body fat in neonates and young infants: validation of skinfold thickness versus dual-energy X-ray absorptiometry. Am J Clin Nutr. 2002;76:1096–100.
Rodríguez G, Samper MP, Ventura P, Moreno LA, Olivares JL, Pérez-González JM. Gender differences in newborn subcutaneous fat distribution. Eur J Pediatr. 2004;163:457–61.
Fields DA, Krishnan S, Wisniewski AB. Sex differences in body composition early in life. Gend Med. 2009;6:369–75.
Andersen GS, Girma T, Wells JCK, Kæstel P, Leventi M, Hother AL, et al. Body composition from birth to 6 mo of age in Ethiopian infants: Reference data obtained by air-displacement plethysmography. Am J Clin Nutr. 2013;98:885–94.
Jain V, Kurpad AV, Kumar B, Devi S, Sreenivas V, Paul VK. Body composition of term healthy Indian newborns. Eur J Clin Nutr. 2016;70:488–93.
Davis SM, Kaar JL, Ringham BM, Hockett CW, Glueck DH, Dabelea D. Sex differences in infant body composition emerge in the first 5 months of life. J Pediatr Endocrinol Metab. 2019;32:1235–9.
Roggero P, Giannì ML, Amato O, Piemontese P, Morniroli D, Wong WW, et al. Evaluation of air-displacement plethysmography for body composition assessment in preterm infants. Pediatr Res. 2012;72:316–20.
Ellis KJ, Yao M, Shypailo RJ, Urlando A, Wong WW, Heird WC. Body-composition assessment in infancy: Air-displacement plethysmography compared with a reference 4-compartment model. Am J Clin Nutr. 2007;85:90–5.
Ma G, Yao M, Liu Y, Lin A, Zou H, Urlando A, et al. Validation of a new pediatric air-displacement plethysmograph for assessing body composition in infants. Am J Clin Nutr. 2004;79:653–60.
Urlando A, Dempster P, Aitkens S. A new air displacement plethysmograph for the measurement of body composition in infants. Pediatr Res. 2003;53:486–92.
Horan M, Gibney E, Molloy E, McAuliffe F. Methodologies to assess paediatric adiposity. Ir J Med Sci. 2015;184:53–68.
Martin-Calvo N, Moreno-Galarraga L, Martinez-Gonzalez MA. Association between body mass index, waist-to-height ratio and adiposity in children: A systematic review and meta-analysis. Nutrients. 2016;8:512.
Soylu M, Şensoy N, Doğan İ, Doğan N, Mazicioğlu MM, Öztürk A. Four-site skinfolds thickness percentiles of schoolchildren and adolescents in Turkey. Public Health Nutr. 2021;24:5414–25.
Deierlein AL, Thornton J, Hull H, Paley C, Gallagher D. An anthropometric model to estimate neonatal fat mass using air displacement plethysmography. Nutr Metab (Lond). 2012;9:21.
Aris IM, Soh SE, Tint MT, Liang S, Chinnadurai A, Saw SM, et al. Body fat in Singaporean infants: Development of body fat prediction equations in Asian newborns. Eur J Clin Nutr. 2013;67:922–7.
de Bruin NC, van Velthoven KA, Stijnen T, Juttmann RE, Degenhart HJ, Visser HK. Body fat and fat-free mass in infants: New and classic anthropometric indexes and prediction equations compared with total-body electrical conductivity. Am J Clin Nutr. 1995;61:1195–205.
Chen L, Tint M, Fortier M, Aris I, Shek LP, Tan KH, et al. Which anthropometric measures best reflect neonatal adiposity? Int J Obes (Lond). 2018;42:501–6.
Bell KA, Wagner CL, Perng W, Feldman HA, Shypailo RJ, Belfort MB. Validity of body mass index as a measure of adiposity in infancy. J Pediatr. 2018;196:168–74.e1.
Sun Q, van Dam RM, Spiegelman D, Heymsfield SB, Willett WC, Hu FB. Comparison of dual-energy X-ray absorptiometric and anthropometric measures of adiposity in relation to adiposity-related biologic factors. Am J Epidemiol. 2010;172:1442–54.
Wohlfahrt-Veje C, Tinggaard J, Winther K, Mouritsen A, Hagen CP, Mieritz MG, et al. Body fat throughout childhood in 2647 healthy Danish children: Agreement of BMI, waist circumference, skinfolds with dual X-ray absorptiometry. Eur J Clin Nutr. 2014;68:664–70.
Buksh MJ, Hegarty JE, Griffith R, Alsweiler JM, McKinlay CJ, Harding JE. Relationship between BMI and adiposity among different ethnic groups in 2-year-old New Zealand children. Br J Nutr. 2019;121:670–7.
de Cunto A, Paviotti G, Ronfani L, Travan L, Bua J, Cont G, et al. Can body mass index accurately predict adiposity in newborns? Arch Dis Child Fetal Neonatal Ed. 2014;99:F238–9.
Dauncey MJ, Gandy G, Gairdner D. Assessment of total body fat in infancy from skinfold thickness measurements. Arch Dis Child. 1977;52:223–7.
Huvanandana J, Carberry AE, Turner RM, Bek EJ, Raynes-Greenow CH, McEwan AL, et al. An anthropometric approach to characterising neonatal morbidity and body composition, using air displacement plethysmography as a criterion method. PLoS One. 2018;13:e0195193.
Josefson JL, Nodzenski M, Talbot O, Scholtens DM, Catalano P. Fat mass estimation in neonates: anthropometric models compared with air displacement plethysmography. Br J Nutr. 2019;121:285–90.
Catalano PM, Thomas AJ, Avallone DA, Amini SB. Anthropometric estimation of neonatal body composition. Am J Obstet Gynecol. 1995;173:1176–81.
Liotto N, Roggero P, Bracco B, Menis C, Morniroli D, Perrone M, et al. Can Basic Characteristics Estimate Body Composition in Early Infancy? J Pediatr Gastroenterol Nutr. 2018;66:e76–80.
Brook CG. Determination of body composition of children from skinfold measurements. Arch Dis Child. 1971;46:182–4.
Durnin JV, Rahaman MM. The assessment of the amount of fat in the human body from measurements of skinfold thickness. Br J Nutr. 1967;21:681–9.
Deurenberg P, Pieters JJ, Hautvast JG. The assessment of the body fat percentage by skinfold thickness measurements in childhood and young adolescence. Br J Nutr. 1990;63:293–303.
Johnston JL, Leong MS, Checkland EG, Zuberbuhler PC, Conger PR, Quinney HA. Body fat assessed from body density and estimated from skinfold thickness in normal children and children with cystic fibrosis. Am J Clin Nutr. 1988;48:1362–6.
Slaughter MH, Lohman TG, Boileau RA, Horswill CA, Stillman RJ, Van Loan MD, et al. Skinfold equations for estimation of body fatness in children and youth. Hum Biol. 1988;60:709–23.
Kulkarni B, Mamidi RS, Balakrishna N, Radhakrishna KV. Body composition assessment in infancy and early childhood: comparison of anthropometry with dual-energy X-ray absorptiometry in low-income group children from India. Eur J Clin Nutr. 2014;68:658–63.
Lingwood BE, Storm van Leeuwen AM, Carberry AE, Fitzgerald EC, Callaway LK, Colditz PB, et al. Prediction of fat-free mass and percentage of body fat in neonates using bioelectrical impedance analysis and anthropometric measures: validation against the PEA POD. Br J Nutr. 2012;107:1545–52.
Perichart-Perera O, González-Leyva CP, González-Ludlow I, Tolentino-Dolores M, Solis-Paredes M, Reyes-Muñoz E, et al. Vitamin D Deficiency in Mexican Pregnant Women: Is Supplementation with ≤400 IU/day Enough? Nutrients. 2020;12:2517.
Fomon SJ, Nelson SE. Body composition of the male and female reference infants. Annu Rev Nutr. 2002;22:1–17.
Andres A, Hull HR, Shankar K, Casey PH, Cleves MA, Badger TM. Longitudinal body composition of children born to mothers with normal weight, overweight, and obesity. Obesity. 2015;23:1252–8.
Breij LM, Kerkhof GF, de Lucia Rolfe E, Ong KK, Abrahamse-Berkeveld M, Acton D, et al. Longitudinal fat mass and visceral fat during the first 6 months after birth in healthy infants: support for a critical window for adiposity in early life. Pediatr Obes. 2017;12:286–94.
Fields DA, Gilchrist JM, Catalano PM, Giannì ML, Roggero PM, Mosca F. Longitudinal Body Composition Data in Exclusively Breast-Fed Infants: A Multicenter Study. Obesity. 2011;19:1887–91.
Lohman TG, Roche AF, Martorell R. Anthropometric standardization reference manual. Abridged edition. Human Kinetics Books; 1991. 90 p.
World Health Organization. WHO child growth standards: length/height-for-age, weight-for-age, weight-for-length, weight-forheight and body mass index-for-age: methods and development. Geneva; 2006. Report No.: 92 4 154693 X.
Wells JC. Toward body composition reference data for infants, children, and adolescents. Adv Nutr. 2014;5:320S–329S.
Boeke CE, Oken E, Kleinman KP, Rifas-Shiman SL, Taveras EM, Gillman MW. Correlations among adiposity measures in school-aged children. BMC Pediatr. 2013;13:99.
Eriksson B, Löf M, Forsum E. Body composition in full-term healthy infants measured with air displacement plethysmography at 1 and 12 weeks of age. Acta Paediatr. 2010;99:563–8.
Jayasinghe S, Herath MP, Beckett JM, Ahuja KDK, Byrne NM, Hills AP. Anthropometry-based prediction of body fat in infants from birth to 6 months: the Baby-bod study. Eur J Clin Nutr. 2021;75:715–23.
Andrews ET, Beattie RM, Johnson MJ. Measuring body composition in the preterm infant: Evidence base and practicalities. Clin Nutr. 2019;38:2521–30.
Nagel E, Hickey M, Teigen L, Kuchnia A, Curran K, Soumekh L, et al. Clinical application of body composition methods in premature infants. J Parenter Enteral Nutr. 2020;44:785–95.
Leppik A, Jürimäe T, Jürimäe J. Influence of anthropometric parameters on the body composition measured by bioelectrical impedance analysis or DXA in children. Acta Paediatr. 2004;93:1036–41.
Heymsfield SB, Martin-Nguyen A, Fong TM, Gallagher D, Pietrobelli A. Body circumferences: Clinical implications emerging from a new geometric model. Nutr Metab (Lond). 2008;5:24.
Daly-Wolfe KM, Jordan KC, Slater H, Beachy JC, Moyer-Mileur LJ. Mid-arm circumference is a reliable method to estimate adiposity in preterm and term infants. Pediatr Res. 2015;78:336–41.
Koontz MB, Gunzler DD, Presley L, Catalano PM. Longitudinal changes in infant body composition: Association with childhood obesity. Pediatr Obes. 2014;9:e141–4.
Ejlerskov KT, Christensen LB, Ritz C, Jensen SM, Mølgaard C, Michaelsen KF. The impact of early growth patterns and infant feeding on body composition at 3 years of age. Br J Nutr. 2015;114:316–27.
Rodríguez-Cano AM, Mier-Cabrera J, Allegre-Dávalos AL, Muñoz-Manrique C, Perichart-Perera O. Higher fat mass and fat mass accretion during the first six months of life in exclusively breastfed infants. Pediatr Res. 2020;87:588–94.
Funding
This research was funded by the Instituto Nacional de Perinatología (No. 3300-11402-01-575-17) and FOSISS-CONACyT (No. 2015-3-261661).
Author information
Authors and Affiliations
Contributions
OP-P and GE-G designed the study. OP-P formulated the research question. AMR-C, CR-H, GV-A, and AC-Z conducted the data collection examination. AMR-C and JM-C analyzed the data. OP-R carried out the main statistical analysis. AMR-C wrote the first draft of the manuscript. OP-P and GE-G supervised the quality standards of the statistical analyses. AMR-C, JM-C, CR-H, GV-A, GE-G, AC-Z, and OP-P contributed to the interpretation and discussion of the results and commented on the draft. All authors have read and approved the final manuscript.
Corresponding author
Ethics declarations
Competing interests
AMR-C and OP-P are speakers/consultants of Nestle Nutrition Institute. There is no conflict of interest of any kind in this manuscript regarding this institution. The rest of the authors declare that they have no competing interests.
Ethical approval
This study was approved by the Ethics and Research Internal Review Board (Project No. 3300-11402-01-575-17) of the Instituto Nacional de Perinatología. Participation was voluntary and all participants signed informed consent.
Additional information
Publisher’s note Springer Nature remains neutral with regard to jurisdictional claims in published maps and institutional affiliations.
Rights and permissions
Open Access This article is licensed under a Creative Commons Attribution 4.0 International License, which permits use, sharing, adaptation, distribution and reproduction in any medium or format, as long as you give appropriate credit to the original author(s) and the source, provide a link to the Creative Commons license, and indicate if changes were made. The images or other third party material in this article are included in the article’s Creative Commons license, unless indicated otherwise in a credit line to the material. If material is not included in the article’s Creative Commons license and your intended use is not permitted by statutory regulation or exceeds the permitted use, you will need to obtain permission directly from the copyright holder. To view a copy of this license, visit http://creativecommons.org/licenses/by/4.0/.
About this article

Cite this article
Rodríguez-Cano, A.M., Piña-Ramírez, O., Rodríguez-Hernández, C. et al. Development and validation of anthropometric-based fat-mass prediction equations using air displacement plethysmography in Mexican infants. Eur J Clin Nutr 77, 748–756 (2023). https://doi.org/10.1038/s41430-023-01285-9
Received:
Revised:
Accepted:
Published:
Issue Date:
DOI: https://doi.org/10.1038/s41430-023-01285-9
- Springer Nature Limited