
Abstract
Object detection is a critical and complex problem in computer vision, and deep neural networks have significantly enhanced their performance in the last decade. There are two primary types of object detectors: two stage and one stage. Two-stage detectors use a complex architecture to select regions for detection, while one-stage detectors can detect all potential regions in a single shot. When evaluating the effectiveness of an object detector, both detection accuracy and inference speed are essential considerations. Two-stage detectors usually outperform one-stage detectors in terms of detection accuracy. However, YOLO and its predecessor architectures have substantially improved detection accuracy. In some scenarios, the speed at which YOLO detectors produce inferences is more critical than detection accuracy. This study explores the performance metrics, regression formulations, and single-stage object detectors for YOLO detectors. Additionally, it briefly discusses various YOLO variations, including their design, performance, and use cases.
1 Introduction
Computer vision is a highly researched field, with efforts directed toward enabling machines to comprehend and interpret complex visual content. Object detection is a significant challenge in this domain, which involves identifying and locating objects of interest in images or videos. Deep learning, a subfield of machine learning and AI, gained prominence in the early 2000s after artificial neural networks, multilayer perceptrons, and support vector machines became popular. However, initially, deep learning faced scalability issues and high computing power requirements, which limited its adoption. Still, the availability of large datasets and powerful computers since 2006 has significantly contributed to the widespread popularity of deep learning.
Object detection is a method in computer vision that involves identifying and localizing objects within images or videos. The main objective is to precisely detect objects' existence, location, and dimensions in an image or video and label them with an appropriate class label. This technique has various applications, including but not limited to prediction of stock values[1], recognition of speech[2], object detection [3], recognition of characters [4], intrusion detection [5], detection of landslides [6], time series problems [7], classification of text [8], gene-expression [9], micro-blogs [10], data-handling [11], irregular data with fault-classification [12], captioning of text from images [13, 14], aspect-based sentiment analysis [15], and generation of captions from videos [16]. Object detection models utilize a range of algorithms and deep learning architectures to detect and classify objects in real-world scenarios.
Object detection can be done on different forms of data, i.e., images, video, and audio data. The ability of computer and software systems is to find and identify individual items within an image or scene. Object detection in the video is very similar to how it operates in images. Such a tool would enable the computer to find, recognize, and categorize things visible in the provided moving images. Object detectors can identify objects based on various sounds also.
Object detection using machine learning models refers to a set of algorithms that can automatically identify and locate objects in images or videos. These models employ feature extraction, feature selection, and classification techniques to recognize objects in visual data. To train these models, labeled images are provided where each object of interest is labeled with its corresponding class. The model then utilizes these labeled images to learn features specific to each class of objects. Several machine learning models are available for object detection, including support vector machines (SVM), decision tree, and random forests [17, 18]. These models differ in their feature extraction and classification approach and may perform differently based on the task and data at hand. Some of these models require manual feature engineering, while others can automatically learn features from the input data.
Deep learning models refer to a class of neural networks that can automatically identify and locate objects in images or videos. These models utilize multiple layers of processing units to extract complex features from the input data, which makes them efficient for object detection tasks. Some examples of models include CNNs, R-CNNs, SSDs, and you only look once models, which can recognize objects accurately and detect multiple objects in a single image or video. Training a deep learning model for object detection involves providing a large dataset of labeled images or videos to the model, with each object labeled by class and bounding-box coordinates. The model learns to identify and locate objects by minimizing a loss function that measures the difference between predicted and ground-truth labels and bounding boxes. These models are used in applications, such as autonomous driving, surveillance, and robotics.
Object detection, classification, localization, and segmentation (Fig. 1) are three crucial tasks that models aim to accomplish. Classification refers to identifying the object's category in an image or video by assigning a class label to the entire image or a specific region of interest. For example, a model can identify a car, a pedestrian, or a traffic sign in an image. Localization refers to identifying the object's location in an image or video by drawing a bounding box around it, which provides the coordinates of the object's position within the image, enabling the model to locate the object accurately. Segmentation refers to identifying the pixels that belong to an object in an image or video, enabling the model to create a pixel-level mask that outlines the object’s shape. Each segment usually shares the color texture and intensity of pixels. This technique is more precise than bounding-box localization and can be useful in scenarios where precise object boundaries are necessary, such as medical imaging or satellite imagery analysis. Object detection models typically aim to perform all three tasks simultaneously to comprehensively understand the objects in an image or video.

Image classification and object detection
The key implementation steps for object detection are:
-
1.
**Data collection and annotation**: Collect a large dataset of images or videos with labeled objects. The labels should include the class of each object and its corresponding bounding-box coordinates.
-
2.
**Pre-processing of data**: Prepare the data for training by performing tasks on the data.
-
3.
**Selecting a model**: Choose a suitable object detection model based on the specific requirements of the task, such as accuracy, speed, and computational resources.
-
4.
**Training the model**: Train the selected model on the labeled dataset using a suitable training algorithm and optimization technique. This involves adjusting the weights and biases of the model to minimize the loss function.
-
5.
**Validation and testing**: Validate the model on a separate dataset to check its performance and fine-tune the hyperparameters if necessary. Test the final model on a dataset to evaluate its generalization ability.
-
6.
**Deployment**: Deploy the trained model on a production environment or integrate it into a larger system for real-world use. This involves optimizing the model for inference speed and memory usage and ensuring its compatibility with the target hardware and software platform.
Training techniques for object detection involve the methods and strategies used to train models to accurately detect and locate objects in images or videos. Here are some common training techniques for object detection:
-
1.
Supervised learning: This is the most common training technique for object detection. Each object in the dataset is annotated with its corresponding class label and bounding-box coordinates. The model learns to detect and localize objects in the input data by optimizing a loss function.
-
2.
Transfer learning: This technique involves using a pre-trained model. This can save time and computing resources, as the model has already learned general features useful for object detection.
-
3.
Augmentation of data: It can help improve the model's generalization ability to new and unseen data.
-
4.
One-shot learning: This technique involves training the model to detect objects with only one or a few examples of each class. It can be useful in scenarios where obtaining a large labeled dataset is difficult.
-
5.
Active learning: Involves selecting the most informative and uncertain samples from a pool of unlabeled data and presenting them to a human annotator for labeling. The labeled data is then used to train the object detection model, and the process is repeated iteratively to improve the model’s performance.
-
6.
Reinforcement learning: This involves training the object detection model using a reward-based system, where the model learns to maximize a reward signal by detecting objects accurately. Reinforcement learning can be useful in scenarios where the object detection task involves complex and dynamic environments, such as robotics or autonomous driving.
A crucial component of computer vision is object detection. Using video surveillance, healthcare, and in-vehicle sensing in the business world is possible. Object detection, a crucial yet challenging problem in computer vision, has advanced considerably over the past decade. Nevertheless, this field has made much progress; each year, the research community sets a new standard for excellence. Deep neural networks and the massive processing capacity of NVIDIA graphics processing units made this possible. There have been two distinct periods in the development of object detection:
-
Up until 20th, conventional computer vision methods were in use.
-
When AlexNet triumphed in the ImageNet-Visual-Recognition-challenge-in-2012, a new era for convolutional neural networks was initiated.
In Fig. 2, the development of object detection algorithms is depicted. Early object detection methods, such as Viola-Jones, Histogram of Oriented Gradients, and Deformable Parts Model, relied on manual feature extraction from the image, such as edges, corners, and gradients, and traditional machine learning algorithms.
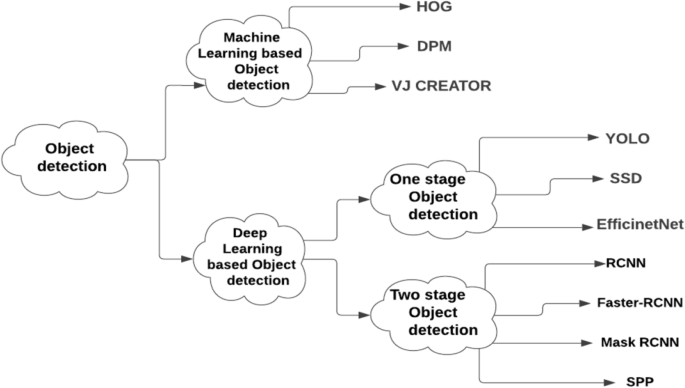
Evolution of object detection algorithms
After that, cutting edge image classification architectures were adopted as feature extractors in object detection. Both issues are connected and depend on discovering reliable high-level characteristics. Therefore, rich feature hierarchies for accurate object detection and semantic segmentation introduced R-CNN and demonstrated how we might employ the convolutional features for object detection. Recent years have seen tremendous advancement in object detection. Deep learning detection techniques can be divided into two stages.
-
Two-stage object detection: Object region proposal is the first step in a two-stage process, including object classification from region proposal and bounding-box regression. Although slower than other detectors, this detector has the highest accuracy. These object detectors include the (RCNN), (Faster-RCNN), and (Mask-RCNN) algorithms.
-
One-stage object detection eliminates the object region suggestion step and predicts the bounding box from images. These detectors are much faster than two-stage. However, they have trouble picking up minute items. Single-stage detectors are suitable for practical applications due to their quick inference speed. Single-stage detectors, such as SSD, YOLO, EfficientDet, etc. belong to the second category of detectors.
This section provides an overview of computer vision and deep learning, object detection, and related terminologies, key implementation steps, a timeline of how object detection algorithms have developed, and the review’s main contributions. Our analysis will focus on an in-depth examination of the details of the designs of YOLO and their architectural successors. The optimizations brought to each successor and the fierce competition between various two-stage object detectors.
This is the outline of the research. In Sect. 2, the study looks at a few survey papers on YOLO architectures. In Sect. 3, we will review the different YOLO versions, YOLO's design concepts, and the many pre-trained models used in them. In Sect. 4, we will review the datasets, and evaluation metrics of YOLO. Section 5 compares the analysis of YOLO versions regarding performance, architectures, and input size, providing some statistics on their relative effectiveness. Section 6 provides a detailed analysis of challenges and future research directions. Finally, we wrap up the paper with the conclusion.
2 Related Work
2.1 Prior Analysis in YOLO Algorithms
Only survey studies have been published, but they all provide a solid overview of the history of YOLO algorithms. The authors in [19] presented a review of two-stage and one-stage techniques, an architectural overview of YOLO versions, and a comparison analysis among them. In this paper [20], the author focused on an overview of the YOLO versions through public data.
2.2 Novelty and Contributions
Most evaluations and reviews cover the one-stage and two-stage object detection techniques. As far as we know, this assessment addresses single-stage techniques using certain YOLO algorithms. Here, we thoroughly analyze YOLO algorithms based on fundamental architectures, benefits and drawbacks, comparative & incremental approaches in this field, well-known datasets, outcomes, and potential future applications. The contributions include the following:
-
(a)
Highlight each stage's difficulties and significance in the object detection process.
-
(b)
Single-stage object detector's necessity and a thorough analysis of YOLO’s incremental architectural features, suggested optimization methods, and YOLOs-based applications.
-
(c)
Illustration of comparisons made between several versions of YOLO in terms of performance and outcomes, as well as discussion of potential directions for future study in single -stage object detectors.
3 Evolution of YOLO Algorithms
The basic principles, designs, and incremental methods are presented in this section over various YOLO algorithms and represented in Fig. 3.
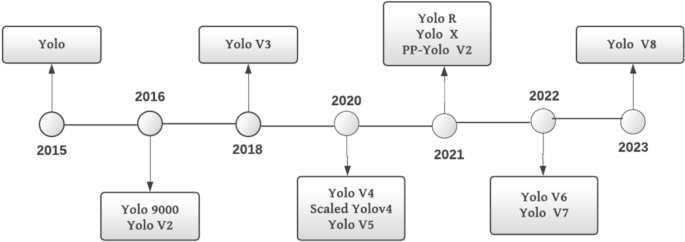
Timeline of YOLO algorithms
The basic terms related to YOLO architecture are briefed below.
CNN: Object detection is a crucial task in computer vision, and CNNs have played a significant role in advancing this field. CNNs can extract relevant features from images and use them to classify and locate objects within the image, making them well suited for this task. The Region-based CNN (R-CNN) family of algorithms is a popular approach for object detection using CNNs. These algorithms generate a set of region proposals, use a CNN to feature extraction from each proposal, and use these features to classify and refine the object's location within each proposal. Advancements in object detection using CNN’s include faster and more accurate algorithms, which have greatly improved the speed and accuracy of object detection.
Convolutional layer: DenseNet-169 is a layered architecture that is used for classification, which incorporates convolutional layers. When an input is fed into a convolutional layer, a filter is applied to activate it. This process generates a feature map that shows the relative importance of different features within the data. The activation function, ReLU, is then applied to the feature map. A dot-product operation is calculated to compute the convolutional layer output. In the DenseNet-169 architecture, a convolutional layer with dimensions d × d is applied after a square neuron layer of size \(S \times S\), resulting in an output of size \(\left( {S - d + 1} \right)\left( {S - d + 1} \right)\). Equation (1) provides a way to compute the non-linear feed to the components \(ij\), by incorporating input from all the cells in the first layer
The non-linearity of the model is assessed through Eq. (2)
Max-pooling-layer: Max pooling is a technique that involves subsampling a tensor’s entire dimension while preserving its depth. Overlapping max pooling refers to contiguous windows where the maximum value extends beyond the window boundaries. To improve convergence and generalization while avoiding scaling issues, it is recommended to include a maxpool layer. This layer can be connected to every convolution layer or a subset of them. Equation (3) illustrates how the max pooling is performed over a max-pooling layer \(M_{p}\) using a filter size of k with dimensions \(k_{x} ,k_{y} ,k_{z}\)
Global-average-pooling: The global average pooling layer, which does not have any trainable parameters, can replace the flattening layer typically placed after the last pooling layer in a convolutional neural network. This technique significantly reduces the input and prepares the network for the subsequent classification layer. In fully connected layers, overfitting is a concern that can be addressed using dropout, and the global average pooling layer can help with this. Global-average-pooling layers can perform an even more extensive form of dimensionality reduction by reducing a tensor with original dimensions of \(l \times b \times h\) to dimensions of \(1 \times 1 \times d\). For each \(h_{b}\) feature map, the global average pooling layer normalizes it to a single value by taking the mean of all \(l_{b}\) values.
Fully connected layer (FCL): A fully connected neural network layer establishes a linear connection between input and output neurons. The information learned from lower levels can then be used to classify data at the FCL. An advantage of FCL is that they can handle input data with no structural assumptions. To interpret the activation at a given layer with dimensions \(l_{1} \times l_{2} \times l_{3}\), a multilayer perceptron function (MPF) is constructed from a class probability distribution. The final layer of the MPF-based multilayer perceptron will have 1 × 1 × d output neurons, where m is the total number of layers in the network. Equation (4) is used to compute the MPF
The purpose of the fully connected structure would be to provide a probability interpretation of each category by altering the weight parameters \(w_{i,j}^{l} { }\) based on the feature map produced by the linear combination of the convolutional, non-linearity, rectification, and pooling layers.
Softmax layer: When the input is negative, the result is extremely low, but when the input is large, the result is high. The softmax function takes a vector of numbers as input, where each element can be either a positive or negative number, or zero. The softmax assessment yields a probability distribution with the normalization factor included in the denominator thanks to the normalization factor.
3.1 YOLO (V1)
On June 8th, 2015, YOLO (V1) [21] was introduced. It employs a convolutional neural network that involves two main processes: fully connected layers to predict output probabilities and coordinates, and early convolutional layers to extract image features. The model’s architecture is inspired by the googlenet framework, and was trained and evaluated on the pascal dataset 2007 and 2012 using the Darknet framework. In YOLO (V1), googlenet inception modules are replaced with (1 × 1) convolutional filters followed by (3 × 3) filters, except for the first layer which uses a (7 × 7) filter. Figure 4 illustrates that YOLO (V1) has 24 convolution layers and two fully connected layers. Only four of the convolutional or max-pooling layers have additional layers following them. This version of the method highlights the use of (1 × 1) convolution and global average pooling.
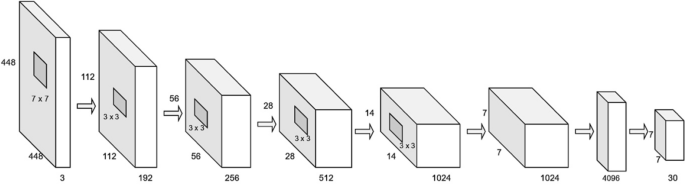
Localization and detection of objects based on YOLO architecture
The authors spent around a week training and tuning the model using the ImageNet 2012 dataset, using the top 20 layers, an average pooling layer, and a fully connected layer. In addition, four more convolutional layers and two fully connected layers with random initializations are added to the model to further fine-tune it for object detection. Large localization errors and limited recall are two key issues with this implementation of YOLO compared to two-stage object detectors.
A Fast-yolo variant of YOLO (V1) with a simpler model is suggested for quicker object recognition. There are nine convolutional layers with weaker filters in them. YOLO-lite [22] is a different version of YOLO designed specifically for nonGPU machines for real-time object recognition. The authors show that shallower networks may detect objects without explicitly requiring accelerators. Additionally, they show that the existence of batch normalization hinders shallow neural network’s object detection ability. Table 1 summarizes the features of YOLO.
3.2 YOLO (V2)
The “YOLO9000: Better, Faster, Stronger [23]” paper was released by Redmon and Farhadi in 2017 at the CVPR conference. In this study, the authors offered two cutting edge YOLO variations, YOLOv2 and YOLO9000, which were identical but had different training approaches. Over 9000 categories can be searched using YOLO (V2), the successor to YOLO (V1). Most object detection methods now in use can only classify objects into a small number of categories. This is due to a lack of tagged object data. Therefore, writers experimented with scaling the object detection task for more categories. More than 9418 types of object instances were produced due to combining the COCO dataset and ImageNet.
The architecture of YOLO (V2) is influenced by (VGG and Network in Network). As shown in Table 2, it employs the darknet-19 structure, which consists of max-pooling layers and 19 convolutional layers. In contrast to the base version, it contains a lot more functionality. For model training, various data-augmentation methods, including random crops, rotations, and many more, are used; nevertheless, this version has trouble detecting smaller objects. In addition to using pre-existing features like global average pooling and one-to-one convolution, authors also introduced fresh approaches to optimization. Table 3 summarizes the key features of YOLO (V2).
3.3 YOLO (V3)
The third iteration of YOLO (V3) was introduced in Joseph Redmon and Ali Farhadi’s paper “YOLOv3: An Incremental Improvement [24]” in 2018. Although slightly larger than the prior models, this one was still adequate in speed and accuracy. An enhanced version of YOLO (V1), YOLO (V2), and YOLO (V3) is available. In movies, live streams, or still photographs, an item is recognized in real time using the YOLOv3 algorithm. While the first version of YOLO had localization issues, the second version had difficulties detecting smaller items. Using the COCO dataset [24], the third iteration of YOLO addresses the problems above and provides a quick and easy way to find items. This version excels at handling smaller objects, but struggles with medium and large objects.
YOLO (V3) design is built on the Darkent53 frameworks. It is a network with 53 convolutional layers that employ 3 × 3 and 1 × 1 convolutional filters and certain shortcut connections. It is twice as quick as ReNet152 without sacrificing performance. Figure 5 illustrates the general architecture that underpins YOLO (V3).
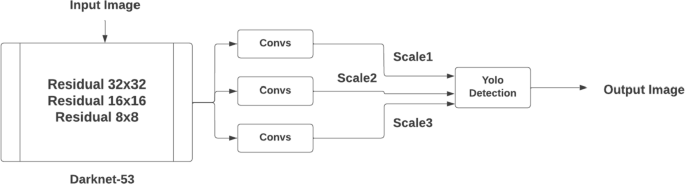
The architecture of YOLO (V3)
Feature Pyramid Network (FPN) served as an inspiration for YOLO (V 3). It uses FPN like up-sampling, skip connections, and strategies like residual blocks. Like FPN, YOLO (V3) detects objects using feature maps and (1 × 1) convolution. Three different scales of feature maps are produced by it. The input is down-sampled by 32, 16, and 8 factors. The output tensor is a (13 × 13) feature map (i.e.) converted into a (1 × 1) convolution after an initial 81 series of convolutions. Second, a 16-step stride is used to make the detection after the 94th layer. A (26 × 26) feature map is produced by adding convolutions to the 79th layer before concatenating it with the 61st layer on a 2 × up-sampling basis. Following applying an 8 stride, the detection is completed utilizing the 106th layer and a 52 × 52 feature map.
Fine grained features are extracted by concatenating down-sampled and up-sampled feature maps to detect tiny objects. Three different feature maps \(\left( { 52 \times 52, 13 \times 13 , 26 \times 26{ }} \right)\) are employed to distinguish between large, small, and medium-sized objects. Table 4 summarizes the key features of YOLO (V3).
3.4 YOLO (V4)
The YOLO (V4) architecture is the result of a series of experiments and studies that aim to improve the accuracy and speed of the convolutional neural network. The authors of the paper “YOLOv4: Optimal Speed and Accuracy of Object Detection” published in 2020. It aims to create an object detector suitable for production systems. YOLO (V4) has surpassed all previous versions in terms of both speed and accuracy. Figure 6 presents the key features of YOLO (V4).
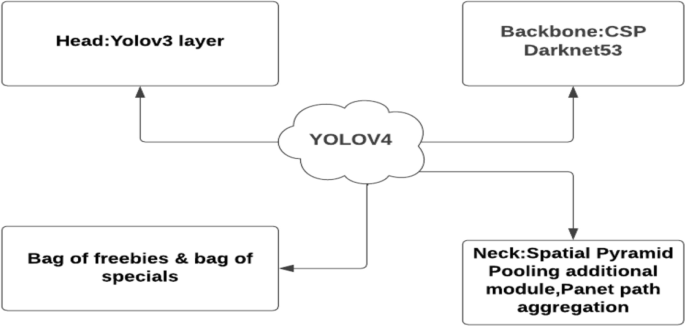
YOLO (V4) possible attributes
To create the YOLO (V4) architecture, the authors compared CSP-ResNeXt50, CSP-Darknet53, and EfficientNetB3. They chose CSP-Darknet53, which has 29 convolutional layers with 3 × 3 filters and about 27.6 M parameters, as the backbone network, because it outperforms the other architectures. Figure 7 shows that CSPNets provide rich gradient combinations at low computational cost.
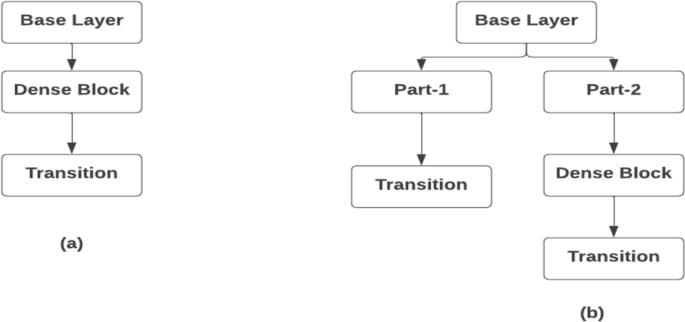
Compares CSPNet and DenseNet architecture used in YOLO (V4)
Classification in COCO [25] is accomplished with ImageNet pre-trained model. This study employed spatial pyramid pooling (SPP), a method also utilized by RCNN. Linked layers cap the input and output volumes after a CNN. In this version, input is not resized or manipulated. SPP translates CNN inputs to fully connected layer outputs. Path-Aggregation Network is a technique that uses adaptive feature-pooling and is preferred over feature-pyramid-network as a bottom–up path augmentation method. Table 5 summarizes the key features of YOLO (V4).
3.5 Scaled YOLO V4
The authors presented a paper named “SCALED-YOLOV4: SCALING CROSS STAGE PARTIAL NETWORK” [26]. By effectively extending the network’s design and scale, Scaled-YOLOv4 improves on the Google Research Brain team’s EfficientDet model.
Regarding speed and accuracy, the suggested detection network, which is based on the Cross-Stage Partial method, outperforms past benchmarks from small and large object identification models. The scaling technique makes a network’s depth, breadth, resolution, and structure susceptible to change.
On the other hand, the simplified variant known as ScaledYOLO (V4) tiny uses TensorRT optimization (batch size = 4) to reach 22.0% AP at a rate of approximately 443 FPS. The scaled YOLO (V4) is different from YOLO (V4) in the following aspects:
-
Optimized network scaling techniques are used in ScaledYOLOv4.
-
Increased network training speed with modified activations for width and height.
-
CSP connections and MISH activation are used in the Neck (Path-Aggregation Network) as part of improved network architecture.
The YOLOv4 network was trained on multiple resolutions using a single network rather than training a network for each resolution. Table 6 summarizes the key features of ScaledYOLO (V4).
3.6 PP-YOLO
In August 2020, researchers published a paper on “PP-YOLO: AN EFFECTIVE AND EFFICIENT IMPLEMENTATION OF OBJECT DETECTOR” [27]. The PP-YOLO32 object detector is constructed using YOLO (V3) architecture. Darknet and PyTorch are the two frameworks in which YOLO versions are previously implemented.
The main objective is a PP-YOLO object detector that could be immediately used in real-world application scenarios and had a fairly balanced efficacy and efficiency. And the Paddle Detection development kit's motive aligns with this objective. Combining these tips and tactics makes the detector more effective and efficient and shows how each step improves performance.
Like YOLO (V4), the PP-YOLO model also combines various existing tricks to reduce model parameters and flops while improving the detector accuracy and ensuring the detector speed remains almost the same. PP-YOLO did not examine Darknet53, ResNext50, or apply Neural-Architecture-Search to find model hyperparameters, unlike YOLO (V4). Table 7 summarizes the key features of PP-YOLO.
With all these tricks and techniques combined, PP-YOLO achieved 45.2% mAP and 72.9 FPS when trained on a volta 100 GPU with batch-size-one. This detector surpasses YOLO (V4), EfficientDet, and RetinaNet in efficiency and effectiveness. The PP-YOLO detector consists of three sections:
-
The suggested model utilized a ResNet50-vd-dc as the backbone. Fully convolutional networks serve as the object detector's backbone, helping to extract feature maps from the input image. It shares many characteristics with a trained image classification model. The final stage of the architecture in the proposed backbone model substitutes deformable convolutions for the 33convolution layer. ResNet50-vd has a significantly lower amount of parameters and flops than Darknet-53. Due to this, a man AP of 39.1 was achieved, which is better than YOLO (V3).
-
Detectionneck: The Feature Pyramid Network constructs a pyramid of features.
-
The detection head, the last step in the pipeline for detecting objects, makes predictions about the box coordinates of objects. The PP-YOLO head is identical to the YOLO (V3) head. A 33 convolution layer forecasts the output and then an 11convolution layer.
3.7 YOLO (V5)
“Glenn Jocher,” CEO of “Ultralytics,” posted YOLO (V5) on GitHub 2 months after YOLO (V4) in 2020. A collection of object detection architectures already trained on the MS-COCO dataset is available in YOLO (V5). The debut of EfficientDet and YOLOv4 came after it. The fact that this is the only YOLO object detector without a research report caused some controversy initially. Still, as soon as its capabilities were demonstrated, the controversy was disproved. The important features of YOLO (V5) are represented in Fig. 8.
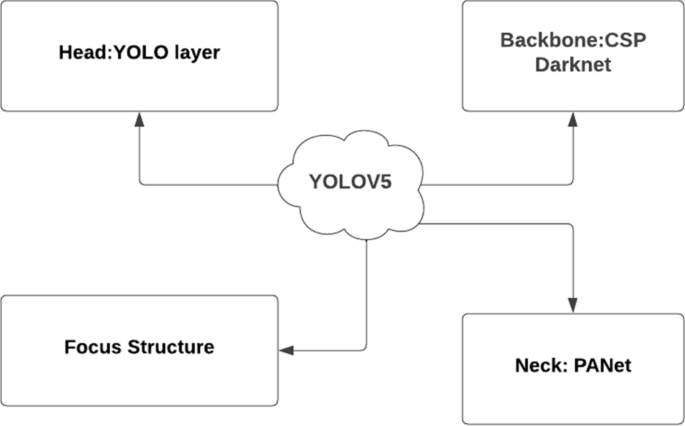
YOLO (V5) possible attributes
The most recent and cutting edge version of the YOLO object detection series, YOLO (V5), has raised the bar for object detection models with its constant effort and 58 open-source contributors. A set of compound-scaled object detection models known as YOLO (V5) was developed using the COCO dataset. This model has several useful features, such as the ability to perform test-time augmentation, model ensembling, hyperparameter evolution, and export to various formats including ONNX, CoreML, and TFLite.
Although YOLO (V5) is not a direct replacement for YOLO (V4), its structural architecture is the same. The following are its components:
-
An image, patch, or other piece of data is presented to the system as input.
-
The neural network that makes up the system's backbone is what learns everything. YOLOv5’s Cross-Stage Partial (CSP) Networks are its skeleton.
-
Neck: Feature pyramids are built using the neck. Before being transmitted for prediction, it has layers that mix and combine visual characters. PANet serves as YOLO V5’s neck.
-
Head: The head receives the output from the neck and uses it to generate predictions for both classes and boxes. The head might be either one or two stages for dense or sparse prediction.
YOLO(V5) separates processed photos into various portions after processing them using a single neural network. Using an automatic anchoring technique, each part receives its oanchor box; this increases accuracy. The entire process is automated, and if the default anchor boxes are inaccurate, a new anchor box computation is made. WitThestem analyses and forecasts the outcome. Table 8 summarizes the key features of YOLO (V5).
3.8 YOLO-X
“YOLOX: Exceeding YOLO Series in 2021 [28]” was published by the authors in 2021. Only YOLO (V1) is anchor-free, although YOLOX is too. Decoupled heads data-augmentation approaches and Sim-OTA are used to obtain state-of-the-art results. As part of CVPR 2021’s Workshop on Autonomous Driving, YOLOX came in first with their YOLOX-L model. On the MS-COCO dataset, YOLOX-Nano achieved 25.3% AP, exceeding NanoDet by 1.8% AP. The COCO accuracy increased from 44.3 to 47.3% after adding various modifications to YOLOv3. At 68.9 frames per second on Tesla V100, YOLOX-L model achieved 50.0% average precision on COCO, exceeding YOLOv5-L by 1.8% AP.
Developers and researchers can use YOLO-X, since it was implemented in the PyTorch framework. OnNX, TensorRT, and OpenVino deployment versions are also available for YOLOX. Table 9 summarizes the key features of YOLO-X.
3.9 YOLO-R
YOLO-R, unlike YOLO (V1)–YOLO (V5), has a different approach in terms of authorship, design, and model infrastructure, specifically for object identification. While YOLO stands for “You Only Look Once, “YOLO-R stands for You Only Learn One Representation”. The YOLO-R network incorporates both implicit information and explicit knowledge, which are both considered beneficial for learning based on data and input. YOLO-R is based on the co-encoding of implicit–explicit knowledge, similar to mammalian brains. It creates a unified network that can represent multiple tasks simultaneously. This is achieved through a convolutional neural network with multi-task learning, which performs three notable procedures: kernel space alignment, prediction fine-tuning, and kernel space alignment. Figure 9 demonstrates that a neural network that is already trained with explicit knowledge performs better when implicit knowledge is added.

Image represents the YOLO-R architecture
YOLO-R achieved comparable object-detection precision to Scaledyolo (V4) but increased inference speed by 88%. YOLO-R mean average precision is 3.8% greater than PP-YOLO (V2) according to the study paper. Table 10 provides a summary of YOLO-R.
3.10 PP-YOLOV2
“PP-YOLO (V2): A Practical Object Detector,” was released by Baidu in 2021 and made a significant impact in the object detection field. This project aimed to create a fast and accurate object detector, building on the success of the original PP-YOLO. The authors used a strategy of assembling different methods and procedures and emphasized ablation studies to create a well-balanced and effective detector. PP-YOLO(V2) incorporated several enhancements that significantly improved performance, increasing mean average precision from 45.9 to 49.5% on the mscoco2017 test dataset. Moreover, it achieved a high frame rate of 68.9 FPS at 640 × 640 image resolution. Unlike PP-YOLO, which used only the ResNet-50 backbone architecture, PP-YOLO(V2) used two different backbone architectures.
When the detector’s ResNet50 backbone was changed to ResNet101, PP-YOLO(V2) reached “50.3%” mAP, matching YOLO V5x's performance but outperforming it significantly of speed by approximately 16%. Table 11 summarizes the key features of PP-YOLO(V2).
3.11 YOLO (V6)
YOLO (V6) aimed to address the practical issues when working with industrial applications. Meituan Visual Intelligence Department developed the target detection framework, MT-YOLO V6 [29], in 2022.
YOLO (V6) is a single-stage object detection framework with a hardware-friendly architecture. Detection precision and inference speed is superior to YOLO (V5). The main attributes related to YOLO (V6) are shown in Fig. 10.
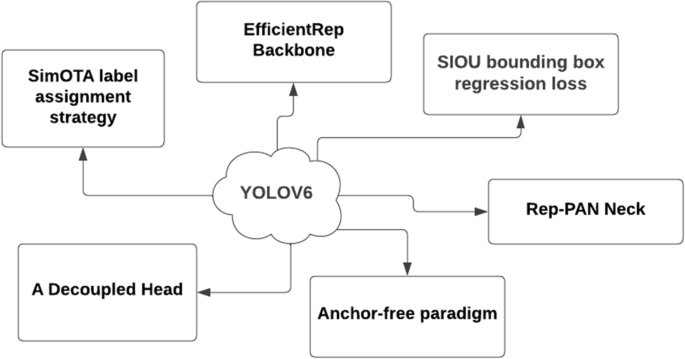
Image representing the possible attributes of YOLO (V6)
The YOLOv6 architecture is focused on the primary advancements.
EfficientRep backbone: This backbone architecture is different from YOLO V5 CSP-Backbone and has been designed to have powerful representational abilities and optimize hardware processing resources.
Rep-PAN neck: Regarding the neck design, a more effective feature fusion network was created for YOLO (V6) based on the hardware neural network design idea structure. It was designed to improve hardware consumption and better balance accuracy and speed.
A decoupled head: In YOLO (V6), the Decoupled Head structure was used, simplifying the decoupling head's design while balancing the pertinent operators’ representative capacity and the computational burden on the hardware.
Effective training strategies: The anchor-free paradigm, SimOTA-label-assignment strategy, and SIOU Boundingbox regression loss are used by YOLOv6 to increase detection accuracy.
Model deployment is made significantly simpler by YOLO (V6)’s support for a variety of deployment techniques. YOLO (V6) has 2 × faster inference time and greater mean Average Precision (mAP) than V5. Table 12 summarizes the key features of YOLO (V6).
3.12 YOLO (V7)
YOLO (V7) [30] object detector whose outstanding features transform the computer vision market in 2022. The official YOLO (V7) offers incredible speed and accuracy compared to its earlier iterations. No pre-trained weights are employed; instead, YOLO (V7) weights are trained using Microsoft’s COCO dataset. The main attributes of YOLO (V7) are shown in Fig. 11.
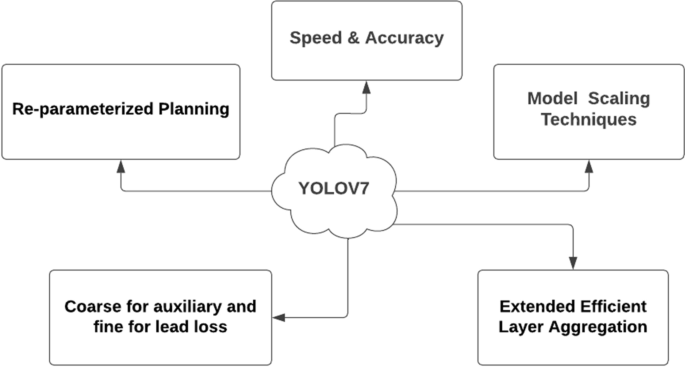
Image representing the possible attributes of YOLO (V7)
The YOLO (V7) architecture's primary focal features include the following:
“Extended-Efficient Layer Aggregation Network (E-ELAN)” mainly concentrates on the computational density and model architectural characteristics. By regulating the gradient route, ELAN's key benefit was that improving learning and convergence capabilities of deeper networks.
“Model Scaling for Concatenation-Based Models”: Concatenation-based model scaling involves scaling calculation block depth and transmission layer width.
“Re-parameterized convolution that is planned”: A RepConvN layer without identity connections can take the place of "Rep-Conv".
“Coarse for auxiliary and fine for lead loss”: This label assigner uses ground-truth labels and predictions for heads to create labels for training and auxiliary heads. Effectiveness of YOLO (V7) Object Detection.
The most recent piece in the YOLO series is YOLO (V7). Based on the prior work, this network considerably enhances the detection speed and accuracy. As part of the research, E-ELAN is recommended as the overall design and explains how cardinality expand-shuffles-merges to continuously improve the learning capacity of the network. E-ELAN can direct different groups of computational blocks to understand various features.
YOLO (V7) is still a young algorithm that is still being developed. The difficulties that the developers are trying to solve still have a lot of room for advancement. The algorithm will be very helpful in resolving many computer vision problems once it becomes widely used. Table 13 summarizes the key features of YOLO (V7).
3.13 YOLO (V8)
Ultralytics, the company behind the development of YOLO (V5), released YOLO (V8) in January 2023. While there are no published papers on this version yet, it has been noted that YOLOv8 follows the recent trend of anchor-free models, resulting in fewer box predictions and faster non-maximum suppression (NMS). Additionally, YOLO (V8) uses mosaic augmentation during training. However, it has been observed that using this technique throughout the entire training process can be harmful, so it has been disabled for the last ten epochs. YOLO (V8) is available both as a command line interface (CLI) tool and as a PIP package, and it includes various integrations for labeling, training, and deployment.
This statement implies that YOLO V8x was tested on the MS-COCO dataset using the test-dev 2017 split and achieved an average precision (AP) score of 53.9% when evaluated on images with a size of 640 pixels. In comparison, YOLO V5 achieved an AP of 50.7% on the same input size. Table 14 summarizes the key features of YOLO (V8).
4 Training Parameters, Datasets, and Evaluation Metrics
4.1 Training Parameters
Here are some common training parameters used in YOLO and its variants:
-
1.
Batch size: The batch size determines the number of images that are processed in a single forward/backward pass of the neural network during training. A larger batch size can improve training speed, but it also requires more memory.
-
2.
Learning rate: The learning rate controls how much the model’s parameters are adjusted with each update during training. A higher learning rate can lead to faster training but may also cause the model to converge on a suboptimal solution. A lower learning rate may result in slower training, but the model is more likely to converge to a better solution.
-
3.
Number of epochs: The number of epochs is the number of times the entire training dataset is processed during training. A higher number of epochs can lead to overfitting, while too few epochs can result in underfitting.
-
4.
Augmentation of data: It refers to the process of creating new training data from existing data by applying transformations, such as rotation, scaling, and flipping. Data augmentation can help improve the model's ability to generalize to new data and reduce overfitting.
-
5.
Objectness threshold: The objectness threshold is the minimum score required for an object to be considered a positive detection. Increasing the objectness threshold can reduce false positives, but it can also increase false negatives.
-
6.
Intersection over Union (IoU) threshold: The IoU threshold is used to determine whether a predicted bounding box overlaps with ground-truth bounding box. Increasing the IoU threshold can increase the accuracy of the model but can also result in fewer positive detections.
4.1.1 Multi-scale Training in YOLO
It is a technique used to enhance the performance of the YOLO model in detecting objects. Unlike traditional training, where the model is trained on a fixed input image size, multi-scale training involves training the model on multiple scales of input images. During training, input images are randomly resized to different scales, and the model is trained on batches of images with different scales. The YOLO model is updated with the gradients computed from the loss function for each image scale, allowing it to effectively detect objects at different scales. This technique is helpful in scenarios where objects of various sizes may be present.
4.1.2 Attention Mechanisms in YOLO
These mechanisms used in different computer vision tasks, including detecting objects. In YOLO, attention mechanisms can help concentrate the model's attention on specific image parts critical for object detection. One technique of utilizing attention mechanisms in YOLO is spatial attention. This involves weighting the network's feature maps based on their relevance to the detection task. Afterward, these attention weights are utilized to adjust the feature maps before the final object detection step.
Another approach is channel-wise attention, which involves weighing the feature maps based on their relevance to the detection task across channels. This can be achieved by calculating a channel-wise attention vector based on the feature map's global statistics, such as mean and variance. The channel-wise attention vector is then applied to re-weight the feature maps before the final object detection step. YOLO (V4) introduced Spatial Pyramid Pooling (SPP) attention, a new mechanism that uses a spatial pyramid pooling layer to extract multi-scale features from the image. A convolutional block is then utilized to apply various attention mechanisms to the feature maps. Overall, utilizing attention mechanisms in YOLO can enhance the model's accuracy and speed by focusing on the most relevant parts of the image.
4.1.3 Non-maximum Suppression
It is a technique used in object detection models to improve their accuracy by removing redundant bounding boxes. Since object detection models tend to generate multiple bounding boxes with varying confidence scores for the same object, NMS helps to filter out those boxes that are irrelevant or redundant, and retains only the most precise ones. Figure 12 illustrates the effect of NMS on an object detection model’s output by reducing the number of overlapping bounding boxes.

Results before and after processing through NMS
4.1.4 Activation Functions
Activation functions play a crucial role in deep learning models, including YOLO and its variants, by introducing non-linearity to the output of each layer. Here are some commonly used activation functions in YOLO and its variants:
-
1.
RectifiedLinearUnit: A simple and widely used activation function that returns the input if positive, and 0 otherwise. It is defined as \(f\left( x \right) = {\text{max}}\left( {0,x} \right)\).
-
2.
LeakyReLU: A variant of “ReLU” that adds a small slope to the negative values to avoid dying neurons. It is defined as \(f\left( x \right) = {\text{max}}\left( {ax,x} \right)\), where \(\alpha\) is a small positive constant.
-
3.
Swish: A relatively new activation function that is a smoothed version of ReLU, defined as \(f\left( x \right) = x \times {\text{sigmod}}i\left( x \right)\).
-
4.
Mish: Another novel activation function similar to Swish, but with a more gradual transition from linear to non-linear behavior. It is defined as \(f\left( x \right) = x \times {\text{tanh}}\left( {{\text{softplus}}\left( x \right)} \right)\).
-
5.
Hardswish: A faster and more memory-efficient variant of Swish that uses the thresholded linear function instead of the sigmoid function.
-
6.
Sigmoid: A commonly used activation function for binary classification tasks, defined as \(f\left( x \right) = 1/\left( {1 + e^{ - x} } \right)\).
-
7.
Softmax: A function used to convert a vector of real numbers into a probability distribution over several classes, often used in the final layer of a classification network.
-
8.
The choice of activation function can significantly impact the performance and convergence speed of a deep learning model. Different activation functions may be more suitable for different tasks and architectures, so their selection should be carefully evaluated.
4.2 Datasets
The most commonly used and recognized datasets for computer vision applications is the MS-COCO dataset, as illustrated in Fig. 13a and b. The dataset contains fewer categories, but each category has more entries. It has 91 distinct categories of items, such as people, dogs, trains, and other everyday objects. Many occurrences are observed in each category [31], along with various attributes per image.

A Sample images from the MSCOCO dataset. B Image representing Classes in MSCOCO dataset
The Pascal Visual Object Classes [32] is another dataset for objects (categorization, segmentation, and detection). From 4 classes in 2005 to 20 classes in 2007, the dataset community consistently made contributions, putting it on par with more current developments. Figure 14a and b lists the many classes of Pascal VOC. The training dataset consists of approximately 11,530 pictures, 27,540 Regions of Interest, and 6929 segmentations.

A Sample images of Pascal VOC. B Classes of Pascal VOC
Several other datasets are commonly used as follows:
-
ImageNet [33]: This dataset includes over 1 million labeled images of objects from 1000 different categories. Although ImageNet is commonly used for image classification tasks, it has also been used as a pre-training dataset for object detection models.
-
KITTI [34]: This dataset includes images and videos captured from a car driving around urban environments, with annotations for various objects, such as cars, pedestrians, and cyclists. KITTI is often used to test object detection models designed for use in autonomous vehicles.
-
Open Images [25]: This dataset includes millions of images with annotations for various objects, including some rare and unusual classes. Open Images is a large and diverse dataset for training and testing object detection models.
-
Visual Genome [35]: This dataset includes images with rich annotations describing the objects, attributes, and relationships in the scene. Visual Genome has been used to train object detection models that can reason about the context and relationships between objects in the scene.
4.3 Evaluation Metrics
Several evaluation metrics are used in YOLO and its variants for object detection. Here are some of the most commonly used ones:
-
1.
Average precision (AP): Average precision (AP) is a widely used metric in object detection that measures the model's accuracy in detecting objects at different levels of precision. It calculates the area under the precision–recall curve (AUC-PR) for different thresholds. The formula for calculating AP is shown in Eq. (5)
$${\text{AP}} = \mathop \sum \limits_{i = 1}^{n} \left( {R_{i} - R_{i - 1} } \right)P_{i} .$$(5) -
2.
Intersection over Union (IoU): Intersection over Union (IoU) is a metric that measures the overlap between the predicted bounding box and the ground-truth bounding box. It is calculated as the ratio of the intersection area to the union area of the two boxes. The formula for calculating IoU is shown in Eq. (6)
$${\text{IoU}} = \frac{{\text{ Area of Overlap}}}{{\text{Area of Union}}}.$$(6) -
3.
Mean Average Precision (mAP): Mean Average Precision (mAP) is the average of the AP’s calculated at different levels of precision. It is used to measure the model’s overall performance across all classes. The mAP can be calculated as shown in Eq. (7)
$${\text{mAP}} = \frac{1}{N}\mathop \sum \limits_{i = 1}^{N} {\text{AP}}_{i} .$$(7) -
4.
False-Positive Rate (FPR): The false Positive Rate (FPR) is the proportion of negative samples incorrectly classified as positive. It is used to measure the model's performance in detecting false positives. The formula for calculating FPR is as shown in Eq. (8)
$${\text{FPR}} = \frac{{\text{False Positive}}}{{{\text{False Positive}} + {\text{True Negative}}}}.$$(8) -
5.
Recall: The recall is the proportion of positive samples model correctly identifies. It is used to measure the model's performance in detecting true positives. The formula for calculating Recall is as shown in Eq. (9)
$${\text{Recall}} = \frac{{\text{True Positive}}}{{{\text{True Positive}} + {\text{False Negative}}}}.$$(9)
5 Comparison Analysis of YOLO in Different Aspects
In this section, a comparison analysis of different YOLO models in different aspects. The comparison analysis of YOLO V7 concerning other models is shown in Table 15.
Table 16 compares YOLO versions. The darknet is where YOLOs are implemented. As mentioned before, this version has several optimizations. Multi-scale training improves YOLO (V2) model's performance and conclusions. As we can see, YOLO(V3) introduced the FPN architecture to improve performance in detecting objects at different scales. YOLO(V4) and YOLO(V5) improved the architecture using the CSP (Cross-stage Partial) architecture. YOLO-X, on the other hand, introduced a decoupled head and backbone architecture to achieve better performance with fewer parameters. YOLO-Tiny uses a lightweight architecture with a few layers to reduce the computational cost, making it suitable for deployment on mobile devices with limited computational resources. YOLO (V6) address practical issues relating to industrial applications. YOLO (V7) offers incredible speed and accuracy.
Table 17 and Fig. 15 show YOLO version performance in terms of frames per sec (FPS), mean average precision (mAP), and average precision (AP). A single- or two-stage technique may be utilized depending on the applications and dataset.

Plot on performance results for different versions of YOLO’s
Table 18 analyzes YOLO's performance with varied input sizes. Performance results of YOLO’s concerning different parameters and flops are analyzed and shown in Table 19. Note that the AP50 (COCO) metric is the Average Precision (AP) at 50% IoU threshold on the COCO validation dataset.
Table 20 summarizes the activation function, optimizer, momentum, weight decay, and learning rate used in different versions of the YOLO object detection algorithm.
Table 21 shows that YOLOv5 has the highest mAP@0.5 on the COCO dataset among the listed algorithms, followed by PP-YOLOv2 and YOLOv3. Scaled YOLOv4, PP-YOLO, and YOLOv4 also have high mAP@0.5 scores but lower FPS compared to YOLOv5 and PP-YOLOv2. Here is a comparison Table 22 of YOLO-based algorithms on Open Images dataset and other popular object detection datasets.
Here is a comparison Table 23 of YOLO-based algorithms on KITTI dataset and other popular object detection datasets.
Here is a comparison Table 24 of YOLO-based algorithms on Visual Genome dataset and other popular object detection datasets.
Finally, Table 25 lists some YOLO-based detection and recognition applications.
The tables summarize the work regarding illustrative comparisons, empirical findings, and practical implications.
6 Challenges and Future Directions
Here are some challenges in detection of objects:
-
1.
Variability in object appearance: Objects in images can have different shapes, sizes, and colors, which makes it difficult to detect them accurately.
-
2.
Occlusion: Objects in real-world scenarios can be partially or fully occluded by other objects or environmental factors such as shadows or reflections, making it challenging for the detection model to locate them.
-
3.
Scale variation: Objects can appear at different scales in an image or video, and detecting them at all scales is computationally expensive.
-
4.
Illumination changes: Changes in lighting conditions can affect the appearance of objects, making it difficult for the model to recognize them accurately.
-
5.
Limited training data: Training an accurate object detection model requires a large labeled data, which can be time-consuming and expensive to collect and annotate.
-
6.
Computational complexity: In this model, it can be computationally expensive, requiring powerful hardware such as GPUs to train and deploy them.
Here are some potential future directions for object detection models:
-
1.
One potential development area for object detection models is improving their speed and efficiency. While many current models are highly accurate, they can be computationally expensive and time-consuming, especially in real-time applications. Future research could focus on developing more lightweight and efficient models without sacrificing too much in terms of accuracy.
-
2.
Another potential development area is improving the robustness of object detection models. Current models are often highly dependent of the data and can struggle to generalize to new and different environments. Future research could focus on developing more adaptable and flexible models that can perform well even in highly variable and dynamic environments.
-
3.
Developing more specialized and task-specific object detection models is another potential direction. While many current models are general purpose and can be used for various applications, there are often specific use cases where a more specialized model would be more effective. For example, a model designed specifically for detecting objects in medical images might be more effective than a general-purpose model.
-
4.
Finally, another potential development area is integrating object detection models with other models and technologies, such as natural language processing or augmented reality. By combining object detection with other technologies, it may be possible to create more sophisticated and powerful applications to understand and interact with the world in new and exciting ways.
7 Conclusion
This study provides a detailed understanding of the YOLO architecture and its variants, along with their strengths and weaknesses, making them a great resource for anyone interested in object detection with YOLO. This research paper presents a detailed analysis of the latest progress in object detection using YOLO and its various variants. The paper discusses the evolution of the YOLO architecture and the improvements made in each version. Also discusses various techniques used to improve the performance of YOLO and its variants, including multi-scale training, feature pyramid networks, and attention mechanisms. Additionally, the paper compares the performance of YOLO and its variants with other state-of-the-art object detection algorithms on various benchmark datasets. Overall, the paper concludes that YOLO and its variants have achieved state-of-the-art performance on various benchmark datasets regarding accuracy, speed, and memory consumption. The paper also highlights the limitations of YOLO and its variants, such as their inability to detect small objects and their sensitivity to object aspect ratios. The paper suggests that future research can address the limitations of YOLO and its variants, explore new architectures, and develop techniques to improve their accuracy and speed further. Additionally, the paper highlights the potential applications of object detection algorithms in various domains, such as autonomous driving, robotics, and surveillance systems.
Abbreviations
- AI:
-
Artificial intelligence
- ANN:
-
Artificial neural network
- AP:
-
Average precision
- CNN:
-
Convolutional neural network
- COCO:
-
Common objects in context
- CSP:
-
Cross-stage-partial
- DL:
-
Deep learning
- E-ELAN:
-
Extended-efficient layer aggregation network
- FPN:
-
Feature pyramid network
- FPS:
-
Frames per sec
- GPU:
-
Graphics processing unit
- KNN:
-
K-nearest neighbor
- MAP:
-
Mean average precision
- MISH:
-
Monotonic activation function
- ML:
-
Machine learning
- MPF:
-
Multilayer perceptron function
- PANET:
-
Path aggregation area network
- R-CNN:
-
Region-based convolutional neural network
- ReLU:
-
Rectified linear activation unit
- SSD:
-
Single-shot detector
- SVM:
-
Support vector machine
- YOLO:
-
You only look once
References
Rather, A.M., Agarwal, A., Sastry, V.N.: Recurrent neural network and a hybrid model for prediction of stock returns. Expert Syst. Appl. 42(6), 3234–3241 (2015)
Sak, H., Senior, A., Rao, K., Beaufays, F.: Fast and accurate recurrent neural network acoustic models for speech recognition. arXiv preprint arXiv:1507.06947 (2015)
Liang, M., Hu, X.: Recurrent convolutional neural network for object recognition. In: Proceedings of the IEEE Conference on Computer Vision and Pattern Recognition, Boston, MA, USA, pp. 3367–3375. (2015) https://doi.org/10.1109/CVPR.2015.7298958
Zhang, X.Y., Yin, F., Zhang, Y.M., Liu, C.L., Bengio, Y.: Drawing and recognizing Chinese characters with recurrent neural network. IEEE Trans. Pattern Anal. Mach. Intell. 40(4), 849–862 (2017)
Kim, J., Kim, J., Thu, H.L.T., Kim, H.: Long short term memory recurrent neural network classifier for intrusion detection. In: 2016 International Conference on Platform Technology and Service (PlatCon), Jeju, Korea, pp. 1–5. (2016). https://doi.org/10.1109/PlatCon.2016.7456805
Mezaal, M.R., Pradhan, B., Sameen, M.I., Shafri, M., Zulhaidi, H., Yusoff, Z.M.: Optimized neural architecture for automatic landslide detection from high resolution airborne laser scanning data. Appl Sci 7(7), 730 (2017). https://doi.org/10.3390/app7070730
Swamy, S.R., Praveen, S.P., Ahmed, S., Srinivasu, P.N., Alhumam, A.: Multi-features disease analysis based smart diagnosis for COVID-19. Comput. Syst. Sci. Eng. 45, 869–886 (2023)
Lai, S., Xu, L., Liu, K., Zhao, J.: Recurrent convolutional neural networks for text classification. In: Twenty-ninth AAAI Conference on Artificial Intelligence (2015), Austin, Texas, USA.
Quang, D., Xie, X.: DanQ: a hybrid convolutional and recurrent deep neural network for quantifying the function of DNA sequences. Nucleic Acids Res 44(11), e107–e107 (2016). https://doi.org/10.1093/nar/gkw226
Arava, K., Chaitanya, R.S.K., Sikindar, S., Praveen, S.P., Swapna, D.: Sentiment analysis using deep learning for use in recommendation systems of various public media applications. In: 2022 3rd International Conference on Electronics and Sustainable Communication Systems (ICESC), pp. 739–744. IEEE (2022)
Liao, S., Wang, J., Yu, R., Sato, K., Cheng, Z.: CNN for situations understanding based on sentiment analysis of twitter data. Procedia Comput. Sci. 111, 376–381 (2017). https://doi.org/10.1016/j.procs.2017.06.037
Wei, D., Wang, B., Lin, G., Liu, D., Dong, Z., Liu, H., Liu, Y.: Research on unstructured text data mining and fault classification based on RNN-LSTM with malfunction inspection report. Energies 10(3), 406 (2017). https://doi.org/10.3390/en10030406
Sirisha, U., Bolem, S.C.: Semantic interdisciplinary evaluation of image captioning models. Cogent Eng. 9(1), 2104333 (2022)
Sirisha, U., Bolem, S.C.: GITAAR-GIT based Abnormal Activity Recognition on UCF Crime Dataset. 2023 5th International Conference on Smart Systems and Inventive Technology (ICSSIT). IEEE (2023)
Sirisha, U., Bolem, S.C.: Aspect based sentiment & emotion analysis with ROBERTa, LSTM. Int. J. Adv. Comput. Sci. Appl. (2022). https://doi.org/10.14569/IJACSA.2022.0131189
Xu, N., Liu, A.A., Wong, Y., Zhang, Y., Nie, W., Su, Y., Kankanhalli, M.: Dual-stream recurrent neural network for video captioning. IEEE Trans. Circuits Syst. Vid Technol. 29(8), 2482–2493 (2018). https://doi.org/10.1109/TCSVT.2018.2867286
Thai, L.H., Hai, T.S., Thuy, N.T.: Image classification using support vector machine and artificial neural network. Int. J. Inform. Technol. Comput. Sci. 4(5), 32–38 (2012)
Guleria, P., Naga Srinivasu, P., Ahmed, S., Almusallam, N., Alarfaj, F.K.: XAI framework for cardiovascular disease prediction using classification techniques. Electronics 11(24), 4086 (2022). https://doi.org/10.3390/electronics11244086
Diwan, T., Anirudh, G., Tembhurne, J.V.: Object detection using YOLO: challenges, architectural successors, datasets and applications. Multimed. Tools Appl. 82, 9243–9275 (2022)
Jiang, P., Ergu, D., Liu, F., Cai, Y., Ma, B.: A review of Yolo algorithm developments. Procedia Comput. Sci. 199, 1066–1073 (2022)
Redmon, J., Divvala, S., Girshick, R., Farhadi, A.: You only look once: unified, real-time object detection. In: Proceedings of the IEEE Conference on Computer Vision and Pattern Recognition, Las Vegas, NV, USA, pp 779–788. (2016)
Huang, R., Pedoeem, J., Chen, C.: YOLO-LITE: a real-time object detection algorithm optimized for non-GPU computers. In: 2018 IEEE International Conference on Big Data (big data), Seattle, WA, USA, pp. 2503–2510. (2018). https://doi.org/10.1109/BigData.2018.8621865
Muthumari, M., Akash, V., Charan, K.P., Akhil, P., Deepak, V., Praveen, S.P.: Smart and multi-way attendance tracking system using an image-processing technique. 2022 4th International Conference on Smart Systems and Inventive Technology (ICSSIT), pp. 1805–1812. (2022). https://doi.org/10.1109/ICSSIT53264.2022.9716349
Redmon, J., Farhadi, A.: Yolov3: an incremental improvement. arXiv preprint arXiv:1804.02767 (2018)
Jiang, T., Wang, J., Cheng, Y., Zhou, J., Cai, H., Liu, X., Zhang, X.: Pp-yolov2: an improved faster version of yolov2. In: Proceedings of the 2021 3rd International Conference on Advances in Image Processing (ICAIP 2021), pp. 136–141. Association for Computing Machinery (2021).
Wang, C.Y., Bochkovskiy, A., Liao, H.Y.M.: Scaled-yolov4: Scaling cross stage partial network. In: Proceedings of the IEEE/cvf Conference on Computer Vision and Pattern Recognition, pp 13029–13038. (2021)
Long, X., Deng, K., Wang, G., Zhang, Y., Dang, Q., Gao, Y., Wen, S.: PP-YOLO: An effective and efficient implementation of object detector. arXiv preprint arXiv:2007.12099 (2020)
Ge, Z., Liu, S., Wang, F., Li, Z., Sun, J.: Yolox: Exceeding yolo series in 2021. arXiv preprint arXiv:2107.08430 (2021)
Li, C., Li, L., Jiang, H., Weng, K., Geng, Y., Li, L., Wei, X.: YOLOv6: a single-stage object detection framework for industrial applications. arXiv preprint arXiv:2209.02976 (2022)
Wang, C.Y., Bochkovskiy, A., Liao, H.Y.M.: YOLOv7: trainable bag-of-freebies sets new state-of-the-art for real-time object detectors. arXiv preprint arXiv:2207.02696 (2022)
Lin, T.Y., Maire, M., Belongie, S., Hays, J., Perona, P., Ramanan, D., Dollár, P., Zitnick, C.L. (2014) Microsoft coco: common objects in context. In: European Conference Computer Vision, pp. 740–755. arXiv:1405.0312
Everingham, M., Eslami, S.A., Van Gool, L., Williams, C.K., Winn, J., Zisserman, A.: The pascal visual object classes challenge: a retrospective. Int. J. Comput. Vis. 111(1), 98–136 (2015)
https://storage.googleapis.com/openimages/web/index.html. Accessed 3 May 2023
Mathurinache. (n.d.). Visual Genome. Retrieved from https://www.kaggle.com/datasets/mathurinache/visual-genome. Accessed 3 May 2023
Wong, A.: Yolo v5: improving real-time object detection with yolo. arXiv preprint arXiv:2011.08036 (2020)
Bochkovskiy, A., Wang, C.Y., Liao, H.Y.: YOLOv4: optimal speed and accuracy of object detection. arXiv preprint arXiv:2004.10934 (2020)
Shafiee, M.J., et al.: Fast YOLO: A fast you only look once system for real-time embedded object detection in video. arXiv preprint arXiv:1709.05943 (2017)
Wang, C.Y., Yeh, I.H., Liao, H.Y.M.: You only learn one representation: unified network for multiple tasks. arXiv preprint arXiv:2105.04206 (2021)
Huang, X., Wang, X., Lv, W., Bai, X., Long, X., Deng, K., Yoshie, O. (2021). PP-YOLOv2: a practical object detector. arXiv preprint arXiv:2104.10419 (2021)
Ultralytics LLC. (n.d.). Ultralytics documentation. https://docs.ultralytics.com/. Accessed 3 May 2023
Deng, J., Dong, W., Socher, R., Li, L. J., Li, K., Fei-Fei, L.: ImageNet: a large-scale hierarchical image database. In: 2009 IEEE Conference on Computer Vision and Pattern Recognition, pp 248–255. IEEE (2009). https://www.image-net.org/. Accessed 3 May 2023
Zhang, T., Yang, C., Chen, C.: Yolor: you only look once for real-time embedded object detection. IEEE Trans. Ind. Electron. 68(4), 3374–3384 (2021)
Ye, A., Pang, B., Jin, Y., Cui, J.: A YOLO-based neural network with VAE for intelligent garbage detection and classification. In: 2020 3rd International Conference on Algorithms Computing and Artificial Intelligence, pp. 1–7. (2020)
Zheng, Y., Ge, J.: Binocular intelligent following robot based on YOLO-LITE. In: MATEC web of conferences, vol. 336, pp. 03002. EDP sciences (2021).
Rastogi, A., Ryuh, B.S.: Teat detection algorithm: YOLO vs Haar-cascade. J. Mech. Sci. Technol. 33(4), 1869–1874 (2019)
Li, X., Liu, Y., Zhao, Z., Zhang, Y., He, L.: A deep learning approach of vehicle multitarget detection from traffic video. J. Adv. Transport. (2018). https://doi.org/10.1155/2018/7075814
Loey, M., Manogaran, G., Taha, M.H.N., Khalifa, N.E.M.: Fighting against COVID-19: a novel deep learning model based on YOLO-v2 with ResNet-50 for medical face mask detection. Sustain. Cities Soc. 65, 102600 (2021)
Zhang, X., Qiu, Z., Huang, P., Hu, J., Luo, J.: Application research of YOLO v2 combined with color identification. In: 2018 International Conference on Cyber-Enabled Distributed Computing and Knowledge Discovery (CyberC), pp. 138–1383. (2018)
Cao, Z., Liao, T., Song, W., Chen, Z., Li, C.: Detecting the shuttlecock for a badminton robot: a YOLO based approach. Expert Syst Appl 164, 113833 (2021). https://doi.org/10.1016/j.eswa.2020.113833
Chen, B., Miao, X.: Distribution line pole detection and counting based on YOLO using UAV inspection line video. J. Electr. Eng. Technol. 15(1), 441–448 (2020). https://doi.org/10.1007/s42835-019-00230-w
Mao, Q.C., Sun, H.M., Liu, Y.B., Jia, R.S.: Mini-YOLOv3: real-time object detector for embedded applications. IEEE Access 7, 133529–133538 (2019)
Li, J., Gu, J., Huang, Z., Wen, J.: Application research of improved YOLO V3 algorithm in PCB electronic component detection. Appl. Sci. 9(18), 3750 (2019)
Kannadaguli, P.: YOLO v4 based human detection system using aerial thermal imaging for UAV based surveillance applications. In: 2020 International Conference on Decision Aid Sciences and Application (DASA), pp. 1213–1219. (2020)
Jiang, J., Fu, X., Qin, R., Wang, X., Ma, Z.: High-speed lightweight ship detection algorithm based on YOLO-V4 for three-channels RGB SAR image. Remote Sens. 13(10), 1909 (2021)
Wu, D., Lv, S., Jiang, M., Song, H.: Using channel pruning-based YOLO v4 deep learning algorithm for the real-time and accurate detection of apple flowers in natural environments. Comput. Electron. Agric. 178, 105742 (2020). https://doi.org/10.1016/j.compag.2020.105742
Kasper-Eulaers, M., Hahn, N., Berger, S., Sebulonsen, T., Myrland, Ø., Kummervold, P.E.: Detecting heavy goods vehicles in rest areas in winter conditions using YOLOv5. Algorithms 14(4), 114 (2021)
Haque, M.E., Rahman, A., Junaeid, I., Hoque, S.U., Paul, M.: Rice leaf disease classification and detection using YOLOv5. arXiv preprint arXiv:2209.01579 (2022).
Mathew, M.P., Mahesh, T.Y.: Leaf-based disease detection in bell pepper plant using YOLO v5. SIViP 16(3), 841–847 (2022)
Sirisha, U., Chandana, B.S.: Privacy preserving image encryption with optimal deep transfer learning based accident severity classification model. Sensors 23(1), 519 (2023)
Patel, D., Patel, S., Patel, M.: Application of image-to-image translation in improving pedestrian detection. arXiv preprint arXiv:2209.03625 (2022)
Liang, Z., Xiao, G., Hu, J. et al. MotionTrack: rethinking the motion cue for multiple object tracking in USV videos. Vis Comput (2023). https://doi.org/10.1007/s00371-023-02983-y
Hussain, M., Al-Aqrabi, H., Munawar, M., Hill, R., Alsboui, T.: Domain feature mapping with YOLOv7 for automated edge-based pallet racking inspections. Sensors 22(18), 6927 (2022)
Aboah, A., et al.: Real-time multi-class helmet violation detection using few-shot data sampling technique and yolov8. arXiv preprint arXiv:2304.08256 (2023)
Ahmed, D., et al.: Machine vision-based crop-load estimation using YOLOv8. arXiv preprint arXiv:2304.13282 (2023)
Ju, R.-Y., Weiming, C.: Fracture detection in pediatric wrist trauma X-ray images using YOLOv8 algorithm. arXiv preprint arXiv:2304.05071 (2023)
Morris, T.: Computer Vision and Image Processing, 1st edn., pp. 1–320. Palgrave Macmillan Ltd, London (2004)
Zhang, H., Deng, Q.: Deep learning-based fossil-fuel power plant monitoring in high resolution remote sensing images: a comparative study. Remote Sens. 11(9), 1117 (2019)
Wang, C.Y., Mark Liao, H.Y., Wu, Y.H., Chen, P.Y., Hsieh, J.W., Yeh, I.H.: CSPNet: a new backbone that can enhance learning capability of CNN. In: Proceedings of the IEEE/CVF Conference on Computer Vision and Pattern Recognition Workshops, pp. 390–391. (2020)
Changyong, S., Yifan, L., Jianfei, G., Zheng, Y., Chunhua, S.: Channel-wise knowledge distillation for dense prediction. In: Proceedings of the IEEE/CVF International Conference on Computer Vision, pp. 5311–5320. (2021)
Xiaohan, D., Honghao, C., Xiangyu, Z., Kaiqi, H., Jungong, H., Guiguang, D. Reparameterizing your optimizers rather than architectures. arXiv preprint arXiv:2205.15242 (2022)
Anuradha, C., Swapna, D., Thati, B., Sree, V.N., Praveen, S.P.: Diagnosing for liver disease prediction in patients using combined machine learning models. 2022 4th International Conference on Smart Systems and Inventive Technology (ICSSIT), pp. 889–896. (2022). https://doi.org/10.1109/ICSSIT53264.2022.9716312
Srinivasu, P.N., Shafi, J., Krishna, T.B., Sujatha, C.N., Praveen, S.P., Ijaz, M.F.: Using recurrent neural networks for predicting type-2 diabetes from genomic and tabular data. Diagnostics 12(12), 3067 (2022). https://doi.org/10.3390/diagnostics12123067
Gao, H., Zhuang, L., Van Der Laurens, M., Kilian, Q.W.: Densely connected convolutional networks. In: Proceedings of the IEEE/CVF Conference on Computer Vision and Pattern Recognition (CVPR), pp. 4700–4708. (2017)
Xiaohan, D., Xiangyu, Z., Ningning, M., Jungong, H., Guiguang, D., Jian, S.: RepVGG: making VGG-style convnets great again. In: Proceedings of the IEEE/CVF Conference on Computer Vision and Pattern Recognition (CVPR), pp. 13733–13742. (2021).
Vidushi Meel.: https://viso.ai/deep-learning/yolor/. Accessed 3 May 2023
Funding
The authors declare that no funds, grants, or other supports were received during the preparation of this manuscript.
Author information
Authors and Affiliations
Contributions
All the authors have designed the study, developed the methodology, performed the analysis, and written the manuscript. All authors have contributed equally to this work.
Corresponding authors
Ethics declarations
Conflict of Interest
The authors have no relevant financial or non-financial interests to disclose.
Ethical Approval
Not applicable as the study did not require ethical approval.
Additional information
Publisher's Note
Springer Nature remains neutral with regard to jurisdictional claims in published maps and institutional affiliations.
Rights and permissions
Open Access This article is licensed under a Creative Commons Attribution 4.0 International License, which permits use, sharing, adaptation, distribution and reproduction in any medium or format, as long as you give appropriate credit to the original author(s) and the source, provide a link to the Creative Commons licence, and indicate if changes were made. The images or other third party material in this article are included in the article's Creative Commons licence, unless indicated otherwise in a credit line to the material. If material is not included in the article's Creative Commons licence and your intended use is not permitted by statutory regulation or exceeds the permitted use, you will need to obtain permission directly from the copyright holder. To view a copy of this licence, visit http://creativecommons.org/licenses/by/4.0/.
About this article

Cite this article
Sirisha, U., Praveen, S.P., Srinivasu, P.N. et al. Statistical Analysis of Design Aspects of Various YOLO-Based Deep Learning Models for Object Detection. Int J Comput Intell Syst 16, 126 (2023). https://doi.org/10.1007/s44196-023-00302-w
Received:
Accepted:
Published:
DOI: https://doi.org/10.1007/s44196-023-00302-w