
Abstract
Background
Uncertain ascertainment of events in clinical trials has been noted for decades. To correct possible bias, Clinical Endpoint Committees (CECs) have been employed as a critical element of trials to ensure consistent and high-quality endpoint evaluation, especially for cardiovascular endpoints. However, the efficiency and usefulness of adjudication have been debated.
Methods
The multiple imputation (MI) method was proposed to incorporate endpoint event uncertainty. In a simulation conducted to explain this methodology, the dichotomous outcome was imputed each time with subject-specific event probabilities. As the final step, the desired analysis was conducted based on all imputed data. This proposed method was further applied to real trial data from PARADIGM-HF.
Results
Compared with the conventional Cox model with adjudicated events only, the Cox MI method had higher power, even with a small number of uncertain events. It yielded more robust inferences regarding treatment effects and required a smaller sample size to achieve the same power.
Conclusions
Instead of using dichotomous endpoint data, the MI method enables incorporation of event uncertainty and eliminates the need for categorizing endpoint events. In future trials, assigning a probability of event occurrence for each event may be preferable to a CEC assigning a dichotomous outcome. Considerable resources could be saved if endpoint events can be identified more simply and in a manner that maintains study power.

References
Hicks KA, Mahaffey KW, Mehran R, et al. 2017 Cardiovascular and stroke endpoint definitions for clinical trials. Circulation. 2018;137(9):961–72.
Farb A, Zuckerman BD. Clinical event adjudication in cardiovascular device trials: a Food and Drug Administration perspective. Am Heart J. 2017;191:62–4.
Seltzer JH, Turner JR, Geiger MJ, et al. Centralized adjudication of cardiovascular end points in cardiovascular and noncardiovascular pharmacologic trials: a report from the Cardiac Safety Research Consortium. Am Heart J. 2015;169(2):197–204.
Sepehrvand N, Zheng Y, Armstrong PW, et al. Alignment of site versus adjudication committee-based diagnosis with patient outcomes: insights from the Providing Rapid Out of Hospital Acute Cardiovascular Treatment 3 trial. Clin Trials. 2016;13(2):140–8.
Granger CB, Vogel V, Cummings SR, et al. Do we need to adjudicate major clinical events? Clin Trials. 2008;5(1):56–60.
Mahaffey KW, Held C, Wojdyla DM, et al. Ticagrelor effects on myocardial infarction and the impact of event adjudication in the PLATO (Platelet Inhibition and Patient Outcomes) trial. J Am Coll Cardiol. 2014;63(15):1493–9.
Pogue J, Walter SD, Yusuf S. Evaluating the benefit of event adjudication of cardiovascular outcomes in large simple RCTs. Clin Trials. 2009;6(3):239–51.
Mahaffey KW, Harrington RA, Akkerhuis M, et al. Disagreements between central clinical events committee and site investigator assessments of myocardial infarction endpoints in an international clinical trial: review of the PURSUIT study. Curr Control Trials Cardiovasc Med. 2001;2(4):187–94.
Morrow DA, Wiviott SD. Classification of deaths in cardiovascular outcomes trials. Circulation. 2019;139(7):874–6.
Claes H. When do we need clinical endpoint adjudication in clinical trials? Ups J Med Sci. 2019;124(1):42–5.
Magder LS, Hughes JP. Logistic regression when the outcome is measured with uncertainty. Am J Epidemiol. 1997;146(2):195–203.
Neuhaus JM. Analysis of clustered and longitudinal binary data subject to response misclassification. Biometrics. 2002;58(3):675–83.
Paulino CD, Soares P, Neuhaus J. Binomial regression with misclassification. Biometrics. 2003;59(3):670–5.
Racine-Poon AH, Hoel DG. Nonparametric estimation of the survival function when cause of death is uncertain. Biometrics. 1984;40(4):1151–8.
Richardson BA. Product limit estimation for infectious disease data when the diagnostic test for the outcome is measured with uncertainty. Biostatistics. 2000;1(3):341–54.
Snapinn SM. Survival analysis with uncertain endpoints. Biometrics. 1998;54(1):209–18.
Meier AS, Richardson BA, Hughes JP. Discrete proportional hazards models for mismeasured outcomes. Biometrics. 2003;59(4):947–54.
Cook TD. Adjusting survival analysis for the presence of unadjudicated study events. Control Clin Trials. 2000;21(3):208–22.
Cook TD, Kosorok MR. Analysis of time-to-event data with incomplete event adjudication. J Am Stat Assoc. 2004;99(468):1140–52.
Efron B. Missing data, imputation, and the bootstrap. J Am Stat Assoc. 1994;89(426):463–75.
Rubin DB. Multiple Imputation for Nonresponse in Surveys. New York: Wiley; 1987.
Little RJA, Rubin DB. Statistical Analysis with Missing Data. New York: Wiley; 1987.
Jakobsen JC, Gluud C, Wetterslev J, Winkel P. When and how should multiple imputation be used for handling missing data in randomised clinical trials - a practical guide with flowcharts. BMC Med Res Methodol. 2017;17(1):1–10.
Taylor JMG, Murray S, Hsu C-H. Survival estimation and testing via multiple imputation. Stat Probab Lett. 2002;58(3):221–32.
White IR, Royston P. Imputing missing covariate values for the Cox model. Stat Med. 2009;28(15):1982–98.
Keogh RH, Morris TP. Multiple imputation in Cox regression when there are time-varying effects of covariates. Stat Med. 2018;37(25):3661–78.
Spratt M, Carpenter J, Sterne JA, et al. Strategies for multiple imputation in longitudinal studies. Am J Epidemiol. 2010;172(4):478–87.
Lu K, Jiang L, Tsiatis AA. Multiple imputation approaches for the analysis of dichotomized responses in longitudinal studies with missing data. Biometrics. 2010;66(4):1202–8.
McMurray JJ, Packer M, Desai AS, et al. Angiotensin-neprilysin inhibition versus enalapril in heart failure. N Engl J Med. 2014;371(11):993–1004.
RStudio Team. RStudio: Integrated Development for R; 2016. Boston, MA: RStudio, Inc. http://www.rstudio.com/. Accessed 4 Aug 2020.
Chen Y. SurvMI: Multiple Imputation Method in Survival Analysis. R package version 0.1.0; 2020. https://CRAN.R-project.org/package=SurvMI.
Petersen JL, Haque G, Hellkamp AS, et al. Comparing classifications of death in the mode selection trial: agreement and disagreement among site investigators and a clinical events committee. Contemp Clin Trials. 2006;27(3):260–8.
Leonardi S, Franzone A, Piccolo R, et al. Rationale and design of a prospective substudy of clinical endpoint adjudication processes within an investigator-reported randomised controlled trial in patients with coronary artery disease: the GLOBAL LEADERS Adjudication Sub-StudY (GLASSY). BMJ Open. 2019;9(3):026053.
Acknowledgements
The authors thank J. Rick Turner, PhD, DSc, of DRT Strategies Inc. for editorial assistance.
Funding
None reported.
Author information
Authors and Affiliations
Contributions
YC, JL: Substantial contributions to the conception or design of the work, or the acquisition, analysis, or interpretation of data for the work. YC, JL, HMJH, NS: Drafting the work or revising it critically for important intellectual content. YC, JL, HMJH, NS: Final approval of the version to be published. YC, JL: Agreement to be accountable for all aspects of the work in ensuring that questions related to the work.
Corresponding author
Ethics declarations
Conflict of interest
All authors declare that they have no conflict of interest.
Additional information
Disclaimer This article reflects the views of the authors and should not be construed to represent the views or policies of the U.S. Food and Drug Administration.
Appendices
Appendix
Probability Simulation
Because we did not have experts (i.e., cardiologists, stroke/vascular neurologists) weighing in to assign appropriate event probabilities in this study, we evaluated multiple imputation methods. First, note that there are two types of uncertain events: Previous positively adjudicated events may not be true events (false-positive), and negatively adjudicated events may be true events (false-negative). In this study, we want to impute events in a conservative way; that is, believe that all true events have been correctly captured. However, some potential events may have been neglected because they were less discrete. As a result, only false-negative events were targeted in this application. This ensures that a greater number of events contributes to the analysis than is adjudicated after the imputation.
We proposed three methods of assigning event probability to the 339 potential false–negative events (161 in the enalapril group vs. 178 in the LCZ696 treatment group) in PARADIGM-HF:
-
1.
Regard the adjudicated hazard as the true hazard. This is the currently implemented method. To achieve this, a uniform (0,1) random number will be generated as the first step, and then assigned to potential events in the enalapril group as an event probability or divided by 1.35 (in other words, a random number generated from uniform (0, 1/1.35)) for potential events in the treatment group. The value of 1.35 was calculated from the event rate and the number of potential events for both groups. The ultimate goal is to maintain a hazard identical to the adjudicated hazard. However, the MI method would have a smaller standard deviation, resulting in a smaller p value.
-
2.
Assume that the probability for both groups follows a uniform (0,1) distribution. It would then be expected that 161 × 0.5 = 80.5 events would be added to the enalapril group, and 178 × 0.5 = 89 events to the treatment group. This method did not impose any assumption on the event probabilities of each group (except that probabilities should be positive numbers between 0 and 1). This method is suitable for cases in which the placebo group has more potential events, each of which has the same event probability. We observed a smaller standard error with an increased hazard ratio. The resultant p value was greater than for the adjudicated case.
-
3.
The opinions of each adjudicator were documented for all submitted events and were available for analysis. Information on the adjudication process can be used to derive event probability if other expertise is not available. This is the most clinically informative method; however, it requires adaptation for trials with different adjudication settings. In PARADIGM-HF, there are two adjudicators in the committee. If they failed to reach agreement in the first round of independent review, the case would be moved to committee review. The decision of the committee would be taken as the final decision. Briefly, the event probability can be calculated as the number of positive adjudicated responses over the total number of non-missing responses. A certain amount of data cleaning was required before applying this method to PARADIGM-HF data. A flowchart of the adjudication process in PARADIGM-HF, which was adapted from the CEC Manual of Operations, is presented in Fig. 2.
Fig. 2 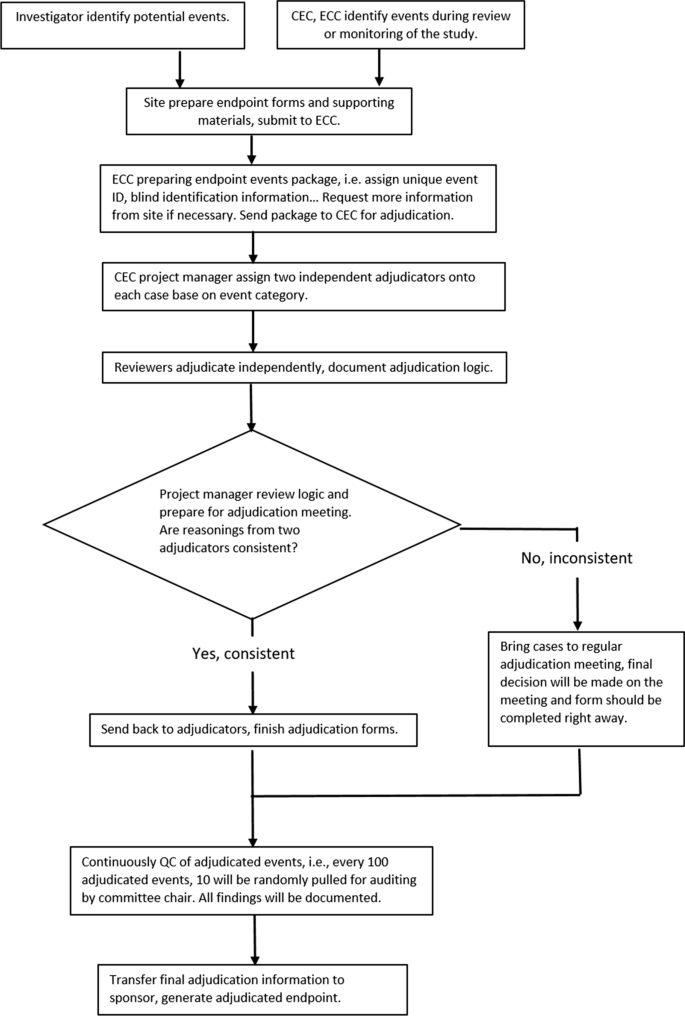
Flowchart of the PARADIGM-HF Trial Adjudication Process. CEC Clinical Endpoint Center, ECC Endpoint Coordinating Center.

Finally, Table 5 summarizes the MI results with these three probability rules. In all cases, we observed a smaller standard error for the estimated hazard ratio. However, the hazard ratios estimated by methods 2 (uniform) and 3 (informative) may not be the same as those for adjudicated events. The p values determined by Wald test are consequently larger than those for adjudicated events. Method 1 maintains the hazard ratio constant as adjudicated case while producing a smaller standard error, which explains the benefits of using MI; method 1 was employed in the paper.
Our primary goal was to demonstrate the benefits of the MI method without having clinical experts reassign the event probabilities. As shown in Table 5, different imputation methods yielded different hazard ratios; therefore, the resulting inferences could be different. Selecting one of these methods requires clinical insight; each method may be further tailored to fit the actual circumstance. Ideally, the real event probability assigned by clinical experts, on the basis of the event itself, makes the most sense.
Simulation
Data were simulated from a hypothetical randomized, two-arm, placebo-controlled clinical trial with equal allocation where the true hazard ratio (\(\beta_{0}\)) is pre-specified. Our interest is the time to the first event. The recruitment period is set as one year, and subjects enter the study in a uniform manner. The maximum duration of follow-up is four years. The event rate in the control arm is set to be approximately 10% per year. By using an exponential distribution with a 10% event rate per year, we could simulate the control arm event time: \(t_{0i} \sim \exp \left( {\frac{0.1}{365}} \right), i = 1, \ldots ,N_{0}.\) If the event time exceeds the cutoff time, the subject is censored. By setting the true hazard ratio event rate for the treatment group as \(t_{1i} \sim \exp \left( {\frac{0.1}{365} \times \beta_{0} } \right), i = 1, \ldots ,N_{1},\) we could also generate the corresponding event time and censoring indicator.
The detailed process of the simulation is as follows:
-
1.
By using an exponential distribution and enrollment period, and the follow-up time given above, we could simulate a dataset with N (N/2 subjects in each group) subjects with “certain” events. The Cox model and the Cox MI model based on these certain events estimate the true hazard in an unbiased manner.
-
2.
Create a pool of potential events. Following the same logic as above, the pool is designed to be sufficiently large; for example, 10,000 (5000 for each group) records.
-
3.
Define how many false-negative (FN) and false-positive (FP) events we wish to blend with those pre-generated certain events. For example, if we wish to have 10% FN and 10% FP, N = 500 means there will be 50 FN events and 50 FP events.
-
4.
Draw from the event pool without replacement generated in step 2 until a required number of events is obtained. If there are known to be 50 FN events, this means that 50 positive events are wrongly recognized as negative. For this specific example, the program draws until 50 positive events were obtained. A sample with more than 50 records is needed to assume 50 positive records. The empirical event rates serve as event probabilities per arm.
-
5.
Repeat the above to generate FP records. Also, assign event probabilities to these potential events.
-
6.
Samples generated from steps 4 and 5 form the “uncertain” events, and we place them together with cases adjudicated with certainty. This ensures that there are 100 “wrong” records in the final dataset. Certain events will have event probabilities equal to 0 or 1, depending on the event indicators.
-
7.
Fit the Cox model and the Cox MI model with twisted data. The Cox model with only cases adjudicated with certainty ignores events that cannot be adjudicated with 100% certainty; in other words, only certain events contribute as endpoints. During each imputation, the event indicator is simulated with event probabilities by \({\text{Bernoulli}} \left( {p_{i} } \right)\). Note that \(p_{i}\) is between 0 and 1 only for uncertain events, imputation would not influence the certain event indicators.
-
8.
Compare the results from the simple Cox model and the Cox model with MI implemented from batches of simulation. The Cox model estimates the hazard ratio in a biased manner because of the added FN and FP events. By contrast, MI could recover lost information with event probabilities that were correctly assigned.
Below is an example with real numbers:
-
1.
Generate 500 subjects from the underlying two exponential distributions with true betas. After data were simulated, a 2 × 2 table was created. For all of the 2 × 2 tables below, columns are events, and rows are treatment groups. There are 250 subjects in each group.
Event (Positive)
Censored (Negative)
Total
Enalapril
72
178
250
LCZ696
69
181
250
Total
141
359
500
-
2.
To have 50 FN, 64 samples are needed from the event pool. Based on the sampling results, the event probability is 27/35 = 0.77 for the placebo group and 23/29 = 0.79 for the LCZ696 treatment group. Because the sample size is small, the treatment group has a slightly larger event probability. Now these 64 subjects have an event probability of between 0 and 1. The event indicators of all of these subjects were overwritten to 0 (no event), so there are 50 FN among these 64 subjects.
Event (Positive)
Censored (Negative)
Total
Enalapril
8
27
35
LCZ696
6
23
29
Total
14
50
64
-
3.
Do the same thing for FP. To have 50 positive events, a sample of 243 events is needed because of the low event rate. Similarly, the event probability is 113/139 = 0.81 for the placebo group and 80/104 = 0.77 for the treatment group. When we rewrite all event indicators in this sample to 1 (event), 50 FP events are guaranteed.
Event (Positive)
Censored (Negative)
Total
Enalapril
26
113
139
LCZ696
24
80
104
Total
50
193
243
-
4.
Now, add these events to 500 certain events, resulting in 500 + 64 + 243 = 807 events in total. From step 2 and step 3 we know that 100/807 events are incorrectly adjudicated, and 307/807 subjects have event probabilities between 0 and 1. Of the remaining 500 events, 141 events have event probabilities = 0 and 359 events have event probabilities = 1 because they are certain events.
In the simulation table (Table 1 in the main paper), the number of certain events varies as 500, 1000, or 5000, the percentage of FN/FP = (0%, 5%, 10%, 20%, 30%), and we selected combination of FN and FP as ((5%, 5%), (10%, 10%), (0%, 20%), (20%, 0%), (10%, 20%), (20%, 10%), (30%, 30%)), and the true hazard ratio = (0.8, 0.9, 0.95). Our goal is to demonstrate that, even with a comparably small sample size and small proportions of false records, it is still beneficial to use the MI method.
The power, absolute bias, and standard error were calculated based on 5000 simulation runs. To ease the computational burden, m = 10 was chosen for individual imputation. During each simulation, the event pool is updated to avoid oversampling of the same records, and all models were fitted with respect to the same set of simulated twisted data. The Cox MI model results in Table 5 were calculated as the average of these 5000 experiments, i.e., the reported coefficient is the average of coefficients obtained from 5000 Cox MI models. Empirical standard errors across simulations were not reported (but can be added). The mean squared error (MSE) was presented as an overall measure of bias and variance.
Power and Sample Size Calculation for Future Trials
In general, power is the probability of rejecting the null hypothesis when the null hypothesis is false. The power of these two methods was compared at the test \(H_{0} : \beta = 0, \,{\text{vs}} .\, H_{1} : \beta < 0\). To obtain a pre-specified power level for future similar trial settings, we could use the standard error estimation for \(\beta\) obtained from these two methods as pilot information. The total number of events needed is as follows (assume equal allocation):
Also, the total number of events required to obtain the required power for the Cox model would be:
where \(\left( {{ \log }\Delta } \right)\) is the effect size and \(p_{\text{A}}\), \(p_{\text{B}}\) are allocation probabilities. The required event number depends only on effect size, allocation ratio, and \(\alpha\) and \(\beta\) level. An obvious benefit of the MI method is its ability to include more events at an earlier stage of the trial, if we believe there is a certain proportion of FN. The Cox MI model would achieve the desired power more rapidly than the conventional Cox method because more events will be incorporated into the analysis, and hence trials can be conducted in a more efficient manner.
Rights and permissions
About this article

Cite this article
Chen, Y., Lawrence, J., Hung, H.M.J. et al. Methods for Employing Information About Uncertainty of Ascertainment of Events in Clinical Trials. Ther Innov Regul Sci 55, 197–211 (2021). https://doi.org/10.1007/s43441-020-00206-3
Received:
Accepted:
Published:
Issue Date:
DOI: https://doi.org/10.1007/s43441-020-00206-3