
Abstract
Breast cancer is the second most common cause of death among women. An early diagnosis is vital for reducing the fatality rate in the fight against breast cancer. Thermography could be suggested as a safe, non-invasive, non-contact supplementary method to diagnose breast cancer and can be the most promising method for breast self-examination as envisioned by the World Health Organization (WHO). Moreover, thermography could be combined with artificial intelligence and automated diagnostic methods towards a diagnosis with a negligible number of false positive or false negative results. In the current study, a novel intelligent integrated diagnosis system is proposed using IR thermal images with Convolutional Neural Networks and Bayesian Networks to achieve good diagnostic accuracy from a relatively small dataset of images and data. We demonstrate the juxtaposition of transfer learning models such as ResNet50 with the proposed combination of BNs with artificial neural network methods such as CNNs which provides a state-of-the-art expert system with explainability. The novelties of our methodology include: (i) the construction of a diagnostic tool with high accuracy from a small number of images for training; (ii) the features extracted from the images are found to be the appropriate ones leading to very good diagnosis; (iii) our expert model exhibits interpretability, i.e., one physician can understand which factors/features play critical roles for the diagnosis. The results of the study showed an accuracy that varies for the most successful models amongst four implemented approaches from approximately 91% to 93%, with a precision value of 91% to 95%, sensitivity from 91% to 92 %, and with specificity from 91% to 97%. In conclusion, we have achieved accurate diagnosis with understandability with the novel integrated approach.
Research Motivation
Cancer is a disease that is associated with uncontrolled cell division in the body. According to the World Health Organization (WHO) the most widespread type of cancer among women is breast cancer and cervical cancer. Breast cancer is the second most common cause of death among women [1]. At the same time this type of cancer is highly treatable if identified at an early stage. Therefore, early detection is very important, as it can save life.
Among the methods of breast tumor detection, the most popular are ultrasound, mammography and magnetic resonance imaging (MRI). The ultrasound is the method recommended for young women under 40 years old. This method is mainly dependent on the experience of the physiologist. Mammography is the gold standard method recommended for women over 40 years old. Despite its effectiveness, one of the main disadvantages of this diagnostic method is its X-ray radiation, which could be the cause of the cancer. MRI is an expensive method of breast cancer detection that could not be used in the remote regions of one or another country. WHO envisages that the fight against breast cancer can ultimately be won by widespread use of effective Breast Self-Examination (BSE) [2].
Thermography is based on Infrared (IR) Photography can be used to measure the surface temperatures of the breast accurately, which can be used as a useful indicator for breast tumors as they are metabolically active and generate more heat than surrounding healthy tissues [3]. It is safe for health non-invasive method for breast cancer detection, as it is based on the heat wavelength, and for these reasons it can be explored on a regular basis. In addition, infrared cameras are relatively cheap, fast and simple equipment to train ordinary women for BSE and physicians for quick breast cancer screening [3]. Therefore, it can be used as an initial, complementary base check system before mammography or MRI.
One significant potential of artificial intelligence in the field of healthcare lies in its use for the diagnosis of cancer, in particular breast cancer, at an early stage. Most of the research in this area is focused on investigating the possibility of integrating artificial intelligence and mammography or MRI. Whereas thermography in itself appears to be good alternative for integration with artificial intelligence and will be an excellent candidate for BSE, we here note that the equipment involved can be easily miniturized for personal use.
It is well-known that one of the biggest barriers to the use of artificial intelligence in various areas of healthcare is the lack of ready-to-use processed images that can be used to train and test neural networks. In this regard, functional thermography could be applied as a permanent and fast-check tool, and therefore, a lot of images can be collected in a short time to create a big database for machine learning. Among the machine learning tools, convolutional neural network (CNN) is mostly recommended as an image recognition method. On the other hand, Bayesian networks (BNs) are a well-known artificial intelligence (AI) method with superb results in medical diagnosis problems.
In this paper we present a study on the integration of thermography with CNN and BN for their capability to diagnose breast cancer. CNNs have wide applicability and are very successful in image recognition. The aim of the paper is to show that an integration of artificial neural networks methods with probabilistic networks BNs provides a state-of-the-art expert system with explainability. It is well-known that artificial neural networks, although they are very successful, work as black boxes with a lack of explainability. On the other hand, BNs are a probabilistic knowledge representation scheme that only this can handle consistently probabilities and with full explainability. However, to use BNs for diagnosis based on medical images there is the extra work of extracting information (features) from the images in the form of statistical factors. However, the advantage is that the physicians will know the factors that are crucial for the diagnosis. These factors relate to tumor properties so there is a medical value to know the crucial factors. In the present study we ran and tested both CNNs and BNs, eventually developed an integrated system based on both, resulting in an improved diagnostic expert system. The results obtained are shown to be very positive.
The novelty of this work is that the final expert model that combines BN and CNN is a diagnostic tool with high accuracy, although the number of images used for training is small. Another important novelty is that the features extracted from the images are the appropriate ones which lead to very good diagnosis even when we use BN solely. Previous works failed in this aspect [4]. The combination of BN and CNN further improves the accuracy. However, the most significant novelty is that the expert model with solely BN and the final one with CNN + BN exhibit excellent interpretability or otherwise called explainability. This means that using these expert models one physician can understand which factors/features play critical roles for the diagnosis. This is of value especially for medical applications. It should also be noted that in the present work the features extracted are not variables without any medical meaning, instead, they are related to the breast surface temperatures which are, in turn, related to the tumor.
The organization of the paper is as follows: a review of the state-of-the-art-related work and its key findings are presented, which is followed by methods and materials, where the proposed methods are described and discussed, and the materials used given. Then, the results are presented, analyzed and discussed, and finally conclusions are drawn.
Related Work
Artificial intelligence is widely used in the analysis of medical images of the human body, which is a rather difficult task even for an experienced specialist. There are many studies dedicated to the machine learning methods, that employ mammograms, CT images, ultrasound images, and they demonstrated high performance metrics. On the other hand, there are little studies focused on machine learning with the use of thermograms [5].
At the same time, a functional thermogram is a source of information about the state of human health, which, if properly analyzed, can enable doctors to most accurately determine pathologies and make diagnoses [6]. Therefore, a specially trained neural network based on large databases is able to systematically process medical images and take into account the entire medical histories of patients, thereby generating diagnostic results with accuracy of more than 90% [7].
The latest comprehensive reviews on breast cancer detection using thermography were presented in [7,8,9,10,11]. These works show the disadvantages and advantages of the methods used for screening of breast cancer, possibility of using thermography for breast cancer detection, the latest development in the field of the artificial intelligence application for breast cancer diagnosing, as well as positive and negative sides of each work done in this area.
Taking into account the finite number of thermograms collected so far, the research in the field of using machine learning tools based on thermograms is in the beginning of its development. Starting from 2018 there is a rise of such studies, some of them are presented below.
Study by Baffa et al. [12] presented the results of combining Dynamic and Static thermography and applying CNN to identify healthy and abnormal thermograms. The problem of the limited amount of data was solved using pre-processing techniques. The accuracy of the suggested method was equal to 95% for dynamic thermography and 98% for static thermography.
Research by Fernandez-Ovies et al. [13] highlighted their preliminary results on applying Deep Neural networks for breast cancer detection. They used ResNet18, ResNet34, ResNet152, VGG16, VGG19 and ResNet50 with the Fast.ai and Pytorch libraries for early breast cancer detection, and achieved 100% validation with ResNet34 and ResNet50, which allows them to conclude about the effectiveness of applying different architectures of CNN for breast cancer detection.
Tello-Mijares et al. [4] conducted research to develop a computer-based system that would be able to analyze thermograms and classify these images as healthy and unhealthy ones. To implement such a system, the authors evaluated the performances of CNN, tree random forest (TRF), multilayer perceptron (MLP), and Bayesian Network (BN). The best result was achieved by CNN with 100% true-positive rate or sensitivity, specificity or true negative rate, and accuracy.
Roslidar et al. [14] conducted a comparative study, where the authors evaluated workoutput of the CNN with the dense and lightweight neural networks (NN). Dense NN was represented by pre-trained ResNet101 and DenseNet201 networks, whereas lightweight NNs were represented by MobileNetV2 and ShuffleNetV2 networks. As a result DenseNet201 had higher sensitivity, however, MobileNetV2 network surpassed the rest of the trained networks. Moreover, Roslidar, et al. [15] expanded the use of CNN models to apply as an mobile application based on the BreaCNet mobile network. The classification of the thermograms images was implemented by exploring ShuffleNet and MobileNetV2 models. The results of the study demonstrated that accuracy of the ShuffleNet model is 100%, whereas MobilenetV2 achieved 98% accuracy. The authors believe that developing mobile applications will allow women to screen their breasts on a regular basis by themselves.
Torres-Galvan et al. [16] used 7 pre-trained CNN models based on the transfer learning for binary classification. Among 7 pre-trained CNN models were: VGG16, AlexNet, GoogLeNet, ResNet50, ResNet101, InceptionV3 and VGG19. Among all models VGG16 had higher performance metrics compared to other networks. Further study by Torres-Galvan et al. in 2021 [17] suggested a user-independent model based on transfer learning without image pre-processing. In total 311 thermograms were used from three different databases. For transfer learning the ResNet101 pre-trained CNN model with the binary classification was employed. The results of the model are as follows: sensitivity = 84.6–92.6%, specificity = 65.3–53.8%, AUC = 0.814–0.722.
Kiymet, et al. [18] presented a study, where the authors compared VGG16, VGG19, ResNet50 and InceptionV3 CNN models. The models were trained using 144 images from the DMR database. The thermograms were preprocessed by resizing and converting the images to RGB. The best ACC result of 88.89% was shown by the ResNet50 CNN model, which outperformed one of the studies that was taken as workbench, however, presented a worse result compared to other two researches.
Study by Chaves et al. [19] compared different CNN transfer learning models, such as: AlexNet, GoogLeNet, ResNet18, VGG-16 and VGG-19. The models were trained using 440 different thermograms from the DMR database. VGG-16 showed higher performance metrics compared to other models. The following best results were obtained: ACC 77.5%, sensitivity 85%, and specificity 70%.
Study by Zhang et al. [20] aimed to create a system of detecting ductal carcinoma in situ (DCIS), which is a pre-cancerous state of the tumor inside the breast. The system was based on a CNN classifier, whereas thermograms for the study were mixed from different databases. In total the system used 240 thermograms of healthy women’s breasts and 240 thermograms with DCIS. The study showed 94.08 ± 1.22% in terms of sensitivity, 93.58 ± 1.49% of specificity, 93.83 ± 0.96 of accuracy.
Farooq et al. [21] conducted a study based on the Inception-v3 deep neural network using dynamic data of 40 patients. The thermograms were preprocessed using initial sharpening filter and then Contrast Limited Adapt Histogram Equalization. The model showed the following results: accuracy 80%, specificity 77.77%, sensitivity 83.33%, precision 71.43% and F1 score 76.89%.
Study by Cabioglu et al. [22] explored CNN based on AlexNet transfer learning model and using DMR database of 181 thermograms. The images were pre-processed with the Matlab Jet Colormap tool, which led to obtaining RGB images and showed the best ACC result of 0.9434 and F1-score of 0.9407.
Yadav et al. [23] used 1140 thermal images to train CNN based on the pre-trained InceptionV3, VGG16 and Baseline models. The authors pre-processed the images by exploring contrast-enhancement, resizing, cropping and normalization techniques. The performance metrics of the experiment were as follows: accuracy 98.5%, precision 100%, recall 97.5% and F1-score 98.7%.
Study by Zuluaga-Gomez et al. [24] employed the ResNet, SeResNet, VGG16, InceptionResNetV2 and Xception CNN models to classify thermal images, taken from the DMR database. Thermal images went through the pre-processing, such as: ROI segmentation, crop, seizing, normalization. The authors declared optimization of the CNN hyperparameters of the thermal database, and as a result the model reached accuracy of 92%, precision 94%, sensitivity 91% and F1 score 92%.
Goncalves et al. [25] presented a study, where the authors explored different CNN models for binary classification of breast thermograms. The study conducted two experiments based on two different numbers of thermal images. One of the experiments included 169 images from 34 unhealthy patients and 722 images from 147 healthy patients. The other experiment was conducted on the basis of 181 thermal images from 34 sick and 147 healthy patients, whereas only front-view thermograms were used. Among the CNN models the followings were explored: VGG16, ResNet50, DenseNet201. Among these three CNN models DenseNet201 showed the best performance metrics with the following result: F1-score of 0.92, accuracy of 91.67%, sensitivity 100% and specificity 83.3%. Furthermore study by Goncalves et al. [26] were expanded using bio-inspired algorithms, such as Genetic Algorithm (GA) and Particle Swarm Optimization (PSO), which were used for the optimization of the hyperparameters and layers of the CNN, represented by the VGG-16, ResNet-50 and DenseNet201 models. In total 566 thermograms from the DMR database were used, which contained 294 healthy and 272 sick images. The images were preprocessed by applying Matlab index image tool to generate RGB images required for the CNN. It was observed that GA enhanced the results of the CNN compared to the PSO results. At the same time both of the optimization methods improved the results of the CNN compared to the manual experiments. For example, VGG-16 performance metric as F1-score was enhanced from 0.66 to 0.92. Similarly, the F1-score of the ResNet-50 model, was improved from 0.83 to 0.90.
Nicandro et al. in their research [27] evaluated the possibility to diagnose breast cancer using Bayesian Network (BN) classifiers. In their research the authors used 14 variables (6 variables from the image and 8 variables provided by the physician) to create a score-based system for breast cancer detection. The database of the study consisted of 98 cases in total, where 77 patients had breast cancer and the rest 21 patients were healthy. The best result in terms of accuracy was achieved by a BN with a Hill–Climber classifier (76.10%), whereas the best sensitivity result was by a BN with a Repeated Hill–Climber classifier, and the best specificity result was 37% by a Naïve Bayes classifier.
Study by Ekici et al. [28] proposed a software, which could be able to detect breast cancer automatically based on the features of the cancer on the thermograms. The software was able to investigate the thermograms for the characteristics belonging to any abnormality of the breast, and then taking into account biodata, image analysis and image statistics to categorize the thermograms as healthy or unhealthy. The evaluation of the thermograms is based on CNN and the Bayesian algorithm. The database of the study consisted of 140 women. The study achieved an accuracy of 98.95%.
Aidossov et al. [29] presented a CNN tool for binary classification of thermal images. The images were not preprocessed and obtained from two databases. The first database is Visual Lab and the second database was collected and created by the researchers of Nazarbayev University from the Multifunctional Medical Health Center of Nur-Sultan city (Kazakhstan). The technique showed an accuracy of 80.77%, specificity of 100%, and sensitivity of 44.44%. Further work by Aidossov et al. [30] was based on combining two approaches, such as CNN and BN. In this work the authors presented a first attempt to integrate CNN and BN, using only a very small data set with 40 patients. The study proved that in cases with few images the combination of BNs with CNNs help to increase the various quality metrics. The present study uses much more images plus an improved CNN model. Most importantly, the features extraction to construct the BNs was more successful, since we used better method to keep only pixels that are from the breast area and not the whole image.
In summary, decent results can be achieved by AI techniques using thermography to detect breast cancer. However, most of the studies, according to their authors, lack thermogram databases. Therefore, the current study aimed to integrate the CNN and BN to obtain improved results for breast cancer detection at the early stages of tumor development, even with small data sets. Furthermore, the integrated approach was also designed to combine the advantages of both methods, such as automatic classification of images and at the same time the provision of explainability for the most influential factors of cancer/tumor.
Materials and Methods
Data Collection
The presented research is certified by the Institutional Research Ethics Committee (IREC) of Nazarbayev University (identification number: 294/17062020). The Database for Mastology Research [31], which has 266 thermal images, was utilized to extract thermal images as inputs for our diagnosis algorithm. We retrieved a total of 166 images for the “Healthy” category and 100 images for “Sick” category. A standard thermal image has RGB channels and a size of 640 × 480 × 3. All images were retrieved in the grayscale format. Figure 1 shows some examples of the selected thermograms by each category.

Example of retrieved thermal images for a healthy and b sick patients
Some records from this database were not included, because patients were listed with diagnosis results as “uncertain” or diagnosis for a patient was not given. In addition, several images were rejected for use in this study during the data gathering stage for the following reasons (Fig. 1):
-
Images that are fuzzy, with the contours of the breasts and even the complete torso barely visible. The distinction is extremely evident, as seen in Fig. 2.
Fig. 2 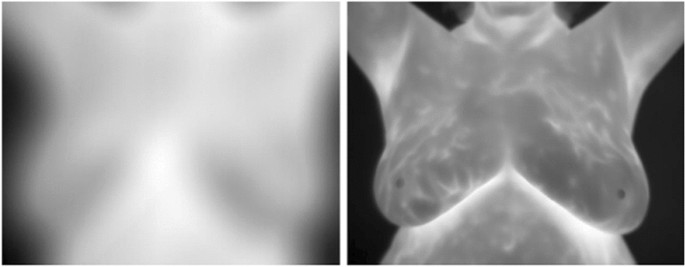
Comparison between a fuzzy and a normal thermal image of the database
-
Images of the breasts with a dress on them, which can hide any form of injury and produce a thermal pattern similar to that of a tumor.
-
Images that did not follow the established protocol, such as those in which individuals were photographed with their arms down or in an unusual position or angle.

Statistical Methods and Construction of BN from Data
The Bayesian Network (BN) is a happy marriage between probability and graph theory, which includes the following machine learning steps:
(1) Structure learning step: perform structure learning with data to generate a Directed Acyclic Graph (DAG) network structure with “causal” conditions through optimization: structure learning for large DAGs requires a scoring function and search strategy.
(2) Parameter learning step: perform parameter learning with data and DAG with Maximum Likelihood Estimation (MLE) to generate Conditional Probability Tables (CPTs) for every node/variable based on Bayesian Theorem.
(3) Inference: make inferences in BN based on Bayesian Theorem. It requires the Bayesian network to have two main components: (DAG) that describes the structure of the data and CPTs that describe the statistical relationship between each node and its parents.
There are certain stages in our method that need to be followed to build a successful expert system for breast tumor diagnosis.
First, data should be explored with a descriptive analysis. This exhibits immediately the distributions, probability density functions, missing values and some outliers. For the construction of the probabilistic network the selection of the appropriate discretization method is very important too. All the continuous (scale) data were discretized using supervised multivariate discretization methods optimized for the target variable Tumor (positive or negative states).
Second, two types of learning methods were used: unsupervised and supervised learning. The difference between the two types concerns the manipulation of data. In supervised learning we provide training meaning the truth for some subset of data. We have and we feed with prior knowledge for the output values given the input. Thus, the goal of supervised learning is to generate a function (relationship between input and output), given a sample of data and desired outputs. Unsupervised learning differs substantially. It does not use labeled outputs, so the aim is to derive the natural structure present within a set of data points. Common applications within unsupervised learning are clustering, representation learning etc. The inherent structure of our data is learned without using explicitly provided labels using algorithms, such as k-means clustering, principal component analysis, and autoencoders.
Unsupervised learning was performed utilizing unsupervised Structural Learning algorithms (add or remove arcs between nodes) based on the Minimum Description Length (MDL) score.
MDL score is a two-component scalar value for calculating the number of bits needed to structure a model and the data given the BN model (nodes, network topology plus probability tables). The number of bits for representing the data given the BN is inversely proportional to the probability of the observations obtained by the BN:
where “a” is a real number that plays the role of the weight, DL(D|BN) is the multitude of bits to represent the data set D given the Bayesian network BN, and
where DL(BN) is the quantity of bits required for modeling a BN (graph and all probability tables), while DL(G), number of bits for the representation of the graph G of the BN and DL(P|G), bits required to describe the set of all probability tables P (CPTs and priors) encapsulated in the graph G. In all definitions when we state number of bits we mean minimum number of bits. Note also that small values of DL(BN) imply an economic structure not too complicated, while large values have a complex structure. On the other hand, small values of DL(D|BN) suggests a well-fitting representation of the model.
With the unsupervised learning the overall BN was constructed to explore the influences among all the nodes. It is a necessary first step to discover possible inconsistencies given some evidence. In our case the generated influences exhibit no conflict. Furthermore, if the purpose is the diagnosis, as in our case, unsupervised learning is needed as a first check that focuses on the significant causal-like influences that predict the states of one declared target variable. In the present work the target variable is the Tumor with two states. Therefore, when later we will run the supervised learning it will be possible to check if there is an agreement with the predicted important factors that influence the target variable.
In our work unsupervised learning creates arrow type relations finding strengths between informational nodes using the mutual information and the Kullback–Leibler Divergence or KL Divergence. Beyond selecting and marking predictors and non-predictors, it is possible to further “measure” the relationship/strength versus the Target Node diagnosis by evaluating the Mutual Information or KL Divergence of the arcs connecting the nodes.
The Mutual Information I between variables X and Y is defined by
and is a measure of the amount of information gained on variable X.
Entropy, denoted H(X), is a key quantity for measuring the uncertainty associated with the probability distribution of a variable X. Entropy in bits is defined as follows:
and H(X|Y) is the conditional entropy, in bits, which estimates the expected Log-Loss of the variable X given variable Y. Therefore, it is apparent that the conditional entropy is a significant quantity in the definition of the Mutual Information between X and Y. Mutual Information is analogous to covariance, while the entropy resembles variance. In the algorithms that design the arcs the normalized mutual information is estimated which takes also into account the number of states for each variable (because in general they are not the same).
Furthermore, the Kullback–Leibler Divergence also called KL Divergence is also evaluated as a measure of the strength of the relation between two nodes.
The KL Divergence, DKL, indicates the difference between two distributions P and Q which in our case are BNs:
“P” is the BN that includes the arc, and Q the same BN but excluding that arc.
Augmented Naïve Bayes model and Augmented Markov model have been chosen as supervised learning algorithms [32]. Both give almost identical results in our case. Augmented Naïve Bayes is similar to Naïve algorithm but there is a manipulation of the “child” nodes of the network; they are optimized to generate a robust system. There is a cost to pay, learning process time duration is larger than in “Naïve Bayes” type of learning. However, the data set in the present study is not big. Augmented Markov blanket learning algorithm results in a generative model (sometimes there is a redundancy about some features, but generates robust models, specifically when some values are missing). If some nodes remain unconnected, the absence of their connections with the Target Node implies that these nodes are independent of the Tumor node given the nodes in the Markov Blanket. Finally, further validation of the results was checked using K-folds analysis.
In the present work we propose an integrated approach to combine both BN and CNN to achieve enhanced diagnosis from the thermal images. BNs can encapsulate knowledge from other diagnosis tools from thermal images and from the patients’ historical data. In addition, BNs are expert systems with explainability which means that someone can understand the crucial factors that influence the diagnostic decision.
The information extracted (features) from the thermal images concerns the following factors (selecting the breast with tumor): maximum temperature, Minimum temperature, Max temperature minus Min temperature, Mean temperature, Median temperature, Standard deviation, Variance, Max temperature minus Mean temperature, Max temperature minus Max temperature of the healthy breast, Max temperature minus Min temperature of the healthy breast, Max temperature minus Mean of the healthy breast, Mean temperature minus Mean temperature of the healthy breast, Distance (Max to Min in pixels), A = Number of all pixels around the point of the maximum temperature, that have temperature > [mean + 0.5(maximum-mean)], B = number of pixels/cells of the temperature matrix of the image of the breast with tumor, C = Number of all pixels, that have temperature > [mean + 0.5(maximum-mean)], A/B, C/B. The above factors were calculated from the temperature map of the breast thermal images after deleting the pixels that do not belong to breasts, i.e., arms belly etc.
The correct choice of the extracted features from the image was crucial to achieve very good performance indices even from a not large number of thermal images using BNs contrary to the findings of the work [4], where they use other types of features. In the present work the selected features have a medical value, because they are connected with the temperature and thus with the tumor. Thus, the explainability that is inherit in the BNs, since they are not black box but a knowledge representation scheme is valuable, since one physician can understand which features/factors are most important for identifying a tumor.
In addition, BNs included the following historical medical data for each patient: age, symptoms, signs, first menstruation age, last menstrual period, eating habits, mammography, radiotherapy, plastic surgery, prosthesis, biopsy, use of hormone replacement, marital status, and race.
Methodology of Convolutional Neural Network (CNN) Models
Baseline CNN Model
Convolutional Neural Networks (CNNs) are a type of neural network that processes data in a grid-like pattern [29]. CNN's approach was influenced by the designers of LeNet [33]. In this study the CNN architecture has five layers of convolution, followed by pooling. In addition there are flattening and two fully linked layers follow, with the latter resulting in a binary probability output (Fig. 3). CNN training for deep learning was performed in forward and backward steps with a backpropagation scheme, which is used to receive Loss Function (LF) Gradient against Output from Last Layer and calculate LF Gradients with respect to weights, bias and inputs. Then, optimization (minimization of LF) was performed to update weights and bias with a gradient descent method, and to pass the LF Gradient against inputs to the next layer as a part of Backpropagation scheme.

Architecture of CNN with parameter depiction at each layer
Transfer Learning
For this study the concept of transfer learning was applied. Transfer learning uses a previously trained model as the foundation for a new model and task. It has the potential to not only minimize the amount of time spent collecting training data, but also to speed up the training process. For this study the ResNet50 [34] model was used (Fig. 4), it was trained with ImageNet data set on 1.2 million images of everyday objects. Transfer learning model was used in the study, because images that were used are not typical images that pre-trained models were trained on. Fine-tuning of parameters and modification to the architecture was performed similar to [35] that has used ResNet50 for COVID-19 classification.

Fine-tuned model of ResNet50 for binary classification
Implementation Details
Data were divided into training, cross validation and testing categories in the ratio of 70/10/20, respectively. For the baseline CNN and ResNet50 the following parameters were used: batch size = 32, epochs = 25, optimizer = 'adam'. Images were rescaled to size of 500 by 500 for baseline CNN, and resized to 224 by 224 for ResNet50. Furthermore, the initial callback list was established as follows. The EarlyStopping function was employed to define efficient learning and to avoid overfitting. This function is used to halt the training when the monitored metrics has stopped improving, in this case it is the value of “loss”. Once the “loss” is no longer decreasing then the training terminates. In addition, other parameter in this function were defined, the "patience" of three epochs. If after the loss value reached the minimum, and the value of loss grew in the next three epochs, training ended at that epoch. Reducing the learning rate was also done. Once the metric reached a plateau, the learning rate dropped. For learning rate, patience was set to 2, and if no improvement was noticed, the learning rate was reduced by a factor of 0.3. In fact we have observed that the loss value has steadily dropped and eventually arrived at the lowest value. Class weight was another crucial criteria to define in the Baseline CNN model only. Because the data set had a large number of patients who have breast cancer, it was important to give minority classes a larger class weight, so that it could learn from all classes equally.
Evaluation Metrics
There are 8 evaluation metrics used for CNN-based models because of data imbalance problems: accuracy, precision, recall (sensitivity), specificity (or selectivity), F1-score, confusion matrix, ROC (receiver operating characteristic) curve and area under the curve (AUC). Moreover, one of the ways to evaluate the performance of the studied algorithm is to explore the confusion matrix. It summarizes the expected and true labels for a classification problem. In addition, it shows not only how many errors the classifier models make, but also what kind of faults they produce.
The number of thermal pictures correctly identified as healthy cases is defined as TP, whereas the number of images correctly forecasted as malignant cases is identified as TN. The number of improperly predicted malignant case photos that were healthy cases is determined as FN, whereas the number of incorrectly predicted healthy case images that were cancerous cases is defined as FP. The following formulas can be used to calculate accuracy, precision, recall, specificity, and F1-score:
(default precision is defined for positive cases, there is also precision for negative cases precision(neg) = \(\frac{{{\text{TN}} }}{{{\text{TN }} + {\text{FN}}}}\)
An ROC curve is a graphical depiction of the performance of a binary classification model. It's calculated by comparing the true positive rate (TPR) to the false positive rate (FPR) at various discriminating thresholds, where TPR stands for sensitivity and FPR stands for false positive rate (1-specificity).
Results and Discussion
In this section, we describe the results of four different constructed expert models. Two of them concern recent advanced improvements of artificial neural networks, namely, baseline CNN model and ResNet50, one pure BN model and finally the combined BN and CNN diagnostic tool.
Convolutional Models
To discriminate between "Healthy" and "Sick" patients' thermograms, a binary classification model was created. The CNN model, which was built from the ground up, accurately identified Healthy and Sick instances with an accuracy of 75.4%. Precision, specificity, sensitivity, and F1-score were at 66.67%, 72.22%, 80%, and 72.72%, respectively. The ROC curve is the next statistic that was presented; it shows how well the model can distinguish between the two classes, and the area under the curve is then 0.89. The ROC curves for convolutional models are shown in Figs. 5 and 6 depicts the confusion matrix.

ROC curves for a Baseline CNN model and b ResNet50 model

Confusion matrix for a Baseline CNN and b ResNet50 models
The ResNet50 model shows an accuracy of 90.74%. Values of accuracy and other metrics for ResNet50 are summarized in Table 1, which also includes results for the baseline CNN model.
By the results presented in the tables and figures, we can conclude that ResNet50 and techniques of Transfer Learning show better results compared to models that were trained from scratch for Breast Cancer classification. For further studies, other pre-trained models will be applied.
Bayesian Network
In this subsection, we present two Bayesian expert models, I and II, see, for example, [36,37,38,39,40,41], capable of diagnosing the presence of breast tumor. Model I, is created using unsupervised and supervised learning that define a consistent BN from the data extracted by the images and from the patients’ medical records data.
Furthermore, another expert system, Model II, was constructed that integrates the decisions generated by a CNN diagnosis tool from images and of course from the features/factors extracted by the images and from the patients’ medical records data.
Both expert models have used random test sampling with 30% of the data for the test, and 70% as a learning set. The BayesiaLab software was used for the calculations.
Results of BN Model I The final best performed BN was found to contain as statistically and entropically significant nodes that determine the diagnosis, see Fig. 7, the factors: maximum temperature Minimum Temperature, Max–max_healthy, B, A/B, Race, Radiotherapy, Age, hormone, Prosthesis and Marital Status. Not all of them of course have the same amount of influence. This is determined by evaluating the mutual information and the KL divergence.

BN Model I and determining factors for the target variable tumor
This set of influential factors was also consistent with collecting the outcome from both the unsupervised and the supervised learning, Table 2. Regarding the performance of the BN Model I, results were very satisfactory.
Running the supervised learning algorithm “Augmented Naïve Bayes”, to build our expert model we got the performance results that are shown in Tables 3, 4, and 5 and Fig. 8. The diagnosis inferences show that even with not many cases (266) the expert model is fair. The precision for the positive cases (existence of tumor) is 86%, while the precision for the negative cases was 95%. However, the reliability was high.

ROC curve for Model A
Results of Model II, Combined BN and CNN
Now running the same supervised learning algorithms the significant influential nodes that provide information (according to the relevant entropic values) to the diagnosis were: maximum temperature, minimum temperature, max–max_healthy, A/B, race, age, marital status and the CNN prediction node.
Note that we have included predictions from CNN models with accuracy 80%. This influential structure was also present in the unsupervised method. The overall performance of the expert model was a bit higher taking into account the relatively small accuracy of the integrated CNN model. If we had included better CNN predictions of course the performance would be even better. However, we wanted to show that even an average CNN addition enhances the final model.
This CNN expert model provides a diagnosis for the existence of a tumor and so we get extra information about each patient. BNs can integrate any kind of additional info at the symptom level or at the final diagnosis level. Like one domain expert physician that listens and take into account for his own final decision, the opinion of another colleague.
The results are presented in Tables 6, 7 and Figs. 9, 10. It is obvious that the inclusion of the extra information coming from a hypothetical CNN expert model enhances the performance indices and makes the model more robust. The most significant predictors now have been reduced, see Fig. 10 (see also Tables 8, 9)

BN Model II and determining factors for the target variable tumor

ROC curve of Model II
Finally, both expert models I and II were validated by K-folds method, which did not point out any weaknesses.
We can see that contrary to the work [4] BNs provide not only a diagnosis with explainability that is absolutely crucial for a physician but also very good performance indices. The latter was possible due to our correct choice of features that have been extracted from the images; features that are related to the temperature.
Summary and Conclusions
As was stated breast cancer is the second cause of death among women. At the same time, it is highly treatable if diagnosed at early stages. Therefore, early diagnosis is vital. From our results, we may conclude that in the current study we have successfully developed an integrated BN and CNN machine learning model as an intelligent diagnostic tool with high accuracy, low costs, and explainability, based on the use of thermograms and patients’ medical historical data.
Thermography is a good alternative and supplementary method to the gold standard methods of breast cancer detection. Functional thermography could be applied as a permanent and fast-check/mass-screening tool, and therefore a large set of images can be collected in a short time to create a large database for machine learning.
Among the machine learning tools, CNN is mostly recommended as an image recognition method, and transfer learning utilizing ResNet50 as pre-trained models are showing promising results. The BN is ideal for medical decision-making and in general for any evaluation and exploration of multifactor influences. In addition, BNs offer interpretability/explainability which is much needed by medical professionals.
The conducted research has shown that the integration of the two models (BNs and CNNs) can improve the results of any single system that is based on either BNs or CNNs. In spite of the fact that CNNs need a lot of images to train, test, and validate, we have been able to create this integrated model with very good performance based on a relatively small number of images. This is achieved by building the BNs that encapsulate information from CNNs, statistical medical factors regarding the patients and features extracted from the images related to temperature characteristics. The very good performance indices are due to the wise choice of the features extraction from images.
As a result, the integrated approach can achieve enhanced diagnosis using the thermal images collected together with patients’ medical historical data. The integrated model with BNs and CNNs encapsulates knowledge from the two diagnostic tools, from thermal images and patients’ medical historical data. This expert system is more useful for the physician since it is a system with explainability, which means that someone can understand the crucial factors that influence the diagnostic decision. It is also good for the patients as the system can be easily integrated with a portable IR camera and is safe, automatic, and accurate with low costs. In fact, the vision is that every woman can use it and go through BSE on a regular basis, which will help to realize the goal of minimizing breast cancer through mass screening by BSE on a global scale.
Data availability
The first set of data were generated at Astana Multifunctional Hospital by mamoologist, oncologist. Derived data supporting the findings of this study are available from the corresponding author prof. Michael Yong Zhao on request. The second set of data that support the findings of this study are openly available in Visual Lab at http://visual.ic.uff.br/dmi/, reference number [31].
Change history
28 September 2023
A Correction to this paper has been published: https://doi.org/10.1007/s42979-023-02168-3
References
WHO—Breast Cancer: Prevention and Control (2020) Retrieved 5 March 2022, from WHO—World Health Organization. http://www.who.int/cancer/detection/breastcancer/en/index1.html. Accessed 5 Mar 2022.
Organization WH. Breast cancer: prevention and control. 2019.
Pavithra PR, Ravichandran KS, Sekar KR, Manikandan R. The effect of thermography on breast cancer detection. Syst Rev Pharm. 2018. https://doi.org/10.5530/srp.2018.1.3.
Tello-Mijares S, Woo F, Flores F. Breast cancer identification via thermography image segmentation with a gradient vector flow and a convolutional neural network. J Healthc Eng. 2019. https://doi.org/10.1155/2019/9807619.
Roslidar R, et al. Review on recent progress in thermal imaging and DL approaches. IEEE Access. 2020. https://doi.org/10.1109/ACCESS.2020.3004056.
Litjens G. A survey on deep learning in medical image analysis. Med Image Anal. 2017;42:60–88.
Becker A. Artificial intelligence in medicine: what is it doing for us today? Health Policy Technol. 2019;8(2):198–205. https://doi.org/10.1016/j.hlpt.2019.03.004.
Hakim A, Awale RN. Thermal imaging—an emerging modality for breast cancer detection: a comprehensive review. J Med Syst. 2020;44(136):10. https://doi.org/10.1007/s10916-020-01581-y.
Mashekova A, Zhao Y, Ng EYK, Zarikas V, Fok SC, Mukhmetov O. Early detection of breast cancer using infrared technology—a comprehensive review. Therm Sci Eng Progress. 2022;27:101142. https://doi.org/10.1016/j.tsep.2021.101142.
Husaini MASA, Habaebi MH, Hameed SA, Islam MR, Gunawan TS. A systematic review of breast cancer detection using thermography and neural networks. IEEE Access. 2020;8:208922–37. https://doi.org/10.1109/ACCESS.2020.3038817.
Raghavendra U, Gudigara A, Rao TN, Ciaccio EJ, Ng EYK, Acharya UR. Computer aided diagnosis for the identification of breast cancer using thermogram images: a comprehensive review. Infrared Phys Technol. 2019;102:103041. https://doi.org/10.1016/j.infrared.2019.103041.
Baffa DFO, Grassano M, Lattari L. Convolutional neural networks for static and dynamic breast infrared imaging classification. In: 2018 31st SIBGRAPI Conference on Graphics, Patterns and Images (SIBGRAPI). https://doi.org/10.1109/sibgrapi.2018.00029.
Fernandez-Movies F, Alférez S, Andrés-Galiana EJ, Cernea A, Fernandez-Muñiz Z, Fernandez-Martínez JL. Detection of breast cancer using infrared thermography and deep neural networks. In: Rojas I, Valenzuela O, Rojas F, Ortuño F, editors. Bioinformatics and biomedical engineering. Springer International Publishing; 2019. p. 514–23. https://doi.org/10.1007/978-3-030-17935-9_46.
Roslidar R, Saddami K, Arnia F, Syukri M, Munadi K. A study of fine-tuning CNN models based on thermal imaging for breast cancer classification. In: 2019 IEEE International Conference on Cybernetics and Computational Intelligence (CyberneticsCom), 2019; p. 77–81. https://doi.org/10.1109/CYBERNETICSCOM.2019.8875661. https://ieeexplore.ieee.org/document/8875661.
Roslidar R, Syaryadhi M, Saddami K, Pradhan B, Arnia F, Syukri M, Munadi K. BreaCNet: a high-accuracy breast thermogram classifier based on mobile convolutional neural network. Math Biosci Eng. 2021;19(2):1304–31. https://doi.org/10.3934/mbe.2022060.
Torres-Galván JC, Guevara E, González FJ. Comparison of deep learning architectures for pre-screening of breast cancer thermograms. In: 2019 Photonics North (PN), 2019, pp. 1–2. https://doi.org/10.1109/PN.2019.8819587. https://ieeexplore.ieee.org/document/8819587/citations#citations.
Torres-Galván JC, Guevara E, KolosovasMachuca ES, Oceguera-Villanueva A, Flores JL, González FJ. Deep convolutional neural networks for classifying breast cancer using infrared thermography. Quant InfraRed Thermogr J. 2021. https://doi.org/10.1080/17686733.2021.1918514.
Kiymet S, Aslankaya MY, Taskiran M, Bolat B. Breast cancer detection from thermography based on deep neural networks. In: 2019 Innovations in Intelligent Systems and Applications Conference (ASYU), 2019, pp. 1–5. https://doi.org/10.1109/ASYU48272.2019.8946367. https://ieeexplore.ieee.org/abstract/document/8946367.
Chaves E, Gonçalves CB, Albertini MK, Lee S, Jeon G, Fernandes HC. “Evaluation of transfer learning of pre-trained cnns applied to breast cancer detection on infrared images. Appl Opt. 2020;59(17):E23–8.
Zhang Y, Satapathy S, Wu DEA. Improving ductal carcinoma in situ classification by convolutional neural network with exponential linear unit and rank-based weighted pooling. Complex Intell Syst. 2021;7:1295–310. https://doi.org/10.1007/s40747-020-00218-4.
Farooq MA, Corcoran P. Infrared imaging for human thermography and breast tumor classification using thermal images. In: Paper presented at the 2020 31st Irish Signals and Systems Conference, ISSC 2020, 2020, https://doi.org/10.1109/ISSC49989.2020.9180164.
Cabıoğlu Ç, Oğul H. Computer-aided breast cancer diagnosis from thermal images using transfer learning. In: Bioinformatics and Biomedical Engineering: 8th International Work2 Conference, IWBBIO 2020, Granada, Spain, May 6–8, 2020, Proceedings. Springer-Verlag, Berlin, Heidelberg, 2020; pp. 716–26. https://doi.org/10.1007/978-3-030-45385-5_64. https://dl.acm.org/doi/abs/10.1007/978-3-030-45385-5_64.
Yadav SS, Jadhav SM. Thermal infrared imaging based breast cancer diagnosis using machine learning techniques. Multimed Tools Appl. 2020. https://doi.org/10.1007/s11042-020-09600-3.
Zuluaga-Gomez J, Al Masry Z, Benaggoune K, Meraghni S, Zerhouni N. A CNN-based methodology for breast cancer diagnosis using thermal images. Comput Methods Biomech Biomed Eng Imaging Vis. 2020;15:10. https://doi.org/10.1080/21681163.2020.1824685.
Goncalves CB, Souza JR, Fernandes H. Classification of static infrared images using pre-trained CNN for breast cancer detection. In: Presented at 2021 34th International Symposium on Computer-Based Medical Systems (CBMS). https://doi.org/10.1109/CBMS52027.2021.00094.
Gonçalves CB, Souza JR, Fernandes H. CNN architecture optimization using bio-inspired algorithms for breast cancer detection in infrared images. Comput Biol Med. 2022. https://doi.org/10.1016/j.compbiomed.2021.105205.
Nicandro CR, Efrén MM, Yaneli AAM, Enrique MDCM, Gabriel AMH, Nancy PC, Alejandro GH, Guillermo de Jesús HR, Erandi BMR. Evaluation of the diagnostic power of thermography in breast cancer using Bayesian network classifiers. Comput Math Methods Med. 2013;13:10. https://doi.org/10.1155/2013/264246.
Ekicia S, Jawzal H. Breast cancer diagnosis using thermography and convolutional neural networks. Med Hypotheses. 2020;137: 109542. https://doi.org/10.1016/j.mehy.2019.109542.
Aidossov N, Mashekova A, Zhao Y, Zarikas V, Ng E, Mukhmetov O. Intelligent diagnosis of breast cancer with thermograms using convolutional neural networks. In: Proceedings of the 14th International Conference on Agents and Artificial Intelligence (ICAART 2022), Vol. 2, pp. 598–604, https://doi.org/10.5220/0010920700003116.
Aidossov N, Zarikas V, Mashekova A, Zhao Y, Ng EYK, Omirbayev A, Dyussembinov D, Mirasbekov Y. Breast cancer diagnosis using thermograms, Bayesian and convolutional neural networks. In: 2022 IUPESM conference IUPESM World Congress on Medical Physics and Biomedical Engineering (IUPESM WC2022). Vol 8; 2022. p. 116176–94.
Visual Lab DMR database. http://visual.ic.uff.br/dmi/. Accessed 2 Jan 2022.
Barber D. Bayesian Reasoning and Machine Learning. Cambridge: Cambridge University Press; 2012. https://doi.org/10.1017/CBO9780511804779.
Lecun Y, Bottou L, Bengio Y, Haffner P. Gradient-based learning applied to document recognition. Proc IEEE. 1998;86(11):2278–324. https://doi.org/10.1109/5.726791.
He H, Zhang X, Ren S, Sun J. Deep residual learning for image recognition. In: 2016 IEEE Conference on computer vision and pattern recognition (CVPR), 2016; p. 770–8, https://doi.org/10.1109/CVPR.2016.90
Jing S, Kun H, Xin Y, Juanli H. Optimization of Deep-learning network using Resnet50 based model for corona virus disease (COVID-19) histopathological image classification. In: 2022 IEEE International Conference on Electrical Engineering, Big Data and Algorithms (EEBDA), 2022; p. 992–7. https://doi.org/10.1109/EEBDA53927.2022.9744883.
Bapin Y, Zarikas V. Smart building’s elevator with intelligent control algorithm based on Bayesian networks. Int J Adv Comput Sci Appl (IJACSA). 2019;10(2):16–24. https://doi.org/10.14569/IJACSA.2019.0100203
Zarikas V. Modeling decisions under uncertainty in adaptive user interfaces. Univ Access Inf Soc. 2007;6(1):87–101.
Amrin A, Zarikas V, Spitas C. Reliability analysis of an automobile system using idea algebra method equipped with dynamic Bayesian network. Int J Reliab Qual Saf Eng. 2022. https://doi.org/10.1142/S0218539321500455.
Zarikas V, Papageorgiou E, Regner P. Bayesian network construction using a fuzzy rule based approach for medical decision support. Expert Syst. 2015;32(3):344–69.
Darmeshov B, Zarikas V Efficient bayesian expert models for fever in neutropenia and fever in neutropenia with bacteremia. 2020. https://doi.org/10.1007/978-3-030-32520-6_11.
Amrin A, Zarikas V, Spitas C. Reliability analysis and functional design using bayesian networks generated automatically by an “Idea algebra” framework. Reliab Eng Syst Saf. 2018;180:211–25. https://doi.org/10.1016/j.ress.2018.07.020.
Acknowledgements
This research is funded by the Ministry of Education and Science of the Republic of Kazakhstan, AP08857347 (“Application of artificial intelligence to complement thermography for breast cancer prediction”).
Author information
Authors and Affiliations
Corresponding author
Ethics declarations
Conflict of Interest
The authors have no conflicts of interest to declare. All co-authors have seen and agree with the contents of the manuscript and there is no financial interest to report. We certify that the submission is original work and is not under review at any other publication.
Additional information
Publisher's Note
Springer Nature remains neutral with regard to jurisdictional claims in published maps and institutional affiliations.
This article is part of the topical collection “Advances on Agents and Artificial Intelligence” guest edited by Jaap van den Herik, Ana Paula Rocha and Luc Steels.
Rights and permissions
Springer Nature or its licensor (e.g. a society or other partner) holds exclusive rights to this article under a publishing agreement with the author(s) or other rightsholder(s); author self-archiving of the accepted manuscript version of this article is solely governed by the terms of such publishing agreement and applicable law.
About this article

Cite this article
Aidossov, N., Zarikas, V., Zhao, Y. et al. An Integrated Intelligent System for Breast Cancer Detection at Early Stages Using IR Images and Machine Learning Methods with Explainability. SN COMPUT. SCI. 4, 184 (2023). https://doi.org/10.1007/s42979-022-01536-9
Received:
Accepted:
Published:
DOI: https://doi.org/10.1007/s42979-022-01536-9