
Abstract
Many different types of electric vehicle (EV) charging technologies are described in literature and implemented in practical applications. This paper presents an overview of the existing and proposed EV charging technologies in terms of converter topologies, power levels, power flow directions and charging control strategies. An overview of the main charging methods is presented as well, particularly the goal is to highlight an effective and fast charging technique for lithium ions batteries concerning prolonging cell cycle life and retaining high charging efficiency. Once presented the main important aspects of charging technologies and strategies, in the last part of this paper, through the use of genetic algorithm, the optimal size of the charging systems is estimated and, on the base of a sensitive analysis, the possible future trends in this field are finally valued.
1 Introduction
Growing concern of carbon dioxide emissions, greenhouse effects and rapid depletion of fossil fuels raise the necessity to produce and adopt new eco-friendly sustainable alternatives to the internal combustion engine (ICE) driven vehicles. For this reason, in the last decade, EVs have become in some way widespread, principally because of their negligible flue gas emissions and lesser reliance on oil. It is estimated that by 2022, EVs will be over 35 million in the World. However, a critical problem associated with EVs is that their high penetration causes significant issues on the power distribution grid such as: power quality deterioration, enhanced damaged of line, downturn of distribution transformers, increased distortion and higher fault current [1, 2]. One efficient approach to relieve the effect is to integrate local power generation such as renewable energy sources (RESs) into the EV charging infrastructure [3,4,5].
Batteries can be charged through conductive or inductive methods [6]. Inductive charger are wireless charging systems (WCS). WCS can be stationary, which means that they can only be utilized when the car is parked or in stationary modes, such as in car parks, garages, or at traffic signals, or they can be dynamic. This latter method allows battery charging while the vehicle is in motion. In general, WCS can bring some advantages in the form of aesthetic quality, reliability, durability and user friendliness. Anyway, due to some challenges such as electromagnetic compatibility (EMC) issues, limited power transfer, bulky and expensive structures, shorter range, and lower efficiency [7, 8], inductive chargers are not largely commercialized and employed as the conductive ones. In this paper only conductive charging strategies are analyzed.
Based on their power ratings EV battery chargers can be divided into level 1, level 2 and level 3. Table 1 summarize the characteristics of the three different power levels [9, 10].
A battery charger can allow a unidirectional or bidirectional power flow at all power levels. The bidirectional power flow adds to the grid-to-vehicle interaction (G2V) also the vehicle-to-grid (V2G) mode [11]. This latter technology can bring significant improvement in the overall reliability of the distribution grid, since in case of system failure, peak load demand or other unexpected scenarios, with a bidirectional power flow, the EVs can be used as back up generation, supplying the energy back to the grid when needed [12]. With V2G, as all the energy storage systems, EVs battery can be used not only as back up resource but also to improve the power quality, the stability and the operating cost of distribution network. Moreover, in the long run, V2G could reduce investment in new power generation infrastructure [13,14,15,16]. All the just listed reasons are increasing researchers’ interest in this technology.
Not only the choice of the charging technology, but also the selection of the correct charging method is a feature that has to be considered during the charging procedure. The most popular charging strategies to recharge Li-ion batteries are constant-current/constant-voltage (CC/CV) and pulse current charging methods [17, 18]. However these methods do not take into account the several internal process of the battery which influence its charging capability and aging. As a result, some promising charging strategies which are based on more complete models of lithium-ion batteries are now under research [19].
EV battery and power electronic devices costs are steadily falling [20, 21]. This rapid decline is mostly due to a growing manufacturing industry, which is constantly increasing the knowledge, the number of applications and the improvements of both these technologies. As the costs are falling, the trends of EV battery energy density, gross weight and semiconductor devices performances are following exactly the opposite direction; in fact, with equal capacities, batteries are becoming ever smaller and lighter and the power electronic devices ever more performing [22]. All this impacts the choice and the size of the charging systems. The sizing procedure of a suitable charging system is made even more difficult by the presence of many different technologies of the onboard and off-board chargers and also different cost, dimensions, weights, power rating; and so on.
This the paper is organized as follow. In Sects. 2 and 3, respectively, on-board and off-board charger most common architectures are presented and their operating principles are explained. In Sect. 4, the concept of fast charging stations is introduced. The available and most suitable charging methods are listed in Sect. 5 with particular attention to the charging methods most suitable for direct-current (DC) fast charging. Finally, a genetic algorithm is used in Sect. 6 to estimate the optimal charging system size and its possible future trends.
2 Onboard Charger
Battery chargers can be implemented inside (on-board) or outside (off-board) the vehicle. Onboard battery chargers (OBC) are limited by size, weight and volume [23] for this reason they are usually compatible with level 1 and level 2 chargers. They usually have unidirectional power transfer capability; nevertheless in some case the configuration, a bidirectional power transfer can be achieved. Figure 1 shows the typical architecture of an electric vehicle charging system, in such figure both the on-board charger and the off-board one are represented.

Charging system configuration for electric vehicle
2.1 Two Stage
Onboard chargers are typically composed by two stages: a front-end AC–DC stage and a back-end DC-DC stage. Very different topologies are proposed in literature for both the converters.
The front-end rectifier usually contains a boost power factor correction (PFC) converter to achieve high power factor and low harmonic distortion. The rectifier stage can be performed by a half-bridge, full-bridge or multilevel diode bridge. Half-bridge rectifier is less expensive since it contains less number of diodes/switches, full-bridge rectifier is more complex but the components are subjected to lower stresses. If instead higher power ratings should be achieved a good choice for the ac–dc converter is a multilevel configuration. Figure 2 shows a full-bridge diode rectifier with a conventional PFC boost converter [24, 25]. By substituting all the diodes with active switches, a bidirectional power flow can be obtained.
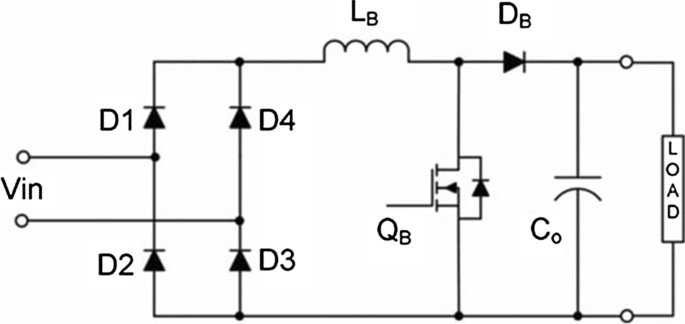
Full-bridge rectifier with conventional PFC boost converter
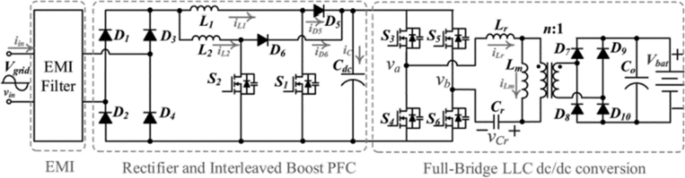
In PFC converter the interleaved boost converter is becoming more and more popular. As shown in Fig. 3, an interleaved boost converter simply consists in two boost converters in parallel, operating 180° out of phase [26]. The main aim of this interleaving is to increase the output current by reducing the input current ripple and hence by reducing the overall volume of the input ElectroMagnetic Interference (EMI) filter and of the boost inductor [23, 27,28,29]. On the other hand, interleaving means increasing the cost and the complexity of the design.

Full-bridge rectifier with interleaved PFC boost converter
The front-end converter is followed by a second dc-dc converter. Resonant power converters are very common to perform this second stage, because of the potential to achieve at the same time both higher switching frequency and lower switching losses [29]. Among all the resonant converter, LLC configuration, shown in Fig. 4, is achieving resounding interest, thanks to its several advantages over other resonant topologies, such as: (1) the ability to operate at zero-voltage switching (ZVS) or zero-current switching (ZCS), (2) containing a high frequency transformer it performs the galvanic isolation between the grid and the EV, (3) a wide output voltage regulation is possible, (4) the output filter consists only in a capacitor and not in an LC filter [29,30,31].
Example of two-stage onboard charger with LLC converter
However in literature other types of dc–dc converter have been proposed. In [32] a bidirectional buck-boost non-isolated dc/dc converter is proposed whose principal aim is to allow a reduction of the dc-link capacitor. In [33] is proposed for the dc–dc stage a cascade structure of a high-frequency LLC converter followed by a buck converter. The advantage of this configuration consists in a constant switching frequency operation of the active switches of the LLC converter while the charge control is performed by the buck converter. On the other and by adding an additional stage to the dc–dc converter, the complexity and the cost of the converter increases. Finally, in [34] a dc–dc non-isolated buck converter is employed. This latter topology is easy to implement but it works only if the dc-link voltage is higher than the battery pack voltage.
2.2 Single Stage
If the ac–dc rectifier is combined with the dc-dc converter, a single stage battery charger is obtained. This topology of battery charger is used if lower cost and size are required [23, 34], in fact single stage battery charger allows the elimination of some bulky and expensive components such as inductors and dc-link capacitors [35, 36] which instead are required in two-stage charger. However, the drawback is that single stage battery chargers with non-isolated converter suffer from a limited conversion ratio, which limits their application for the wide range of output voltage. If instead a high frequency isolation is present, as in the OCB configuration proposed in [35], the low frequency component generated by the rectification stage pass through the high frequency transformer leading to large magnetizing current. Moreover to achieve power factor correction, a large number of diodes and active switches could be necessary [36], increasing in this way the complexity of the configuration and hence decreasing the reliability of the overall charger.
2.3 Integrated
To maximize the reduction of components number and hence to further reduce the size, weight and cost of the battery charger several integrated topologies have been proposed and studied in literature [23, 37,38,39,40]. The concept of integration consists of reusing some of the drivetrain components (inverter and motor windings) to implement the onboard charging system. However, some problems may born from this combination: the configurations proposed in [37, 38] required access to inaccessible points of the motor windings, in [39] a rearrangement of the motor windings is necessary during the transition between different operation modes. Finally, by using the charger configuration proposed in [40], even if neither access to the neutral point of the motor windings nor their rearrangement are required, the control of the active switches becomes more difficult.
2.4 Multifunctional
The last type of proposed OBC are the so called multifunctional OBCs. In this type of battery charger some components are shared to accomplish different aims. In this way higher fuel efficiency can be reached by smaller and lighter design. In [41], the proposed multifunctional battery charger can charge the auxiliary battery via the propulsion battery when the vehicle is in a driving state, acting in this way as an OBC and as low-voltage dc-to-dc converter (LDC) jointly. In [42], a similar configuration, shown in Fig. 5, with the same duties is presented.

Multifunctional OBC proposed in [42]
3 Off-Board Charger
Level 3 charger, because of their rating powers, are usually installed outside the vehicle (off-board). Also for level 3 off-board charger a large amount of different solutions is studied in literature [43,44,45,46,47,48,49,50,51,52,53,54,55,56,57,58,59,60,61,62]. Since it is mandatory to guarantee galvanic isolation between the AC supply circuit and the DC output circuit according to the IEC EN 61,851–23 standard, in this paragraph only isolated off-board charger have been presented.
The off-board charging system is most commonly composed of two stages: a grid-facing AC/DC converter followed by a DC/DC converter providing an interface to EV battery. Based on the converter topology, both these stages can allow unidirectional or bidirectional power flow.
3.1 Bidirectional AC/DC Converter
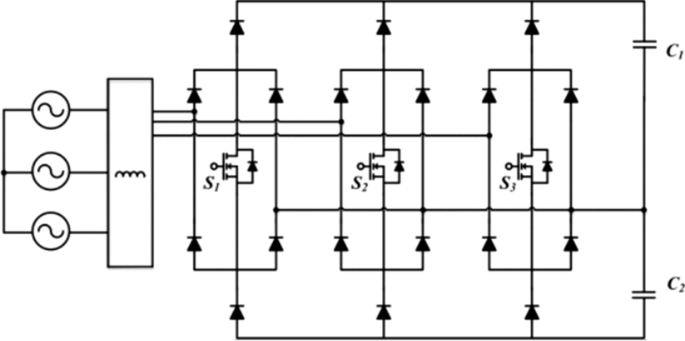
One of the most widely used bidirectional AC/DC converter is the three-phase LCL active rectifier [43,44,45], whose scheme is reported in Fig. 6.

Three-phase LCL active rectifier [44]
The advantages of this type of converter are low harmonic input currents, bidirectional power flow and power factor (PF) regulation.
In [46] and [47] the front end ac–dc conversion is performed by a neutral-point-clamped (NPC) three-phase three-level converter. This converter has been used to increase the power density and to achieve low current harmonics distortion. Another advantage is that it allows the creation of a bipolar dc bus which can be used for the implementation of partial-power converters. However, the NPC causes imbalance of power and, as a result, voltage balancing problem across the DC bus capacitors.
3.2 Unidirectional AC/DC Converter
The most common unidirectional AC/DC converter used in off-board charging system is the Vienna rectifier [48,49,50]. It has advantages such as low voltage stress on each switch and high efficiency. However, the main limitations are the restricted reactive power control and the need of a dc-link capacitor voltage balancing. In [48] the authors propose a 25 kW off-board charger prototype composed by a single-switch Vienna rectifier, as depicted in Fig. 7, and four three level dc/dc modules parallel connected.
Vienna rectifier scheme proposed in [48]
3.3 Bidirectional DC/DC Converter
The main isolated DC/DC converter used in case of bidirectional power flow is the dual active bridge (DAB) [51,52,53,54], reported in Fig. 8, and its variants (resonant DAB [53], multilevel DAB [54]). In particular, this topology is gaining interest thanks to the capabilities of the new wide-bandgap semiconductor (Gan/SiC) devices which enabled the converter efficiency and power density improvements [55].
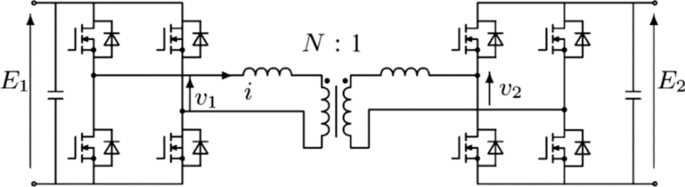
Dual active bridge scheme
3.4 Unidirectional DC/DC Converter
If unidirectional power flow is required, a LLC resonant converter is chosen, in most cases, as power interface between the dc bus of the AC/DC converter and the EV battery because of to its advantages over other resonant topologies [56, 57], such as: the ability to operate at zero-voltage switching (ZVS) or zero-current switching (ZCS), it allows a wide output voltage regulation, the output filter consists only of a capacitor and not of an inductor and capacitor (LC) filter [58].
Another unidirectional DC/DC converter used in case of unidirectional off-board charger is the phase shifted full bridge converter [59, 60], whose scheme is reported in Fig. 9. This type of converter has different advantages such as high power density, low magnetic interference and high efficiency which make it well suitable for the implementation in battery chargers [61].
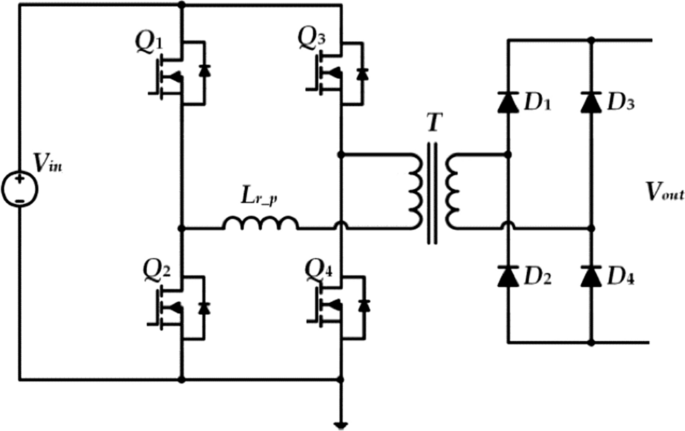
Phase shift full bridge converter
4 Fast Charging Stations
To reduce the driving range anxiety and hence to support a stronger increase of the penetration of EVs worldwide there is the need of a charging system which is able to replace the current existing oil station. A fast charging station (FCS) can allow the charging of an EV at 80% within a half of hour from its depletion, but to reduce the charging time from 7–8 h to 30 min, FCS requires high power from the grid and for this reason they are usually connected to the MV network [63,64,65], even if some FCS connected to the LV grid are proposed too [66]. The connection of such charging stations requires a huge capital investment and it could easily overload the distribution network. Another critical aspect to be considered consists in the voltage drop that the connection of FCS can cause along the lines of the distribution networks, which according to the standard EN50160 has to remain lower than 10%.
According to [67] the impact of fast charging stations on distribution MV grid can be mitigated with the use of energy storage systems (ESSs) which can shave peak power demand and provide additional network services. Moreover, ESS can also increase the voltage level in case of too high voltage drop along the lines, this service requires the implementation of a voltage control.
In order to further minimize the impact of the FCS on the grid, renewable energy resources can integrated within the FCS too [68]. In fact, in normal operation, during daytime, the EV batteries can be charged from the solar PV by reducing in this way the possibility of overloading the MV network. In night-time, instead, when solar energy is not available the EV batteries can be charged from the grid. EVs also can support to the grid at the peak load demand if needed. By this way, the grid will never become unstable with a high pulse power of charging from EVs.
4.1 Architecture
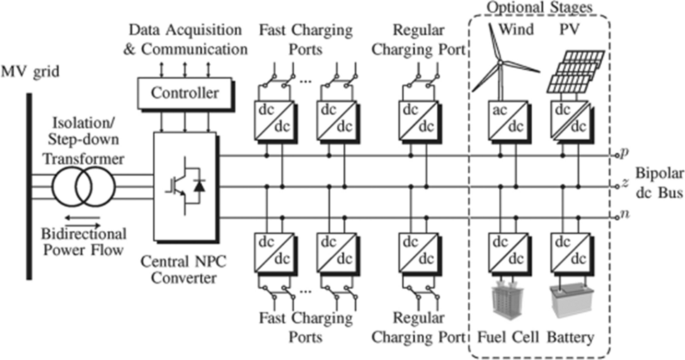
The configuration chosen in [63] for the ultra-fast charging station is shown in Fig. 10. The isolation between the AC side and the DC side is performed by the line-frequency transformer. The ac–dc stage is common to all the EV, in fact the output of the Cascade H Bridge (CHB) multilevel converter creates a unipolar common DC voltage bus at which all dc–dc converters are connected. The power interface between the dc bus and the integrated storage or the EV battery is performed by a LLC resonant converter.
Fast charging station with unipolar dc voltage bus proposed in [63]
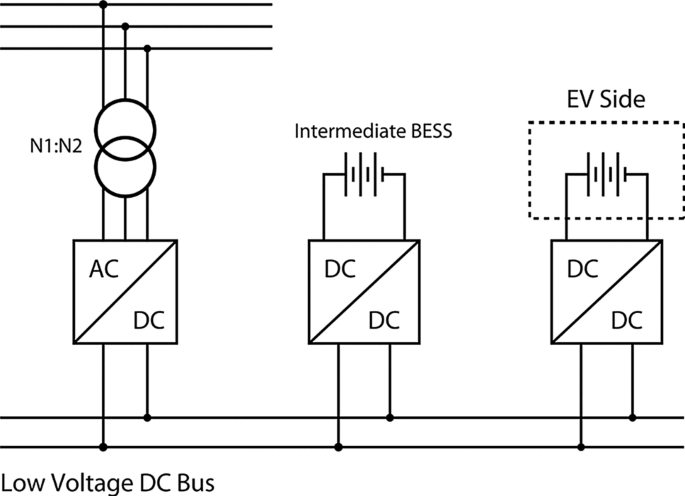
In [64] a bipolar dc bus architecture is proposed. The charging station here adopted is shown in Fig. 11. The bipolar dc bus is necessary to feed the three-level dc–dc converter. On one side, this architecture increase the capability of the FC station and reduce the THD; on the other hand, this system requires a DC power balance management mechanism [65].
Fast charging station with bipolar dc voltage bus proposed in [64]
4.2 Power Control Strategies
A number of studies have been carried out also on the control strategy of EV charging station [69,70,71,72]. The first difference among them concerns the choice of uncoordinated charging or coordinated charging. In uncoordinated charging scheme the EV battery starts charging immediately when it is plugged in or after a fixed start delay chosen by the user. If the EVs are charged according to this scheme, their impact on the grid will result in very high peak demand and hence in huge grid issues such as: feeders and transformers overloading, high losses, high voltage drops, and more cost [69]. For all the aforementioned reasons, the research has focused on EV coordinated charging strategies, in particular. Authors in [70] propose a coordinated control strategy for an FCS with an ESS, their principal aim is that of reducing the electricity purchase cost and flatten the peak load. In [71] the FCS contains both ESSs and RESs, the coordinated energy management proposed here is obtained by using a Fuzzy Logic based control defined by three inputs and two outputs. Other control strategies based on very different and numerous algorithms have been proposed in literature. Authors in [72] investigate and compare three different control strategies for a charging station. The charging strategies coordinate in different ways the energy flow of the ESS and PV panels. The results prove that the control strategy which uses the energy of the ESS with in response to the number of EVs plugged in and takes into account also the amount of generated renewable energy has the best performance. Furthermore according to this control method the SoC of the ESS is restored during night and during excess of solar energy.
5 Charging Methods
The advantages of a lithium-ion battery over other types of energy storage devices such as high energy and power density, low memory effect and resulting capacity loss, make this type of battery the best candidate for the field of electric vehicles [73]. However, li-ion battery charging must be carried out very carefully, since the charging method greatly affects how actively electrochemical side reactions occur inside the battery, and hence the cycle life of the battery itself [74]. For this reason, finding the optimal technique to charge a battery in the shortest period of time with high efficiency and without damaging the cells, has become a new challenge for many researchers [75].
In this paragraph the main charging methods for Li-ion batteries are discussed.
5.1 Constant Current-Constant Voltage (CC–CV)
In this method, represented in Fig. 12, both an initial constant current and a final constant voltage are used. The charging process start with a constant current until a certain voltage value, known as cut-off voltage, is reached. For Li-ion with the traditional cathode materials of cobalt, nickel, manganese and aluminium typically the cut-off voltage value is around 4.20 V/cell. The tolerance is ± 50 mV/cell. Battery charging continues with a constant voltage just equal to the cut-off value. Full charge is reached when the current decreases to between 3 and 5% of the rated current. Trickle or float charge at full charge is not suitable for a Li-ion battery; since it would cause plating of metallic lithium and compromise safety. Instead of trickle charge, a topping charge can be applied when the voltage drops below a set value.
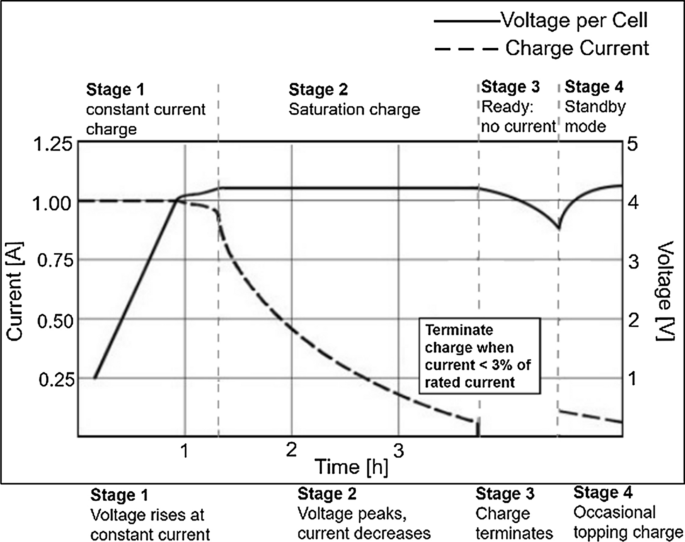
CC–CV charge stages for a Li-ion battery
In [77], a little bit different variant is proposed, in fact the first stage consists now in a trickle charge. This stage is activated only if the battery is deeply discharged, i.e. the cell voltage is below 3.0 V and after it the CC–CV method keeps place with the aforementioned way.
5.2 Five-Step Charging Pattern
An alternative method is here described in order to obtain faster and safer charging and longer battery cycle life [77, 78]. The five-step charging pattern consists in a multistage (five stages) constant-current charging method, in which the charging time is divided into five steps. In each stage, the charging current is set to a constant threshold value. During charging, the voltage of the battery will increase and when it reaches the pre-set limit voltage, the stage number will increase and a new charging current set value will be applied accordingly. This process will continue until the stage number reaches 5. Figure 13 illustrates the concept of the five-step constant current charging pattern.

Five-step charging pattern for a Li-ion battery
To find the charging current in each steps different algorithms can be used, however it could be difficult and time ineffective find the optimal charging pattern.
5.3 Pulse Charging Method
With this charging strategy the charging current is injected into the battery in form of pulses, so that a rest period is provided for the ions to diffuse and neutralize. The charging rate, which depends on the average current, can be controlled by varying the width of the pulses. It is claimed [77, 79] that this method can really speed up the charging process, slow down the polarization effect and increase life cycles. As shown in Fig. 14, every pulse charge current that is applied to the battery is characterized by the following factors: peak amplitude Ipk, a duty cycle D = ton/Tp, and frequency f.

Pulse charge current parameters
Two different pulse charging methods exist: duty-fixed and duty-varied pulse-charge strategy. According to [79], the duty-varied strategy can increase the charging speed and the charging efficiency with respect to the conventional duty-fixed method.
5.4 Charging Strategies Based on Battery Physical-Based Models
In all the charging methods reported so far, only current and voltage limits are considered. Anyway, these limits do not take into consideration the aging process and the side reactions occurring inside the battery; and hence they might result too conservative for new batteries and possibly dangerous for aged batteries due to the altered behavior and characteristics. This, hence, motivates the development and the research of innovative charging algorithms which tackle the issue of the charging impact on battery state-of-health (SoH) and aging [76, 80]. In fact, recently, many researches are focusing on develop new charging methods which minimize the charging time and extend the battery life at the same time [75, 80,81,82,83].
This new category of charging strategies employs the electrochemical lithium-ion battery models to calculate quantitatively and almost precisely the amount of battery aging and to directly minimize the aging in a given charge time. The electrochemical battery model estimates the internal states of a battery in a more accurate way since it is built starting from the internal microstructure of the lithium-ion battery. However, it is very arduous to precisely estimate the parameters because the electrochemical model is composed of complicated coupled partial differential equations (PDEs), and involving a large number of parameters and boundary conditions it requires a large computation burden [82]. Therefore the complexity of these models often leads to the necessity for more memory and computational effort and thus they may not be practically implemented in the fast and real-time computations of EV BMS [86].
In recent years, many works focus on identifying simplified internal electrochemical models of the battery for efficiently determining the battery operation and hence finding the optimal charging profile.
For example, in [75] Klein et al. aim at achieving a fast charging rate while not excessively aging the cell, using nonlinear model predictive control (NMPC) techniques founded on a single particle model (SPM) of the lithium ion battery. In the single particle model (SPM) the electrodes are represented by two single spherical porous particles in which intercalation and de-intercalation phenomena take place. However, the variations in the electrolyte con-centration and in the potential are ignored. This electrochemical model is exhaustively explained in [83, 84].
In [81], a method to optimize the charging current for Li-ion batteries using a soft actor-critic (SAC) reinforcement learning algorithm is proposed. As battery aging model Kim et al. use the single particle model augmented by electrolyte and thermal dynamics (SPMeT). Anyway, even if this model is more exhaustive than the SPM one, it is subject to a complicated mathematical structure including PDEs, ordinary-differential equations and algebraic equations. Therefore the corresponding model based algorithms can be computationally too arduous to be implemented in typical battery management systems (BMSs) [80]. In light of this, in [80], Zou et al. propose and validate a simplified ODE-based SPMeT model to achieve fast charging control. Once validated the reduced model, the authors present a charging strategy based on model predictive control (MPC) techniques which aims to charge the battery in the fastest possible manner, without excessively degrading the battery’s SOH.
Another widely employed electrochemical battery model is the pseudo two-dimensional model (P2D). This model is constructed based on the assumption that electrodes are seen as an aggregation of spherical particles (2D representation) in which the Li + ions are inserted. The first spatial dimension of this model, represented by variable x, is the horizontal axis. The second spatial dimension is the particle radius r. The cell is comprised of three regions that imply four distinct boundaries. The full description of this model can be found in [85]. Finally, in [82], the authors present an effective method to estimate the parameters of the P2D model using a neural network-based estimation scheme.
6 Genetic Algorithm for Optimal Charging Technology Size and Forecasting of Future Trends
Concerning the onboard charger, as seen in paragraph II, different technologies exist in literature and in industrial applications. The cost, dimension and weight of this product is strongly influenced by its power rating; nowadays many sizes are proposed such as: 0.75, 3.3, 6.6, 11 and 22 kW. Many different power ratings are described also for off-board charger and consequently the cost varies as a function of the power and quality.
Generally, the wide range of power ratings, the fast improvements and the lack of standardization in e-mobility technologies make quite difficult estimating the actual optimal power rate of charging technology and forecasting future tendencies for large interval of time.
In this paragraph, initially, using a genetic algorithm (GA) single-objective model, the best size of both the onboard and off-board charging technology is estimated; then, through a sensitive analysis, we try to evaluate the possible future trends in the e-mobility as the costs of the battery and of the charging technology vary.
GA is an heuristic search algorithm, which mimics the natural selection process and it is used to solve optimization problems. GAs are being used to solve a wide variety of optimization problems in the field of EVs such as: charging scheduling [87,88,89], charging station planning and location [90, 91] and drive train control strategy implementation [92–93].
6.1 Objective Function
For managing the EV charging technology, a single-objective optimization is used to determine the optimal size of the charging technology both on-board and off-board and to determine a suitable battery capacity. The proposed optimization allows to find the optimal trade-off between the onboard and off-board charger power rate.
The aim of the sizing procedure is to minimize the overall costs coming from the charging of electric vehicles. Therefore, the optimization problem is modeled in the expressions (1), (2) and (3).
First of all, the objective function representing the cost of the charging system is computed in (1)
The coefficients \({k}_{i}\) represent the cost of the i-th component allocated to the vehicle, while coefficients \({\beta }_{i}\) embody the benefits. The coefficient \({k}_{bat}\) represents the cost of the battery per kWh, more precisely it also includes an amount which consider the costs arising from the space occupied by the battery inside the vehicle, its positioning and all the other aspects which are influenced by the battery capacity. Therefore, the first factor of the function describes the cost trend as a function of the battery size. This behaviour is not perfectly linear since we assume the fact that as the battery capacity increases the payload available inside the vehicle decreases. Coefficient \({k}_{on}\) includes the costs in € per kW of all the components influenced by the rated power of the onboard charger: the cost of power electronics, cost of space, cost of control and so on. Also for the cost trend of the onboard battery charger a non-linear behaviour has been assumed for the same reasons explained for the battery. In particular for this component, it can be seen that a minimum level of 6.5 kW is taken, since we assume that a smaller battery charger will not be used anymore. The computation of the cost coming from the off-board charger power rating follows the same concept used for the onboard charger, with the difference that a minimum value has not been imposed.
Once the cost of each single technology has been estimated, the next passage consists in weighing its benefits, which will be added in the cost function with a negative sign and two coefficients: \({\beta }_{on}\) and \({\beta }_{bat-off}\), which respectively represent the benefit in terms of €/kW for the on-board battery charger and the benefits in terms of €/(kW kWh). The coefficient related to the capacity of the battery and to the power rating of the off-board charger is expected to assume high values, since it concerns the reduction of the driving range anxiety, which we know to be one of the major cause limiting the penetration of the EV worldwide. Starting from the onboard charger, for this parameter a logarithm behaviour has been assumed, since we suppose that an increasing of the \({P}_{on}\) specially takes advantage passing from 6.5 kW to values such as 22 kW, an additional increase doesn’t weigh so much on the overall system. Finally, the benefits of the off-board charger power rating \({P}_{off}\) and of the battery capacity \({C}_{bat}\) are introduced. The advantages brought by these two variable are linked together and considered in the last term of the function. An increase in the capacity of the battery should be compensated by an increase in the rating of the off-board charger, otherwise it is not fully appreciated, and vice versa if the off-board charger becomes more powerful, the capacity of the battery has to limit the stresses to which the battery is exposed.
6.2 Optimal Size of the Charging Technology
As aforementioned, finding the minimum of the function \({f}_{c}\) (2) means find those values of \({C}_{bat}, {P}_{on}\) and \({P}_{off}\) which are such as to minimise as much as possible the cost of the overall charging system. In particular, the minimum of the cost function has been performed through the use of genetic algorithms coded in Matlab. The bounds listed in (3) have been used.
Figures 15, 16 and 17 given below report the minimum of the function once the value of the coefficients changes. The starting condition considers the actual prices and benefits reported in Table 2. By using these values for the coefficients, a battery capacity of 60 kWh, an off-board charger of 170 kW and an onboard one of 14 kW are obtained from the optimization of the cost function.

\({C}_{bat},{P}_{on}\) \({\mathrm{C}}_{\mathrm{bat}},{\mathrm{P}}_{\mathrm{on}}\) \({\mathrm{C}}_{\mathrm{bat}},{\mathrm{P}}_{\mathrm{on}}\) \({\mathrm{C}}_{\mathrm{bat}},{\mathrm{P}}_{\mathrm{on}}\) and \({P}_{off}\) trends as the coefficient \({k}_{bat}\) varies

\({C}_{bat},{P}_{on}\) and \({P}_{off}\) trends as the coefficient \({k}_{on}\) varies

\({C}_{bat},{P}_{on}\) and \({P}_{off}\) trends as the coefficient \({k}_{off}\) varies
6.3 Forecast of Future Trends
In the following second step of the study, the values of coefficients are varied, one at a time, to perform a sensitivity analysis.
It is possible to notice that the capacity of the battery and the power rating of the off-board charger are not influenced by the variation of the cost of the onboard charger per kW. The power rating of the onboard charger seems to stay quite constant around values of 14 kW, however if the cost fell below 100 € each kW, \({P}_{on}\) would start to increase until it reaches 18 kW at 25 €/kW.
As expected, the value of the power of the onboard charger does not change as \({k}_{bat}\) changes since the benefits and the costs of this parameter has not be tied to the cost of the battery technology.
The coefficient \({k}_{off}\), represented in Fig. 17, includes all the costs related to the off-board charger weighed from the point of view of the owner. The real cost per kW of this technology is currently around 2500 €, by considering all the aspects such as: power electronics, control, connection to MV grid, connection and communication with the vehicle, installation and maintenance.
Finally, a forecast is done about the semiconductor devices. In this field, two wide bandgap materials are showing great promise for the future: Gallium Nitride (GaN) and Silicon Carbide (SiC). Thanks to all their characteristics, compared in Table 3, wide bandgap semiconductors allow for greater power efficiency, smaller size, lighter weight and lower overall cost. In particular, by comparing SiC and GaN properties, it can be concluded that GaN is the most suitable for low power, high frequency application while SiC material is more appropriate for high power high frequency applications [92].
7 Conclusion
The first part of this paper reviews the current conditions of EV battery charging technologies. The most common topologies which are suitable candidates for each level of an EV charger have been presented. Level 1 and level 2 charger topologies are usually mounted inside the vehicle forming in this way the so called onboard charger. On the other side level 3 chargers are installed off board the vehicles, in this way their collection leads to the creation of the so called FCSs which are promising candidates for future EV high penetration. The most common technologies used in a FCS are multilevel converters which have a high power density and a lower current harmonic distortion. To reduce the impact on the grid, almost all the FCSs are integrated with RESs and ESSs.
Li-ion batteries can be recharged according many different charging techniques which can more or less complicate the charger architecture and control. In particular, the standard charging strategy are simplest since they don’t require model information to charge the battery. Furthermore, they can be realized with very basic circuits, keeping the costs of the charger to a minimum. On the other hand, the charging strategies based on electrochemical models, taking into account the internal dynamics of the battery, consider also the aging of the battery and other constraints, hence resulting in greater accuracy and. All this is at the expense of cost and computational difficulty.
A long-term forecasting of future trends in the field of EV charging systems is a very tough task for different many reasons including the lack of standards and the continuous improvements. In the last section of this paper a possible forecasting and estimation based on GA is described. According to the results, with the actual costs, the capacity of the battery of an electric vehicle should be around 60 kWh, the power rating of the onboard charger around 14 kW and that of the off-board fast charger around 170 kW.
Finally, the silicon switching devices are expected to be replaced by wide bandgap silicon carbide (SiC) devices in order to allow a remarkable reduction in charger’s weight and volume.
References
Rizvi SAA, Xin A, Masood A, Iqbal S, Ullah Jan M, Rehman H (2018) Electric vehicles and their impacts on integration into power grid: a review. In: Presented at the 2nd IEEE Conference on Energy Internet and Energy System Integration (EI2), BeiJing, China, Oct. 20–22, 2018
Papadopoulos P, Cipcigan LM, Jenkins N (2009) Distribution networks with electric vehicles. In: Presented at the 44th International Universities Power Engineering Conference (UPEC), Glasgow, UK, Sept. 1–4, 2009
Longo M, Foiadelli F, Yaïci W (2019) Electric vehicles integrated with renewable energy sources for sustainable mobility. In: Martinez LR (ed) New trends in electrical vehicle powertrains. IntechOpen, UK
Ces T (2009) Transportation options in a carbon constrained world: hybrids, plug-in hybrids, biofuels, fuel cell electric vehicles, and battery electric vehicles. Int J Hydrogen Energy 34(23):9279–9296. https://doi.org/10.1016/j.ijhydene.2009.09.058
Liu L, Kong F, Liu X, Peng Y, Wang Q (2015) A review on electric vehicles interacting with renewable energy in smart grid. Renew Sustain Energy Rev 51:648–661. https://doi.org/10.1016/j.rser.2015.06.036
Pellitteri F, Caruso M, Castiglia V, Di Tommaso AO, Miceli R, Schirone L (2016) An inductive charger for automotive applications. In: Presented at the 42nd Annual Conference of the IEEE Industrial Electronics Society IECON, Florence, Italy, Oct. 23–26, 2016
Panchal C, Stegen S, Lu J (2018) Review of static and dynamic wireless electric vehicle charging system. Eng Sci Technol Intern J 21(5):922–937. https://doi.org/10.1016/j.jestch.2018.06.015
Sunab L, Maa D, Tanga H (2018) A review of recent trends in wireless power transfer technology and its applications in electric vehicle wireless charging. Renew Sustain Energy Rev 91:490–503
Yilmaz M, Krein PT (2012) Review of charging power levels and infrastructure for plug-in electric and hybrid vehicles. In: Presented at the IEEE International Electric Vehicle Conference, Greenville, SC, USA, Mar. 4–8, 2012
Tran VT, Sutanto D, Muttaqi KM (2017) The state of the art of battery charging infrastructure for electrical vehicles: topologies, power control strategies, and future trend. In: Presented at the Australasian Universities Power Engineering Conference (AUPEC), Melbourne, VIC, Australia, Nov. 19–22, 2017
A novel low cost integrated on-board charger topology for electric vehicles and plug-in hybrid electric vehicles. In: Presented at 2012 27th Annual IEEE Applied Power Electronics Conference and Exposition (APEC), Orlando, FL, USA, Feb. 5–9, 2012
Ammous M, Khater M, AlMuhaini M (2017) impact of vehicle-to-grid technology on the reliability of distribution systems. In: Presented at the 9th IEEE-GCC Conference and Exhibition (GCCCE), Manama, Bahrain, May 8–11, 2017
Zhou X, Zou L, Ma Y, Gao Z (2017) Research on impacts of the electric vehicles charging and discharging on power grid. In: Presented at the 29th Chinese Control And Decision Conference (CCDC), Chongqing, China, May 28–30, 2017
Jiang Z, Tian H, Beshir MJ, Sibagatullin R, Mazloomzadeh A (2016) Statistical analysis of electric vehicles charging, station usage and impact on the grid. In: Presented at the IEEE Power & Energy Society Innovative Smart Grid Technologies Conference (ISGT), Minneapolis, MN, USA, Sept. 6–9, 2016
Yilmaz M, Krein PT (2013) Review of the impact of vehicle-to-grid technologies on distribution systems and utility interfaces. IEEE Trans Power Electron 28(12):5673–5689. https://doi.org/10.1109/TPEL.2012.2227500
Tan KM, Ramachandaramurthy VK, Yong JY (2016) Integration of electric vehicles in smart grid: a review on vehicle to grid technologies and optimization techniques. Renew Sustain Energy Rev 53:720–732. https://doi.org/10.1016/j.rser.2015.09.012
Abousleiman R, Al-Refai A, Rawashdeh O (2013) Charge capacity versus charge time in CC–CV and pulse charging of Li-ion batteries. SAE Tech Pap. https://doi.org/10.4271/2013-01-1546
Majid N, Hafiz S, Arianto S, Yuono R, Astuti ET, Prihandoko B (2017) Analysis of effective pulse current charging method for lithium ion battery. J Phys Conf Ser 817:012008. https://doi.org/10.1088/1742-6596/817/1/012008
Smith KA, Rahn CD, Wang C (2008) Model-based electrochemical estimation of lithium-ion batteries. In:2008 IEEE International Conference on Control Applications, San Antonio, TX, pp. 714–719. https://doi.org/10.1109/CCA.2008.4629589.
Byrne DM, Oliner SD, Sichel DE (2017) How fast are semiconductor prices falling? Finance and Economics Discussion Series. Washington: Board of Governors of the Federal Reserve System. 2017(005). https://doi.org/10.17016/FEDS.2017.005.
Goldie-Scot L (2020) A behind the scenes take on lithium-ion battery prices. BloombergNEF, 2019. Accessed 30 June 2020. [Online]. Available https://about.bnef.com/blog/behind-scenes-take-lithium-ion-battery-prices/
Zhuang W, Lu S, Lu H (2014) Progress in materials for lithium-ion power batteries. In: 2014 International Conference on Intelligent Green Building and Smart Grid (IGBSG), Taipei, 2014, pp. 1–2, doi: https://doi.org/10.1109/IGBSG.2014.6835262
K. Fahem, D. E. Chariag, L. Sbita, “On-board bidirectional battery chargers topologies for plug-in hybrid electric vehicles”, presented at the International Conference on Green Energy Conversion Systems (GECS), Hammamet, Tunisia, Mar. 23–25, 2017.
L. Cao ; H. Li ; H. Zhang, “Model-free power control of front-end PFC AC/DC converter for on-board charger”, presented at the IEEE 8th International Power Electronics and Motion Control Conference (IPEMC-ECCE Asia), Hefei, China, May 22–26, 2016.
F. Musavi; M. Edington; W. Eberle ; W. G. Dunford, “Energy efficiency in plug-in hybrid electric vehicle chargers: Evaluation and comparison of front end AC–DC topologies”, presented at the IEEE Energy Conversion Congress and Exposition, Phoenix, AZ, USA, Sept. 17–22, 2011.
Lee PW, Lee YS, Cheng DKW, Liu XC (2000) Steady-state analysis of an interleaved boost converter with coupled inductors. IEEE Trans Industr Electron 47(4):787–795. https://doi.org/10.1109/41.857959
Kanimozhi G, Kumar SS, Likhitha K (2016) Battery charger for automotive applications. In: Presented at the 10th International Conference on Intelligent Systems and Control (ISCO), Coimbatore, India, Jan. 7–8, 2016
Gautam D, Musavi F, Edington M, Eberle W, Dunford WG (2011) An automotive on-board 3.3 kW battery charger for PHEV application. In: Presented at the IEEE Vehicle Power and Propulsion Conference, Chicago, IL, USA, Sept. 6–9, 2011
Wang H, Dusmez S, Khaligh A (2014) Design and analysis of a full-bridge LLC-based PEV charger optimized for wide battery voltage range. IEEE Trans Veh Technol 63(4):1603–1613. https://doi.org/10.1109/TVT.2013.2288772
Yan X, Li L, Gao Y, Tao Z (2017) Design methodology of LLC converters based on mode analysis for battery charging applications. In: Presented at the 43rd Annual Conference of the IEEE Industrial Electronics Society (IECON), Beijing, China, 29 Oct–1 Nov 2017
Hu S, Deng J, Mi C, Zhang M (2013) LLC resonant converters for PHEV battery chargers. In: Presented at the 28th Annual IEEE Applied Power Electronics Conference and Exposition (APEC), Long Beach, CA, USA, Mar 17–21, 2013
Singh AK, Pathak MK, Rao YS (2017) A new two-stage converter with reduction of DC-link capacitor for plug-in electric vehicle battery charger.In: Presented at the 3rd International Conference on Computational Intelligence & Communication Technology (CICT), Ghaziabad, India, Feb 9–10, 2017
Lee JY, Chae HJ (2014) 6.6-kW onboard charger design using DCM PFC converter with harmonic modulation technique and two-stage DC/DC converter. IEEE Trans Indus Electron 61(3):1243–1252. https://doi.org/10.1109/TIE.2013.2262749
Kurokawa F, Hattori S (2015) Single stage AD–DC full-bridge converter for battery charger. In: Presented at the IEEE International Telecommunications Energy Conference (INTELEC), Osaka, Japan, Oct. 18–22, 2015
Kim B, Kim M, Choi S (2016) Single-stage electrolytic capacitor-less AC–DC converter with high frequency isolation for EV charger. In: Presented at the IEEE 8th International Power Electronics and Motion Control Conference (IPEMC-ECCE Asia), Hefei, China, May 22–26, 2016
Li S, Deng J, Mi CC (2013) Single-stage resonant battery charger with inherent power factor correction for electric vehicles. IEEE Trans Veh Technol 62(9):4336–4344. https://doi.org/10.1109/TVT.2013.2265704
Woo D, Joo D, Lee B (2015) On the feasibility of integrated battery charger utilizing traction motor and inverter in plug-in hybrid electric vehicles. IEEE Trans Power Electron 30(12):7270–7281. https://doi.org/10.1109/TPTEL.2015.2396200
Wang L, Liang J, Xu G, Xu K, Song Z (2012) A novel battery charger for plug-in hybrid electric vehicles. In: Presented at the IEEE International Conference on Information and Automation, Shenyang, 2012, pp. 168–173. https://doi.org/10.1109/ICInfA.2012.6246802
Haghbin S, Carlson O (2014) Integrated motor drive and non-isolated battery charger based on the split-phase PM motors for plug-in vehicles. J Eng 2014(6):275–283. https://doi.org/10.1049/joe.2014.0126
Shi C, Tang Y, Khaligh A (2017) A single-phase integrated onboard battery charger using propulsion system for plug-in electric vehicles. IEEE Trans Veh Technol 66(12):10899–10910. https://doi.org/10.1109/TVT.2017.2729345
Kim S, Kang F (2015) Multifunctional onboard battery charger for plug-in electric vehicles. IEEE Trans Industr Electron 62(6):3460–3472. https://doi.org/10.1109/TIE.2014.237687
Nguyen HV, Lee D (2018) Single-phase multifunctional onboard battery chargers with active power decoupling capability. In: Presented at the IEEE Applied Power Electronics Conference and Exposition (APEC), San Antonio, TX, 2018, pp. 3434–3439
Aggeler D, Canales F, Zelaya-De La Parra H, Coccia A, Butcher N, Apeldoorn O (2010) Ultra-fast DC-charge infrastructures for EV-mobility and future smart grids. In: Presented at the IEEE PES Innovative Smart Grid Technologies Conference Europe (ISGT Europe), Gothenberg, 2010, pp. 1–8. https://doi.org/10.1109/ISGTEUROPE.2010.5638899
Tu H, Feng H, Srdic S, Lukic S (2019) Extreme fast charging of electric vehicles: a technology overview. IEEE Trans Transport Electrific 5(4):861–878. https://doi.org/10.1109/TTE.2019.2958709
Verma A, Singh B (2017) Three phase off-board bi-directional charger for EV with V2G functionality. In: 2017 7th International Conference on Power Systems (ICPS), Pune, 2017, pp. 145–150. https://doi.org/10.1109/ICPES.2017.8387283
Fang Y, Cao S, Xie Y, Wheeler P (2016) Study on bidirectional-charger for electric vehicle applied to power dispatching in smart grid. In: Presented at the IEEE 8th International Power Electronics and Motion Control Conference (IPEMC-ECCE Asia), Hefei, 2016, pp. 2709–2713
Mortezaei A, Abdul-Hak M, Simoes MG (2018) A Bidirectional NPC-based level 3 EV charging system with added active filter functionality in smart grid applications. In: 2018 IEEE Transportation Electrification Conference and Expo (ITEC), Long Beach, CA, 2018, pp. 201–206. https://doi.org/10.1109/ITEC.2018.8450196
Kim J, Lee J, Eom T, Bae K, Shin M, Won C (2018) Design and control method of 25 kW high efficient EV fast charger. In: Presented at the 21st International Conference on Electrical Machines and Systems (ICEMS), Jeju, 2018, pp. 2603–2607
Rajendran G, Vaithilingam C, Prakash O (2019) Modeling of Vienna rectifier with PFC controller for electric vehicle charging stations. In: AIP Conference Proceedings. 2137(1). https://doi.org/10.1063/1.5120996
Chen S, Yu W, Meyer D (2019) Design and implementation of forced air-cooled, 140 kHz, 20 kW SiC MOSFET based Vienna PFC. In: Proc. IEEE Appl. Power Electron. Conf. Expo. (APEC), Mar 2019, pp. 1196–1203
Taghizadeh S, Hossain MJ, Lu J (2015) Bidirectional isolated vehice to grid (V2G) system: an optimized implementation and approach. In: 2015 IEEE PES Asia-Pacific Power and Energy Engineering Conference (APPEEC), Brisbane, QLD, 2015, pp. 1–5. https://doi.org/10.1109/APPEEC.2015.7380912
Xue L, Shen Z, Boroyevich D, Mattavelli P, Diaz D (2015) Dual active bridge-based battery charger for plug-in hybrid electric vehicle with charging current containing low frequency ripple. IEEE Trans Power Electron 30(12):7299–7307. https://doi.org/10.1109/TPEL.2015.2413815
Zahid ZU, Dalala ZM, Chen R, Chen B, Lai J (2015) Design of bidirectional DC–DC resonant converter for vehicle-to-grid (V2G) applications. IEEE Trans Transport Electrifi 1(3):232–244. https://doi.org/10.1109/TTE.2015.2476035
Moonem MA, Krishnaswami H (2012) Analysis and control of multi-level dual active bridge DC–DC converter. In: 2012 IEEE Energy Conversion Congress and Exposition (ECCE), Raleigh, NC, 2012, pp. 1556–1561. https://doi.org/10.1109/ECCE.2012.6342628
Akagi H, Yamagishi T, Tan NML, Kinouchi S, Miyazaki Y, Koyama M (2015) Power-loss breakdown of a 750-V 100-kW 20-kHz bidirectional isolated DC–DC converter using SiC-MOSFET/SBD dual modules. IEEE Trans Indus Appl 51(1):420–428. https://doi.org/10.1109/TIA.2014.2331426
Tan L, Wu B, Rivera S (2015) A bipolar-DC-bus EV fast charging station with intrinsic DC-bus voltages equalization and minimized voltage ripples. In: IECON 2015-41st Annual Conference of the IEEE Industrial Electronics Society, Yokohama, 2015, pp. 002190–002195. https://doi.org/10.1109/IECON.2015.7392426
Haritha AS, Jithin KJ (2019) An efficient resonant converter based charging scheme for electric vehicle. In: 2019 5th International Conference on Advanced Computing and Communication Systems (ICACCS), Coimbatore, India, 2019, pp. 599–603
Zhao H, Wang L, Chen Z, He X (2019) Challenges of fast charging for electric vehicles and the role of red phosphorus as anode material: review. Energies 12:3897. https://doi.org/10.3390/en12203897
Dusmez S, Cook A, Khaligh A (2011) Comprehensive analysis of high quality power converters for level 3 off-board chargers. In: 2011 IEEE Vehicle Power and Propulsion Conference, Chicago, IL, 2011, pp. 1–10. https://doi.org/10.1109/VPPC.2011.6043096
Feizi M, Beiranvand R (2020) An improved phase-shifted full-bridge converter with extended ZVS operation range for EV battery charger applications. In: 2020 11th Power Electronics, Drive Systems, and Technologies Conference (PEDSTC), Tehran, Iran, 2020, pp. 1–6. https://doi.org/10.1109/PEDSTC49159.2020.9088444
Feizi M, Beiranvand R (2020) Simulation of a high power self-equalized battery charger using voltage multiplier and phase-shifted full bridge converter for lithium-ion batteries. In: 2020 11th Power Electronics, Drive Systems, and Technologies Conference (PEDSTC), Tehran, Iran, 2020, pp. 1–6. https://doi.org/10.1109/PEDSTC49159.2020.9088454
Ota Y, Taniguchi H, Suzuki H, Nakajima T, Baba J, Yokoyama A (2012) Implementation of grid-friendly charging scheme to electric vehicle off-board charger for V2G. In: 2012 3rd IEEE PES Innovative Smart Grid Technologies Europe (ISGT Europe), Berlin, 2012, pp. 1–6
Vasiladiotis M, Rufer A, Béguin A (2012) Modular converter architecture for medium voltage ultra fast EV charging stations: global system considerations. In: Presented a the IEEE International Electric Vehicle Conference, Greenville, SC, 2012, pp. 1–7
Rivera S, Wu B, Kouro S, Yaramasu V, Wang J (2015) Electric vehicle charging station using a neutral point clamped converter with bipolar DC bus. IEEE Trans Industr Electron 62(4):1999–2009
Tan L, Wu B, Rivera S, Yaramasu V (2016) Comprehensive DC power balance management in high-power three-level DC–DC converter for electric vehicle fast charging. IEEE Trans Power Electron 31(1):89–100
Gjelaj M, Træholt C, Hashemi S, Andersen PB (2017) Optimal design of DC fast-charging stations for EVs in low voltage grids. In: Presented at the IEEE Transportation Electrification Conference and Expo (ITEC), Chicago, IL, USA, Jun. 22–24, 2017
Mauri G, Bertini D, Fasciolo E, Fratti S (2013) The impact of EV’s fast charging stations on the MV distribution grids of the Milan metropolitan area. In: Presented at the 22nd International Conference and Exhibition on Electricity Distribution (CIRED 2013), Stockholm, Sweden, Jun. 10–13, 2013
Shiramagond T, Lee W (2018) Integration of renewable energy into electric vehicle charging infrastructure. In: Presented at the 2018 IEEE International Smart Cities Conference (ISC2), Kansas City, MO, USA, Sept. 16–19, 2018, pp. 1–7. https://doi.org/10.1109/ISC2.2018.8656981
Abul’Wafa AR, El’Garably A, Mohamed WAF (2017) Uncoordinated vs coordinated charging of electric vehicles in distribution systems performance. Intern J Eng Inform Syst (IJEAIS) 1(6):54–65
Huajie D, Zechun H, Yonghua S, Xiaorui H, Yongxiang L (2014) Coordinated control strategy of energy storage system with electric vehicle charging station. In: Presented at the IEEE Conference and Expo Transportation Electrification Asia-Pacific (ITEC Asia-Pacific), Beijing, China, 31 Aug–3 Sept 2014
García-Triviño P, Fernández-Ramírez LM, Torreglosa JP, Jurado F (2016) Fuzzy logic control for an electric vehicles fast charging station. In: Presented at the International Symposium on Power Electronics, Electrical Drives, Automation and Motion (SPEEDAM), Anacapri, Italy, Jun 22–24, 2016
Castello CC, LaClair TJ, Maxey LC (2014) Control strategies for electric vehicle (EV) charging using renewables and local storage. In: Presented at the IEEE Transportation Electrification Conference and Expo (ITEC), Dearborn, MI, USA, Jun 18–15, 2014
Ayoub E, Karami N (2015) Review on the charging techniques of a Li-ion Battery. In: Presented at the Third Annual International Conference on Technological Advances in Electrical, Electronic, and Computer Engineering (TAEECE2015), Beirut, 2015, pp. 50–55
Gao Y, Jiang J, Zhang C, Zhang W, Ma Z, Jiang Y (2017) Lithium-ion battery aging mechanisms and life model under different charging stresses. J Power Sour 356:103–114. https://doi.org/10.1016/j.jpowsour.2017.04.084
Klein R, Chaturvedi NA, Christensen J, Ahmed J, Findeisen R, Kojic A (2011) Optimal charging strategies in lithium-ion battery. In: Proceedings of the 2011 American Control Conference, San Francisco, CA, 2011, pp. 382–387. https://doi.org/10.1109/ACC.2011.5991497
Zhang SS (2006) The effect of the charging protocol on the cycle life of a Li-ion battery. J Power Sour 161(2):1385–1391
Ayoub E, Karami N (2015) Review on the charging techniques of a Li-Ion battery. In: Presented at the Third International Conference on Technological Advances in Electrical, Electronics and Computer Engineering (TAEECE), Beirut, 2015, pp. 50–55
Liu Y, Hsieh C, Luo Y (2011) Search for an optimal five-step charging pattern for Li-ion batteries using consecutive orthogonal arrays. IEEE Trans Energy Convers 26(2):654–661
Chen L (2009) Design of duty-varied voltage pulse charger for improving Li-ion battery-charging response. IEEE Trans Industr Electron 56(2):480–487
Zou C, Hu X, Wei Z, Wik T, Egardt B (2018) Electrochemical estimation and control for lithium-ion battery health-aware fast charging. IEEE Trans Industr Electron 65(8):6635–6645. https://doi.org/10.1109/TIE.2017.2772154
Kim M, Baek J, Han S (2020) Optimal charging method for effective Li-ion battery life extension based on reinforcement learning. arXiv e-prints
Chun H, Kim J, Yu J, Han S (2020) Real-time parameter estimation of an electrochemical lithium-ion battery model using a long short-term memory network. IEEE Access 8:81789–81799. https://doi.org/10.1109/ACCESS.2020.2991124
Santhanagopalan S, Guo Q, Ramadass P, White RE (2006) Review of models for predicting the cycling performance of lithium ion batteries. J Power Sour 156(2):620–628
Perez H, Dey S, Hu X, Moura S (2017) Optimal charging of Li-ion batteries via a single particle model with electrolyte and thermal dynamics. J Electrochem Soc 164(7):A1679. https://doi.org/10.1149/2.1301707jes
Jokar A, Rajabloo B, Désilets M, Lacroix M (2016) Review of simplified pseudo-two-dimensional models of lithium-ion batteries. J Power Sour 327:44–55
Du H, Cao D, Zhang H (2017) Modeling, dynamics, and control of electrified vehicles. Woodhead Publishing, UK
Elmehdi M, Abdelilah M (2019) Genetic algorithm for optimal charge scheduling of electric vehicle fleet. In: Presented at NISS19: Proceedings of the 2nd International Conference on Networking, Information Systems and Security,Rabat (Morocco), Mar. 2019. https://doi.org/10.1145/3320326.3320329
Korotunov S, Tabunshchyk G, Okhmak V (2020) Genetic algorithms as an optimization approach for managing electric vehicles charging in the smart grid. CMIS
Alonso M, Amaris H, Germain JG, Galan JM (2014) Optimal charging scheduling of electric vehicles in smart grids by heuristic algorithms. Energies 7(4):2449. https://doi.org/10.3390/en7042449
Yan X, Duan C, Chen X, Duan Z (2014) Planning of Electric Vehicle charging station based on hierarchic genetic algorithm. In: 2014 IEEE Conference and Expo Transportation Electrification Asia-Pacific (ITEC Asia-Pacific), Beijing, 2014, pp. 1–5. https://doi.org/10.1109/ITEC-AP.2014.6941087
Chen S, Shi Y, Chen X, Qi F (2015) Optimal location of electric vehicle charging stations using genetic algorithm. In: 2015 17th Asia-Pacific Network Operations and Management Symposium (APNOMS), Busan, 2015, pp. 372–375. https://doi.org/10.1109/APNOMS.2015.7275344
Gallium nitride (GaN) versus silicon carbide (SiC) in the high frequency (RF) and power switching applications. Microsemi Corporation, Aliso Viejo, California, USA. Accessed 17 Apr 2019. [Online]. Available: https://www.richardsonrfpd.com/resources/RellDocuments/SYS26/Microsemi-A-Comparison-of-Gallium-Nitride-Versus-Silicon-Carbide.pdf
Acknowledgements
This research is part of the Energy for Motion project of the Department of Energy of Politecnico di Milano, funded by the Italian Ministry of University and Research (MIUR) through the Department of Excellence Grant 2018-2022.
Funding
Open access funding provided by Politecnico di Milano within the CRUI-CARE Agreement.
Author information
Authors and Affiliations
Corresponding author
Additional information
Publisher's Note
Springer Nature remains neutral with regard to jurisdictional claims in published maps and institutional affiliations.
Rights and permissions
Open Access This article is licensed under a Creative Commons Attribution 4.0 International License, which permits use, sharing, adaptation, distribution and reproduction in any medium or format, as long as you give appropriate credit to the original author(s) and the source, provide a link to the Creative Commons licence, and indicate if changes were made. The images or other third party material in this article are included in the article's Creative Commons licence, unless indicated otherwise in a credit line to the material. If material is not included in the article's Creative Commons licence and your intended use is not permitted by statutory regulation or exceeds the permitted use, you will need to obtain permission directly from the copyright holder. To view a copy of this licence, visit http://creativecommons.org/licenses/by/4.0/.
About this article

Cite this article
Brenna, M., Foiadelli, F., Leone, C. et al. Electric Vehicles Charging Technology Review and Optimal Size Estimation. J. Electr. Eng. Technol. 15, 2539–2552 (2020). https://doi.org/10.1007/s42835-020-00547-x
Received:
Revised:
Accepted:
Published:
Issue Date:
DOI: https://doi.org/10.1007/s42835-020-00547-x