
Abstract
Ara-A, Ara-C, Ara-G, and Ara-T are arabinose sugars combined with adenine, cytosine, guanine, and thymine bases, respectively. These drugs are clinically important as these drugs are commonly used as anti-viral and anti-cancer drugs. Ara-C, an arabinoside, serves as a chain terminator of deoxyribonucleic acid (DNA) replication by interfering with replication after it is incorporated at the 3′ end of nascent DNA, thereby restricting the proliferation of viruses and cancer cells. The incorporated Ara-CMP is efficiently removed by the proofreading exonuclease activity of polymerase epsilon (Polε), in which the alternative clamp loader CTF18 plays a pivotal role. However, the requirement of CTF18 for the removal of the other arabinosides from the 3′ end of nascent DNA remains unclear. Here, we explored DNA repair pathways responsible for the cellular tolerance to Ara-A and found that cells deficient in the proofreading exonuclease activity of Polε (POLE1exo−/−) showed the highest sensitivity to Ara-A. This activity was also required for cellular tolerance to Ara-G and Ara-T. CTF18−/− cells showed higher Ara-A sensitivity than wild-type cells, though it was critically lower than that of POLE1exo−/− cells. Similar trends were observed for the sensitivity to Ara-G and Ara-T. These results indicate that these arabinosides are removed by Polε proofreading exonuclease activity, and CTF18 is pivotal for Polε-mediated Ara-C removal but does not play critical roles for Polε-mediated removal of Ara-A, Ara-G, and Ara-T. In this study, we unveiled a difference between Ara-C and the other arabinosides (Ara-A, Ara-G, and Ara-T) in the removal from the 3′ end of nascent DNA.
Introduction
Nucleoside analogs are chemical compounds with structures similar to those of nucleosides and have been used as anti-viral drugs (Ogilvie et al., 1971; Witkowski et al., 1972). These drugs are incorporated during viral replication and interfere with viral deoxyribonucleic acid (DNA) replication, thereby effectively restricting viral proliferation (Geraghty et al., 2021). Nucleoside analogs are extensively used to treat acute leukemia (Short et al., 2018), hematological malignancies (Robak, 2011), and lung (Pandit & Royzen, 2022), breast (Zhang et al., 2020), and pancreatic cancers (Carter et al., 2021). They interfere with cancer cell proliferation by inhibiting DNA synthesis via two distinct mechanisms (Tsuda et al., 2017). The first mechanism is chain termination of replication, in which nucleoside analogs incorporated at the end of nascent DNA inhibit subsequent polymerization reactions. In the second mechanism, nucleoside analogs incorporated into the DNA strand serve as DNA damage and inhibit DNA replication on the damaged template.
Arabinosides are nucleoside analogs that contain arabinose sugar instead of ribose sugar. Ara-C is used in the treatment of acute lymphocytic and myeloid leukemia (Short et al., 2018), Ara-A is used to treat human herpes virus infections (Sadowski et al., 2021), Ara-G is effective against T cell malignancies (Kline & Larson, 2006), and Ara-T is used to treat herpes simplex virus infections (Hill et al., 1984). We previously showed that Ara-C serves as a chain terminator and directly restricts DNA replication after incorporation into nascent DNA (Tsuda et al., 2017). The incorporated Ara-CMP is efficiently removed by the proofreading 3′ → 5′ exonuclease activity of Polε (Tsuda et al., 2017; Washif et al., 2023). However, the mechanism of removal of other arabinosides, such as Ara-A, Ara-G, and Ara-T, has not yet been identified, and the DNA repair pathway required for cellular tolerance to these arabinosides has not been clarified.
Polε belongs to the B family of DNA polymerases and replicates the leading strand (Nick McElhinny et al., 2008). This enzyme replicates DNA with extraordinarily high accuracy (Korona et al., 2011). This fidelity is achieved through proofreading exonuclease activity, which removes misincorporated nucleotides. Recent human studies suggest that leading strand synthesis by Polε is promoted through the loading of proliferating cell nuclear antigen (PCNA) sliding clamp by the alternative clamp loader complex CTF18-RFC in vitro, where the interaction between Polε and CTF18 is crucial (Baris et al., 2022; Murakami et al., 2010; Stokes et al., 2020). We recently identified that this Polε-CTF18 axis actively contributes to the maintenance of the genome through the suppression of double-strand breaks (DSB) (Ahmad et al., 2023) by removing chain-terminating nucleoside analogs (Washif et al., 2023).
Several other factors involved in genome maintenance have been reported to contribute to cellular tolerance to nucleoside analogs. Tyrosyl-DNA-phosphodiesterase 1 (TDP1) is a nuclease that removes the protein tyrosyl-DNA complex (Pommier et al., 2014), and this nuclease also removes incorporated nucleoside analog, abacavir (Tada et al., 2015). Stalled replication at the damaged template by the insertion of nucleoside analogs is released by translesion DNA synthesis (TLS) and homologous recombination (HR) (Abe et al., 2018). These pathways are critically important for cellular tolerance to the nucleoside analog FTD (Tsuda et al., 2017). Replication fork collapse caused by nucleoside analogs induces DSBs, and HR and non-homologous end joining (NHEJ) repair these lesions (Cejka & Symington, 2021). Excision repair pathways (base excision repair (BER) (Saberi et al., 2008) and nucleotide excision repair (NER) (Wang et al., 2022) contribute to the removal of damaged bases (Lee & Kang, 2019; Sinha & Häder, 2002).
In this study, we investigated the removal mechanism of incorporated arabinosides. We found that the proofreading exonuclease activity of Polε is the key factor for the removal of all arabinosides, whereas the degree of requirement of CTF18-RFC for Polε-mediated removal of arabinosides was different for different drugs. CTF18-RFC is essential for Ara-C removal; however, this factor plays a minor role in the removal of Ara-A and Ara-G, and Polε excises Ara-T independent of CTF18-RFC.
Results
Polε proofreading exonuclease activity is required for the cellular tolerance to Ara-A
To elucidate the repair pathway responsible for the cellular tolerance to Ara-A, we measured Ara-A sensitivity among parental wild-type DT40 strain and 23 DT40 mutant cell-lines deficient in each DNA repair factor, which included mutants deficient in HR (BRCA1−/−, BRCA2−/−) (Martin et al., 2007; Takizawa et al., 2010), NHEJ (POLQ−/−, KU70−/−) (Takata et al., 1998; Yoshimura et al., 2006), HR and NHEJ (RAD54−/−/ KU70−/−) (Fujita et al., 2013), BER (POLB−/−, FEN1−/−, PARP1−/−) (Demin et al., 2021; Kikuchi et al., 2005; Ooka et al., 2018), NER (XPA/−) (Hirota et al., 2010), TLS (SPARTAN−/−, REV3−/−, RAD18−/−, POLH−/−) (Hirota et al., 2010; Kobayashi et al., 2015; Nakazato et al., 2018), repriming (PRIMPOL−/−) (Kobayashi et al., 2016), Fanconi anemia pathway (FANCC/−, FANCJ−/−) (Yamamoto et al., 2011; Yoshikiyo et al., 2010), protein tyrosyl-DNA complex repair (TDP1−/−/TDP2−/−) (Pommier et al., 2014), removal of nucleoside analogs (POLE1exo−/−, CTF18−/−) (Tsuda et al., 2017; Washif et al., 2023), checkpoint control (ATM−/−, RAD17/−) (Morrison et al., 2000; Saberi et al., 2008), and sister chromatid cohesion (DDX11−/−, SA2−/−) (Abe et al., 2016; Kawasumi et al., 2021) (Table 1). We analyzed sensitivity to Ara-A using an ATP assay (Ji et al., 2009) and calculated the LD50, which indicates the dose required to kill half of the total cell population (Fig. 1A). Based on these data, the relative sensitivity was scored as log2 (LD50 in mutant cells)/(LD50 in wild-type cells). We explored the mutants showing strong sensitivity to Ara-A (relative sensitive value less than −2) and found that only POLE1exo−/− cells met this criterion. CTF18−/− cells also showed mild sensitivity to Ara-A but this sensitivity was milder compared to POLE1exo−/− cells (relative sensitivity value > −2). Cells defective in the HR, BER, or TLS did not show increased sensitivity. These results demonstrate that the proofreading exonuclease activity of Polε is crucial for the tolerance of Ara-A but the requirement of CTF18 for Ara-C tolerance is limited. These results were also observed in human TK6 cells, as POLE1exo−/− human TK6 cells were hypersensitive to Ara-A (Fig. 1B).

Polε proofreading exonuclease activity is a key factor in the cellular tolerance to Ara-A. A Sensitivity profiles of Ara-A in the selected DT40 mutant cells deficient in individual DNA damage response pathways. DT40 cells with the indicated genotypes were assessed for sensitivity to Ara-A. Indicated DT40 cells were cultured for 48 h in the presence of Ara-A and sensitivity was assessed as indicated in materials and methods. The relative sensitivity of each mutant cell compared to that of wild-type DT40 cells was scored as log2 (LD50 in indicated mutant cells)/(LD50 in wild-type cells). LD50 represents the drug concentration that reduces cell survival to 50% relative to that of untreated cells. Negative (left) and positive (right) scores show that the indicated gene-disrupted cells are sensitive and resistant to Ara-A, respectively. B TK6 cells with the indicated genotypes were assessed for sensitivity to Ara-A. Indicated TK6 cells were cultured for 72 h in the presence of an indicated concentration of Ara-A. The dose of Ara-A is displayed on the x-axis on a linear scale, while the percentage of cell survival is displayed on the y-axis on a logarithmic scale. Error bars represent the standard deviation from three independent experiments
Ara-A causes DNA damage and cell cycle arrest
To test the effect of Ara-A on the cell cycle, we investigated cell cycle distribution following Ara-A exposure. We found that wild-type cells showed an augmentation of the S-phase fraction 6 h after Ara-A exposure, suggesting that Ara-A slowed DNA synthesis (Fig. 2A). Accumulation of the mid-S-phase fraction was more pronounced in POLE1exo−/− cells 6 h after Ara-A treatment (Fig. 2A). Moreover, the accumulation of sub-G1 (dead cell fraction) and G2/M phase fractions was observed in POLE1exo−/− cells 12 h after Ara-A exposure, suggesting that apoptosis and G2-checkpoint activation were induced in POLE1exo−/− cells (Fig. 2A).

The effect of Ara-A on cell cycle phase distribution and DNA damage. A Cell cycle phase distribution of the indicated cells analyzed by flow cytometry (propidium iodide staining). The intensities of the PI staining are indicated on the x-axis on a linear scale, and counted numbers of cells are displayed on the y-axis. Cells were exposed to 500 nM Ara-A for indicated times (0–12 h). B Representative fluorescence microscopic images of γH2AX foci in the indicated cell lines before and 12 h after exposure of 200 nM Ara-A. C Individual dots show the number of γH2AX foci per cell. At least 100 cells were scored per analysis. Red bars represent medians. The p-value was calculated by Student’s t-test
Cell cycle arrest and apoptosis caused by Ara-A treatment in POLE1exo−/− cells suggest that Ara-A-induced DNA damage was elevated in POLE1exo−/− cells. To test this hypothesis, we measured the number of nuclear γH2AX foci as a DNA damage marker (Valente et al., 2022) 12 h after Ara-A exposure. We found that POLE1exo−/− cells exhibited a significantly increased number of γH2AX foci than wild-type cells (Fig. 2B, C). These data suggest that Ara-A exerts a cytotoxic effect after incorporation into the genome DNA during DNA replication, and Polε exonuclease activity is required to mitigate this toxic effect.
The minor role of CTF18 in Pοlε exonuclease mediated cellular tolerance to Ara-A
As we observed mild but significantly higher Ara-A sensitivity in the CTF18−/− cells than that in the wild-type cells (Fig. 1), we next asked if CTF18 collaborates with Polε exonuclease in cellular tolerance to Ara-A. To this end, we generated POLE1exo−/−/ CTF18−/− double mutant cells. As expected, CTF18−/− cells showed higher sensitivity to Ara-A than wild-type cells (Fig. 3A). Noteworthy, the Ara-A sensitivity of POLE1exo−/− cells and that of POLE1exo−/−/ CTF18−/− cells were indistinguishable, indicating that Polε exonuclease and CTF18 collaborate in cellular tolerance to Ara-A (Fig. 3A). To examine this epistatic relationship between CTF18−/− and POLE1exo−/− in human cells, we attempted to generate this double mutant from human TK6 cells. However, we could not establish a double mutant clone, presumably because of the synthetic effect of the loss of both factors on cell proliferation in human cells. However, we detected a very limited but higher Ara-A sensitivity in CTF18−/− TK6 cells than in wild-type TK6 cells (Fig. 3B). Moreover, POLE1exo−/− TK6 cells showed higher sensitivity to Ara-A than CTF18−/− TK6 cells (Fig. 3B), which is consistent with our observations in the DT40 cell line. To investigate the effects of Ara-A on chromosomes, we assessed the number of chromosomal aberrations (CAs) in mitotic chromosome spreads 24 h after Ara-A treatment (Fig. 3C). We defined chromatid breaks (among the two sister chromatids, one was broken) and isochromatid breaks (both sister chromatids were broken at the same site) (Fig. 3D). Our results showed that Ara-A induced a significantly higher number of CAs in POLE1exo−/−, CTF18−/− and POLE1exo−/−/ CTF18−/− cells than in wild-type cells (Fig. 3E, F). More importantly, the loss of CTF18 in wild-type background significantly increased the number of Ara-A induced CAs by 300%, whereas the loss of CTF18 in POLE1exo−/− increased CAs by only 20%, and thus effects of CTF18−/− was largely masked by POLE1exo−/− mutation (Fig. 3F). These data again indicate epistatic relationship between CTF18−/− and POLE1exo−/−. Collectively these results indicate that CTF18 collaborates with Polε exonuclease but the contribution of CTF18 is less than that of Polε exonuclease activity in terms of Ara-A tolerance.

The partial contribution of CTF18 in the Polε exonuclease mediated cellular tolerance to Ara-A. A, B Sensitivity of DT40 (A) and TK6 (B) cells with the indicated genotypes to Ara-A treatment was assessed as in Fig. 1. The dose of Ara-A is displayed on the x-axes on a linear scale, while the percentage of cell survival is displayed on the y-axes on a logarithmic scale. Error bars represent the standard deviation from three independent experiments. C Schematic representation of the experimental protocol to measure chromosomal aberrations. D Representative images showing chromosomal aberrations (CAs). The red arrows indicate a chromatid break and an isochromatid break. E The number of CAs per 100 mitotic cells before and after the 24 h treatment with 500 nM of Ara-A was scored four times. F Ara-A-induced CAs; the number of CAs in untreated cells was subtracted from the number in Ara-A-treated cells. The p-value was calculated by Student’s t-test. Error bars represent standard deviation. n.s. not significant
Polε exonuclease and CTF18 are required for replication fork progression after Ara-A incorporation
Having established the important role of Polε exonuclease activity and CTF18 in Ara-A tolerance (Figs. 1, 2, 3) and considering our previous work demonstrating that Polε exonuclease removes mis-incorporated Ara-C to avoid replication fork stalling (Tsuda et al., 2017; Washif et al., 2023), we hypothesized that Polε exonuclease activity and CTF18 avoid replication fork arrest after Ara-A incorporation. To test this hypothesis, we measured the kinetics of the replication fork progression using DNA fiber assay (Quinet et al., 2017). In this assay, we sequentially pulse-labeled the nascent strands with CldU and IdU for 15 min each and treated the cells with Ara-A during the second IdU labeling (Fig. 4A). Nascent DNA was labeled before (CldU, red) and after (IdU, green) Ara-A treatment (Fig. 4B). We calculated the ratio of the unperturbed DNA fiber length relative to that observed in the presence of Ara-A. Compared to wild-type cells, POLE1exo−/−, CTF18−/−, and POLE1exo−/−/ CTF18−/− cells exhibited slowed kinetics of unperturbed DNA synthesis, as previously reported (Washif et al., 2023) (Fig. 4C), but the CldU/IdU ratios of wild-type, POLE1exo−/−, CTF18−/−and POLE1exo−/−/ CTF18−/− cells were similar at ~ 1 under unperturbed conditions (Fig. 4D, Supplementary Fig.S1A). More importantly, under Ara-A-treated conditions (during the second labeling), POLE1exo−/−, CTF18−/,− and POLE1exo−/−/ CTF18−/− cells showed a significantly reduced rate of DNA synthesis in the presence of Ara-A compared to wild-type cells, and the CldU/IdU ratios were higher in these cells than in wild-type cells (Fig. 4E, F, Supplementary Fig. S1B). Notably, the degree of fork arrest following Ara-A treatment was more pronounced in POLE1exo−/−cells than in CTF18−/− cells (Fig. 4E, F, Supplementary Fig. S1B). These data collectively indicate that DNA Polε exonuclease is the key factor in maintaining the replication fork and preventing fork collapse upon the insertion of Ara-AMPs in nascent replication ends and CTF18 partly contributes to Polε exonuclease mediated avoidance of fork arrest.
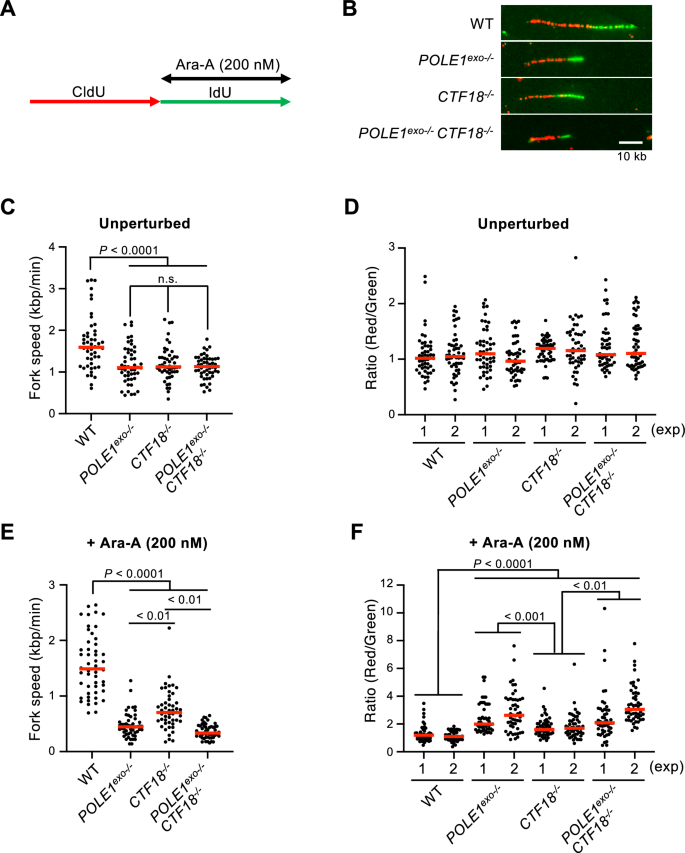
Reduced kinetics of the replication fork progression in POLE1exo−/− and CTF18−/− cells after Ara-A treatment. A DT40 cells were labeled sequentially with CldU and IdU for 15 min each and treated with Ara-A (200 nM) during IdU labeling. B Representative images of the DNA fibers in the indicated cells treated with the 200 nM of Ara-A are shown. C Replication fork velocity was determined by DNA fiber assay for the indicated DT40 cells without Ara-A treatment. More than 50 molecules were analyzed. Individual dots show the velocity of each DNA fiber molecule. D Lengths of the CldU and IdU tracts were measured, and the CldU/IdU ratio for each replication fork was calculated for at least 50 forks. Individual dots show the CldU/IdU ratio for each unperturbed replication fork. E Replication fork velocity for the indicated DT40 cells treated with 200 nM of Ara-A. More than 50 molecules were analyzed. Individual dots show the velocity of each DNA fiber molecule. F Individual dots show the CldU/IdU ratio for each replication fork treated with 200 nM of Ara-A. Red bars represent median values. All statistical analyses were performed by Mann–Whitney–Wilcoxon test. n.s. not significant
Ara-G behaves similarly to Ara-A which is distinct from Ara-C
Our previous study demonstrated that CTF18 plays a crucial role in the removal of Ara-C and maintenance of the replication fork after the mis-incorporation of Ara-CMP (Washif et al., 2023). However, we here showed that CTF18 contributes only partly to Polε exonuclease mediated avoidance of fork arrest following Ara-A incorporation. Next, we analyzed the effects of other arabinosides (Ara-G and Ara-T) on the forks. Both POLE1exo−/− and POLE1exo−/−/ CTF18−/− cells exhibited considerably higher sensitivity to Ara-G than the wild-type and CTF18−/− cells, and CTF18−/− cells exhibited significantly higher sensitivity to Ara-G than the wild-type cells (Fig. 5A). Moreover, POLE1exo−/− and POLE1exo−/−/ CTF18−/− cells exhibited similar Ara-G sensitivity (Fig. 5A). Human TK6 cells also showed higher Ara-G sensitivity in POLE1exo−/− cells than in wild-type and CTF18−/− cells, and CTF18−/− cells were more sensitive to Ara-G than wild-type cells (Fig. 5B). Similarly, we observed a significant enhancement in chromosomal aberrations in POLE1exo−/− and POLE1exo−/−/ CTF18−/− DT40 cells upon Ara-G treatment compared to wild-type and CTF18−/− cells (Fig. 5C, D). These results contrast with the effect of Ara-C, which causes an almost equal number of chromosomal breaks in POLE1exo−/−, CTF18−/, and POLE1exo−/−/ CTF18−/− DT40 cells (Washif et al., 2023). These results indicate that Polε exonuclease and CTF18 collaborate in the cellular tolerance to Ara-G but the contribution of CTF18 is less than that of Polε exonuclease. To analyze the effect of Ara-G on fork progression, we performed a DNA fiber assay with Ara-G and found that the kinetics of fork progression were significantly decreased in POLE1exo−/−, CTF18−/− and POLE1exo−/−/ CTF18−/− cells upon Ara-G treatment compared to wild-type cells (Supplementary Fig. S2), suggesting a role for Polε and CTF18 in the maintenance of replication fork upon Ara-G incorporation. These data indicate that the exonuclease activity of Polε plays a major role in the efficient removal of both Ara-A and Ara-G, along with a partial contribution from CTF18. This differs from the case of Ara-C, where the contribution of Polε exonuclease and CTF18 are equally necessary for removal.

The effect of Ara-G and Ara-T in POLE1exo−/− and CTF18−/− cells. A, B Sensitivity of DT40 cells (A) and TK6 cells (B) with the indicated genotypes to Ara-G was assessed as in Fig. 1. C The number of CAs per 100 mitotic cells before and after the 24 h treatment with 250 nM of Ara-G was scored three times. D Ara-G-induced CAs; the number of CAs in untreated cells was subtracted from the number in Ara-G-treated cells. The p-value was calculated by Student’s t-test. Error bars represent standard deviation. n.s. not significant. E Sensitivity of DT40 cells and TK6 cells with the indicated genotypes to Ara-T was assessed as in Fig. 1
Next, we analyzed the effects of Ara-T. Both POLE1exo−/− and POLE1exo−/−/ CTF18−/− cells showed higher sensitivity to Ara-T than the wild-type and CTF18−/− cells. However, CTF18−/− and wild-type cells exhibited similar sensitivity to Ara-T (Fig. 5E). This was also observed in human TK6 cells (Fig. 5E). Consistently, we found that the kinetics of fork progression were similarly decreased in POLE1exo−/−and POLE1exo−/−/ CTF18−/− cells but not in CTF18−/− cells upon Ara-T treatment (Supplementary Fig. S3). These results indicate that Pοlε exonuclease plays roles in the cellular tolerance to Ara-T independently of CTF18 and CTF18 has little or no role in Ara-T resistance.
Discussion
In this study, we showed that Polε exonuclease is required for the removal of incorporated arabinosides (Ara-A, Ara-G, and Ara-T), and we also revealed that the requirement of CTF18 in the Polε exonuclease mediated removal of incorporated arabinosides are different by drugs. Ara-C requires CTF18 for the removal by Polε exonuclease and CTF18 is essential for Polε exonuclease mediated removal (Washif et al., 2023). Ara-A and Ara-G partly require CTF18 in the removal by Polε exonuclease (Figs. 3, 4, 5). In the case of Ara-T, Polε exonuclease plays roles independently of CTF18 and CTF18 is dispensable for the removal of incorporated Ara-T. The mechanism underlying the bias among 4 arabinosides in the requirement of CTF18 is to be elucidated in future studies.
Although Ara-A is a well-known anti-HSV drug, it also has the potential to be used in the treatment of cancer (Honma & Niitsu, 2000; Mouhieddine et al., 2015; Niitsu et al., 2000). Ara-A can be rapidly deaminated by adenosine deaminase to the less toxic compound Ara-H, which has both positive and negative impacts on cancer treatment, where a positive impact includes reduced Ara-A-mediated side effects and a negative impact includes a decreased amount of cytotoxicity (Cohen, 1977; Holzer et al., 2019; Rashbaum & Cozzarelli, 1976). Consistent with these findings, we applied a relatively higher concentration of Ara-A in both chicken DT40 and human TK6 cell lines in this study compared to the concentration of Ara-C required in our previous study (Washif et al., 2023).
Our findings collectively demonstrate that proofreading exonuclease activity of Polε is the key factor in the cellular tolerance to all arabinosides regardless of their structural variation. To the best of our knowledge, this is the first study to compare all arabinosides in animal cell lines. This study opens a window for further studies with other arabinosides, in addition to Ara-C, for clinical application to develop an efficient anti-cancer drug.
Materials and methods
DT40 and TK6 cell culture
The culture conditions for the DT40 and TK6 cells were similar to those described previously (Fujita et al., 2013; Hirota et al., 2010, 2022). DT40 cells were cultured in DMEM/F-12 medium (GIBCO-BRL, Grand Island, NY, USA) supplemented with 10% heat-inactivated fetal bovine serum (FBS) (Ausgene X, lot No. QLD 4210), 2% chicken serum (GIBCO-BRL, Grand Island, NY, USA), 50 μM mercaptoethanol (Invitrogen, CA, USA), 2 mM l-glutamine (Nacalai Tesque, Japan), 50 U/mL penicillin, and 50 μg/mL streptomycin (Nacalai Tesque, Japan) and maintained at 39.5 °C in a humidified atmosphere with 5% CO2. TK6 cells were cultured in Roswell Park Memorial Institute 1640 medium (Nacalai Tesque, Kyoto, Japan) supplemented with 10% heat-inactivated horse serum from Gibco and sodium pyruvate (1.8 mM), l-glutamine (2 mM), penicillin (100 U/mL), and streptomycin (100 μg/mL) from Nacalai Tesque and maintained at 37 °C in a humidified atmosphere with 5% CO2.
Cellular sensitivity analysis
A cellular sensitivity analysis (ATP assay) was performed as previously described (Ahmad et al., 2023; Shimizu et al., 2015). For the ATP assay of chicken DT40 cells, 8 × 10² cells were treated with the indicated concentration of Ara-A in 0.16 mL of medium in 96-well plates and incubated at 39.5 °C for 48 h. For the ATP assay of human TK6 cells, 1 × 10⁴ cells were incubated in 1 mL of medium at 37 °C for 72 h. We transferred 100 μL of the medium containing cells to 96-well plates and measured the amount of ATP using CellTiter-Glo (Promega, WI, UAS) according to the manufacturer's instructions. Luminescence was measured using Fluoroskan Ascent FL (Thermo Fisher Scientific Inc., Waltham, MA, USA).
Cell cycle analysis by flow cytometry
Cell cycle analysis was performed as previously described (Fujita et al., 2013; Tsuda et al., 2017). Briefly, cells were fixed in 70% ethanol and stained with propidium iodide in the presence of RNase A and analyzed with BD Accuri™ C6 (Becton Dickinson, NJ, USA).
Immunofluorescence staining
Immunofluorescence staining was performed as described previously (Tsuda et al., 2017). Following treatment with 200 nM Ara-A, cells were incubated for 12 h at 39.5 °C. The cells were collected on glass slides using Cytospin (Shandon, Pittsburgh, PA, USA). Cells were fixed with 4% formaldehyde for 10 min at room temperature, permeabilized with 0.5% TritonX-100, and after rinsed twice in PBS, and blocked with PBS containing 5% bovine serum albumin. The cells were then incubated with anti-γH2AX(Ser139) MAb (Millipore, MA, USA) at a 1/400 dilution in 5% BSA in PBS for 1 h at room temperature. After three washes in PBS, the cells were incubated in Alexa Fluor 488 goat anti-mouse IgG antibody (Invitrogen) at a 1/200 dilution in 5% BSA in PBS for 30 min at room temperature, and after they were rinsed in PBS three times, cells were counterstained with 4′, 6′-diamidino-2-phenylindole (DAPI) and mounted with PermaFlour (Vector Laboratories, CA, USA). Cells were observed under a fluorescence microscope (BZ-X810; NICON, Tokyo, Japan). At least hundred cells were scored per data point.
Chromosomal aberration analysis
Chromosomal aberrations (CAs) were analyzed as previously described (Washif et al., 2023). DT40 cells were treated with 500 nM Ara-A and 250 nM Ara-G for 24 h, and then treated with 0.1 μg/mL colcemid (Gibco BRL, MA, USA) for the last 2 h of the drug treatment to arrest the cells in the M phase. The cells were pelleted by centrifugation (1200 rpm for 5 min), resuspended in 75 mM KCl (10 mL) for 13 min at room temperature, and fixed in a freshly prepared 3:1 mixture (2 mL) of methanol and acetic acid (Carnoy’s solution). The pelleted cells were resuspended in Carnoy’s solution (7 mL), dropped onto cold glass slides, and air-dried. The slides were then stained with 5% HARLECO Giemsa stain solution (Nacalai Tesque) for 10 min, rinsed with water and acetone, and dried at room temperature. All chromosomes in each mitotic cell were scored at 1000 × magnification.
DNA fiber assay
The DNA fiber assay was performed as previously described (Hirota et al., 2015, 2016), with slight modifications based on the labeling method for the replicated tract. Briefly, cells were sequentially labeled for 15 min each with 25 μM 5-chloro-2′-deoxyuridine (CldU) and 250 μM 5-iodo-2′-deoxyuridine (IdU). The fiber length was measured using ImageJ software (https://imagej.nih.gov/ij/) and the CldU/IdU ratio was calculated. Measurements were recorded from the areas of the slides with untangled DNA fibers to prevent the recording of labeled patches from tangled fiber bundles. Images were captured using a BZ-X810 fluorescence microscope (Keyence, Tokyo, Japan).
Disruption of SA2 gene in DT40 cells
The left and right arms of SA2 knock out (KO) vectors were amplified using the primers 5′-AGTCggtaccGCAATAGTATCTTTAGAGAAGTTTAC-3′ (KpnI) and 5′-AGTCgtcgacATCTCTGCTGTAACAACTCCTGC-3′ (SalI) (for the left arm of the KO construct); and 5′-TTTTgcggccgcTGGCAGGTCAGTGAACTTTATTTATC-3′ (NotI) and 5′-AGAAGTGGTGTCCCCCAgagctcAGTAC-3′ (SacI) (for the right arm of the KO construct). The amplified PCR products were cut and cloned into pLoxP-Ecogpt or pLoxP-Bsr vector (Arakawa et al., 2001) using the attached restriction sites.
Data availability
The data underlying this article are available in the article and in its online supplementary material.
References
Abe, T., Branzei, D., & Hirota, K. (2018). DNA Damage tolerance mechanisms revealed from the analysis of immunoglobulin V gene diversification in avian DT40 cells. Genes (Basel), 9(12), 614.
Abe, T., Kawasumi, R., Arakawa, H., Hori, T., Shirahige, K., Losada, A., Fukagawa, T., & Branzei, D. (2016). Chromatin determinants of the inner-centromere rely on replication factors with functions that impart cohesion. Oncotarget, 7, 67934–67947.
Ahmad, T., Kawasumi, R., Taniguchi, T., Abe, T., Terada, K., Tsuda, M., Shimizu, N., Tsurimoto, T., Takeda, S., & Hirota, K. (2023). The proofreading exonuclease of leading-strand DNA polymerase epsilon prevents replication fork collapse at broken template strands. Nucleic Acids Research, 51(22), 12288–12302.
Arakawa, H., Lodygin, D., & Buerstedde, J. M. (2001). Mutant loxP vectors for selectable marker recycle and conditional knock-outs. BMC Biotechnology, 1, 7.
Baris, Y., Taylor, M. R. G., Aria, V., & Yeeles, J. T. P. (2022). Fast and efficient DNA replication with purified human proteins. Nature, 606, 204–210.
Carter, C. J., Mekkawy, A. H., & Morris, D. L. (2021). Role of human nucleoside transporters in pancreatic cancer and chemoresistance. World Journal of Gastroenterology, 27, 6844–6860.
Cejka, P., & Symington, L. S. (2021). DNA end resection: mechanism and control. Annual Review of Genetics, 55, 285–307.
Cohen, S. S. (1977). The mechanisms of lethal action of arabinosyl cytosine (araC) and arabinosyl adenine (araA). Cancer, 40, 509–518.
Demin, A. A., Hirota, K., Tsuda, M., Adamowicz, M., Hailstone, R., Brazina, J., Gittens, W., Kalasova, I., Shao, Z., Zha, S., et al. (2021). XRCC1 prevents toxic PARP1 trapping during DNA base excision repair. Molecular Cell, 81, 3018-3030.e3015.
Fujita, M., Sasanuma, H., Yamamoto, K. N., Harada, H., Kurosawa, A., Adachi, N., Omura, M., Hiraoka, M., Takeda, S., & Hirota, K. (2013). Interference in DNA replication can cause mitotic chromosomal breakage unassociated with double-strand breaks. PLoS ONE, 8, e60043.
Geraghty, R. J., Aliota, M. T., & Bonnac, L. F. (2021). Broad-spectrum antiviral strategies and nucleoside analogues. Viruses, 13, 667.
Hill, J. M., Wiggins, C. A., Kwon, B. S., Gentry, G. A., & Gangarosa, L. P., Sr. (1984). Thymine arabinoside (Ara-T) topical and iontophoretic application for herpes simplex virus type 1 and type 2 skin infections in hairless mice. Methods and Findings in Experimental and Clinical Pharmacology, 6, 17–20.
Hirota, K., Ooka, M., Shimizu, N., Yamada, K., Tsuda, M., Ibrahim, M. A., Yamada, S., Sasanuma, H., Masutani, M., & Takeda, S. (2022). XRCC1 counteracts poly(ADP ribose)polymerase (PARP) poisons, olaparib and talazoparib, and a clinical alkylating agent, temozolomide, by promoting the removal of trapped PARP1 from broken DNA. Genes to Cells, 27, 331–344.
Hirota, K., Sonoda, E., Kawamoto, T., Motegi, A., Masutani, C., Hanaoka, F., Szüts, D., Iwai, S., Sale, J. E., Lehmann, A., et al. (2010). Simultaneous disruption of two DNA polymerases, Polη and Polζ, in Avian DT40 cells unmasks the role of Polη in cellular response to various DNA lesions. PLoS Genetics, 6, e1001151.
Hirota, K., Tsuda, M., Mohiuddin, Tsurimoto, T., Cohen, I. S., Livneh, Z., Kobayashi, K., Narita, T., Nishihara, K., Murai, J., et al. (2016). In vivo evidence for translesion synthesis by the replicative DNA polymerase δ. Nucleic Acids Research, 44, 7242–7250.
Hirota, K., Yoshikiyo, K., Guilbaud, G., Tsurimoto, T., Murai, J., Tsuda, M., Phillips, L. G., Narita, T., Nishihara, K., Kobayashi, K., et al. (2015). The POLD3 subunit of DNA polymerase δ can promote translesion synthesis independently of DNA polymerase ζ. Nucleic Acids Research, 43, 1671–1683.
Holzer, S., Rzechorzek, N. J., Short, I. R., Jenkyn-Bedford, M., Pellegrini, L., & Kilkenny, M. L. (2019). Structural basis for inhibition of human primase by arabinofuranosyl nucleoside analogues fludarabine and vidarabine. ACS Chemical Biology, 14, 1904–1912.
Honma, Y., & Niitsu, N. (2000). Vidarabine and 2-deoxycoformycin as antileukemic agents against monocytic leukemia. Leukaemia & Lymphoma, 39, 57–66.
Ji, K., Kogame, T., Choi, K., Wang, X., Lee, J., Taniguchi, Y., & Takeda, S. (2009). A novel approach using DNA-repair-deficient chicken DT40 cell lines for screening and characterizing the genotoxicity of environmental contaminants. Environmental Health Perspectives, 117, 1737–1744.
Kawasumi, R., Abe, T., Psakhye, I., Miyata, K., Hirota, K., & Branzei, D. (2021). Vertebrate CTF18 and DDX11 essential function in cohesion is bypassed by preventing WAPL-mediated cohesin release. Genes & Development, 35, 1368–1382.
Kikuchi, K., Taniguchi, Y., Hatanaka, A., Sonoda, E., Hochegger, H., Adachi, N., Matsuzaki, Y., Koyama, H., van Gent, D. C., Jasin, M., et al. (2005). Fen-1 facilitates homologous recombination by removing divergent sequences at DNA break ends. Molecular and Cellular Biology, 25, 6948–6955.
Kline, J., & Larson, R. A. (2006). Nelarabine in the treatment of refractory T-cell malignant diseases. Expert Opinion on Pharmacotherapy, 7, 1791–1799.
Kobayashi, K., Guilliam, T. A., Tsuda, M., Yamamoto, J., Bailey, L. J., Iwai, S., Takeda, S., Doherty, A. J., & Hirota, K. (2016). Repriming by PrimPol is critical for DNA replication restart downstream of lesions and chain-terminating nucleosides. Cell Cycle, 15, 1997–2008.
Kobayashi, S., Kasaishi, Y., Nakada, S., Takagi, T., Era, S., Motegi, A., Chiu, R. K., Takeda, S., & Hirota, K. (2015). Rad18 and Rnf8 facilitate homologous recombination by two distinct mechanisms, promoting Rad51 focus formation and suppressing the toxic effect of nonhomologous end joining. Oncogene, 34, 4403–4411.
Korona, D. A., Lecompte, K. G., & Pursell, Z. F. (2011). The high fidelity and unique error signature of human DNA polymerase epsilon. Nucleic Acids Research, 39, 1763–1773.
Lee, T. H., & Kang, T. H. (2019). DNA oxidation and excision repair pathways. International Journal of Molecular Sciences, 20, 6092.
Martin, R. W., Orelli, B. J., Yamazoe, M., Minn, A. J., Takeda, S., & Bishop, D. K. (2007). RAD51 up-regulation bypasses BRCA1 function and is a common feature of BRCA1-deficient breast tumors. Cancer Research, 67, 9658–9665.
Morrison, C., Sonoda, E., Takao, N., Shinohara, A., Yamamoto, K., & Takeda, S. (2000). The controlling role of ATM in homologous recombinational repair of DNA damage. EMBO Journal, 19, 463–471.
Mouhieddine, T. H., Nokkari, A., Itani, M. M., Chamaa, F., Bahmad, H., Monzer, A., El-Merahbi, R., Daoud, G., Eid, A., Kobeissy, F. H., et al. (2015). Metformin and Ara-a effectively suppress brain cancer by targeting cancer stem/progenitor cells. Frontiers in Neuroscience, 9, 442.
Murakami, T., Takano, R., Takeo, S., Taniguchi, R., Ogawa, K., Ohashi, E., & Tsurimoto, T. (2010). Stable interaction between the human proliferating cell nuclear antigen loader complex Ctf18-replication factor C (RFC) and DNA polymerase epsilon is mediated by the cohesion-specific subunits, Ctf18, Dcc1, and Ctf8. Journal of Biological Chemistry, 285, 34608–34615.
Nakazato, A., Kajita, K., Ooka, M., Akagawa, R., Abe, T., Takeda, S., Branzei, D., & Hirota, K. (2018). SPARTAN promotes genetic diversification of the immunoglobulin-variable gene locus in avian DT40 cells. DNA Repair (Amst), 68, 50–57.
Nick McElhinny, S. A., Gordenin, D. A., Stith, C. M., Burgers, P. M., & Kunkel, T. A. (2008). Division of labor at the eukaryotic replication fork. Molecular Cell, 30, 137–144.
Niitsu, N., Yamamoto-Yamaguchi, Y., Kasukabe, T., Okabe-Kado, J., Umeda, M., & Honma, Y. (2000). Antileukemic efficacy of 2-deoxycoformycin in monocytic leukemia cells. Blood, 96, 1512–1516.
Ogilvie, K. K., Slotin, L., & Rheault, P. (1971). Novel substrate of adenosine deaminase. Biochemical and Biophysical Research Communications, 45, 297–300.
Ooka, M., Abe, T., Cho, K., Koike, K., Takeda, S., & Hirota, K. (2018). Chromatin remodeler ALC1 prevents replication-fork collapse by slowing fork progression. PLoS ONE, 13, e0192421.
Pandit, B., & Royzen, M. (2022). Recent development of prodrugs of gemcitabine. Genes (Basel), 13, 466.
Pommier, Y., Huang, S. Y., Gao, R., Das, B. B., Murai, J., & Marchand, C. (2014). Tyrosyl-DNA-phosphodiesterases (TDP1 and TDP2). DNA Repair (Amst), 19, 114–129.
Quinet, A., Carvajal-Maldonado, D., Lemacon, D., & Vindigni, A. (2017). DNA fiber analysis: mind the gap! Methods in Enzymology, 591, 55–82.
Rashbaum, S. A., & Cozzarelli, N. R. (1976). Mechanism of DNA synthesis inhibition by arabinosyl cytosine and arabinosyl adenine. Nature, 264, 679–680.
Robak, T. (2011). New nucleoside analogs for patients with hematological malignancies. Expert Opinion on Investigational Drugs, 20, 343–359.
Saberi, A., Nakahara, M., Sale, J. E., Kikuchi, K., Arakawa, H., Buerstedde, J. M., Yamamoto, K., Takeda, S., & Sonoda, E. (2008). The 9-1-1 DNA clamp is required for immunoglobulin gene conversion. Molecular and Cellular Biology, 28, 6113–6122.
Sadowski, L. A., Upadhyay, R., Greeley, Z. W., & Margulies, B. J. (2021). Current drugs to treat infections with herpes simplex viruses-1 and -2. Viruses, 13, 1228.
Shimizu, N., Ooka, M., Takagi, T., Takeda, S., & Hirota, K. (2015). Distinct DNA damage spectra induced by ionizing radiation in normoxic and hypoxic cells. Radiation Research, 184, 442–448.
Short, N. J., Rytting, M. E., & Cortes, J. E. (2018). Acute myeloid leukaemia. Lancet, 392, 593–606.
Sinha, R. P., & Häder, D. P. (2002). UV-induced DNA damage and repair: A review. Photochemical & Photobiological Sciences, 1, 225–236.
Stokes, K., Winczura, A., Song, B., Piccoli, G., & Grabarczyk, D. B. (2020). Ctf18-RFC and DNA Pol ϵ form a stable leading strand polymerase/clamp loader complex required for normal and perturbed DNA replication. Nucleic Acids Research, 48, 8128–8145.
Tada, K., Kobayashi, M., Takiuchi, Y., Iwai, F., Sakamoto, T., Nagata, K., Shinohara, M., Io, K., Shirakawa, K., Hishizawa, M., et al. (2015). Abacavir, an anti-HIV-1 drug, targets TDP1-deficient adult T cell leukemia. Science Advances, 1, e1400203.
Takata, M., Sasaki, M. S., Sonoda, E., Morrison, C., Hashimoto, M., Utsumi, H., Yamaguchi-Iwai, Y., Shinohara, A., & Takeda, S. (1998). Homologous recombination and non-homologous end-joining pathways of DNA double-strand break repair have overlapping roles in the maintenance of chromosomal integrity in vertebrate cells. EMBO Journal, 17, 5497–5508.
Takizawa, Y., Qing, Y., Takaku, M., Ishida, T., Morozumi, Y., Tsujita, T., Kogame, T., Hirota, K., Takahashi, M., Shibata, T., et al. (2010). GEMIN2 promotes accumulation of RAD51 at double-strand breaks in homologous recombination. Nucleic Acids Research, 38, 5059–5074.
Tsuda, M., Kitamasu, K., Kumagai, C., Sugiyama, K., Nakano, T., & Ide, H. (2020). Tyrosyl-DNA phosphodiesterase 2 (TDP2) repairs topoisomerase 1 DNA-protein crosslinks and 3’-blocking lesions in the absence of tyrosyl-DNA phosphodiesterase 1 (TDP1). DNA Repair (Amst), 91–92, 102849.
Tsuda, M., Terada, K., Ooka, M., Kobayashi, K., Sasanuma, H., Fujisawa, R., Tsurimoto, T., Yamamoto, J., Iwai, S., Kadoda, K., et al. (2017). The dominant role of proofreading exonuclease activity of replicative polymerase ε in cellular tolerance to cytarabine (Ara-C). Oncotarget, 8, 33457–33474.
Valente, D., Gentileschi, M. P., Guerrisi, A., Bruzzaniti, V., Morrone, A., Soddu, S., & Verdina, A. (2022). Factors to consider for the correct use of γH2AX in the evaluation of DNA double-strand breaks damage caused by ionizing radiation. Cancers (Basel), 14, 6204.
Wang, D., Wu, W., Callen, E., Pavani, R., Zolnerowich, N., Kodali, S., Zong, D., Wong, N., Noriega, S., Nathan, W. J., et al. (2022). Active DNA demethylation promotes cell fate specification and the DNA damage response. Science, 378, 983–989.
Washif, M., Ahmad, T., Hosen, M. B., Rahman, M. R., Taniguchi, T., Okubo, H., Hirota, K., & Kawasumi, R. (2023). CTF18-RFC contributes to cellular tolerance against chain-terminating nucleoside analogs (CTNAs) in cooperation with proofreading exonuclease activity of DNA polymerase ε. DNA Repair (Amst), 127, 103503.
Witkowski, J. T., Robins, R. K., Sidwell, R. W., & Simon, L. N. (1972). Design, synthesis, and broad spectrum antiviral activity of 1-D-ribofuranosyl-1,2,4-triazole-3-carboxamide and related nucleosides. Journal of Medicinal Chemistry, 15, 1150–1154.
Yamamoto, K. N., Kobayashi, S., Tsuda, M., Kurumizaka, H., Takata, M., Kono, K., Jiricny, J., Takeda, S., & Hirota, K. (2011). Involvement of SLX4 in interstrand cross-link repair is regulated by the Fanconi anemia pathway. Proceedings of the National Academy of Sciences, 108, 6492–6496.
Yoshikiyo, K., Kratz, K., Hirota, K., Nishihara, K., Takata, M., Kurumizaka, H., Horimoto, S., Takeda, S., & Jiricny, J. (2010). KIAA1018/FAN1 nuclease protects cells against genomic instability induced by interstrand cross-linking agents. Proceedings of the National Academy of Sciences United States of America, 107, 21553–21557.
Yoshimura, M., Kohzaki, M., Nakamura, J., Asagoshi, K., Sonoda, E., Hou, E., Prasad, R., Wilson, S. H., Tano, K., Yasui, A., et al. (2006). Vertebrate POLQ and POLbeta cooperate in base excision repair of oxidative DNA damage. Molecular Cell, 24, 115–125.
Zhang, C., Han, M., Zhang, F., Yang, X., Du, J., Zhang, H., Li, W., & Chen, S. (2020). Enhancing antitumor efficacy of nucleoside analog 5-fluorodeoxyuridine on HER2-overexpressing breast cancer by affibody-engineered DNA nanoparticle. International Journal of Nanomedicine, 15, 885–900.
Acknowledgements
The authors would like to thank Dr. Takuya Abe for sharing the SA2−/− DT40 cells, Dr. Toyofumi Yamaguchi for sharing the reagents, Ms. Minami Fukuchi for her assistance in deriving the preliminary data. This work was partially supported by the Network-Type Joint Usage/Research Center for Radiation Disaster Medical Science of Hiroshima University, Nagasaki University, and Fukushima Medical University, Japan. Financial support was also provided by grants from JSPS KAKENHI (JP21K19235, JP20H04337, and JP19KK0210), Tokyo Metropolitan Government Advanced Research Grant Number (R3-2), Takeda Science Foundation, and Yamada Science Foundation for K. H, and JSPS KAKENHI (JP22K15040) for R.K.
Funding
Open access funding provided by Tokyo Metropolitan University.
Author information
Authors and Affiliations
Corresponding authors
Ethics declarations
Conflict of interest
The authors declare no conflicts of interest.
Supplementary Information
Below is the link to the electronic supplementary material.
Rights and permissions
Open Access This article is licensed under a Creative Commons Attribution 4.0 International License, which permits use, sharing, adaptation, distribution and reproduction in any medium or format, as long as you give appropriate credit to the original author(s) and the source, provide a link to the Creative Commons licence, and indicate if changes were made. The images or other third party material in this article are included in the article's Creative Commons licence, unless indicated otherwise in a credit line to the material. If material is not included in the article's Creative Commons licence and your intended use is not permitted by statutory regulation or exceeds the permitted use, you will need to obtain permission directly from the copyright holder. To view a copy of this licence, visit http://creativecommons.org/licenses/by/4.0/.
About this article

Cite this article
Rahman, M.R., Hirota, K. & Kawasumi, R. Proofreading exonuclease activity of replicative polymerase epsilon promotes cellular tolerance to arabinosides in CTF18-dependent and -independent manner. GENOME INSTAB. DIS. 5, 76–88 (2024). https://doi.org/10.1007/s42764-024-00124-w
Received:
Revised:
Accepted:
Published:
Issue Date:
DOI: https://doi.org/10.1007/s42764-024-00124-w