
Abstract
Early malaria diagnosis improves outcomes during malaria treatment; routine diagnostic techniques rely on blood samples obtained invasively. Therefore, this study used infra-red (IR) spectroscopy coupled with Principle Component Analysis (PCA) to study the urinary profile of malaria patients and that of controls aimed at understanding metabolite perturbation during malaria infection so as to contribute towards development of non-invasive malaria diagnosis methods. Freeze dried human urine samples form malaria infected individuals (cases) and controls were screened in the IR region of 4000 cm−1 to 600 cm−1 and overall spectral differences were observed at wave numbers 1618 cm−1, 1679 cm−1 (amino acids). Peaks at 3030 cm−1 (NH4+) and 940 cm−1 (O–H of carboxylic acids) showed high absorbance in patients compared to controls. Liquid-chromatography–mass spectrometry (LC–MS/MS) was used to quantify amino acids in the urine samples and the results indicated a significant increase of amino acid cystine (P = 0.012). Lysine and tyrosine also increased in patients compared to controls. The use of IR-PCA differentiated clusters of urine samples from patients with malaria from control and the demonstrated amino acid perturbation is consistent with malaria infection. This data provides baseline information for application in development of a non-invasive diagnostic tests for malaria.
Article Highlights
-
1.
Infrared (IR) spectroscopy and Principle Component Analysis (PCA) were used to differentiate urine of malaria patients from controls.
-
2.
LC–MS/MS was used to determine creatinine, tyrosine, cystine, lysine and histidine in urine from malaria patients and controls
-
3.
The average concentration of cystine in patients and controls urine differed significantly.
1 Introduction
Malaria is a disastrous mosquito-borne disease caused by protozoan parasites of the genus Plasmodium including: Plasmodium falciparum, Plasmodium vivax, Plasmodium malariae, Plasmodium ovale and Plasmodium knowlesi [1]. Plasmodium falciparum is the deadliest [2] and most prevalent on the African continent where malaria still exacts a large disease burden [3]. For example in 2022, out of the 249 million malaria cases in 85 malaria endemic countries globally, 93.6% of cases and 95.4% of deaths were from World Health Organization (WHO) African region, with children under the age of 5 years accounting for 78.1% of all malaria deaths in that year [4]. Preventive measures including seasonal malaria chemoprevention [5] and personal protection against mosquito bites [6, 7] have been used although malaria incidence is still high. In Uganda, the WHO reported an estimated 12.7 million malaria cases and over 17,556 deaths in the year 2022 [4] showing that malaria is a significant threat to health, therefore efforts should be made towards malaria control and management. Early diagnosis and treatment of malaria contributes to reducing transmission and prevents deaths [8, 9], therefore it is key.
The gold standard for malaria diagnosis is microscopy where a blood sample is drawn from a patient and examined for presence of plasmodium. Microscopic examination of Giemsa-stained blood thick smears (1.0 × 10⁶ RBCs) or thin blood smears (1.25 × 10⁵ RBCs) is used to confirm presence of plasmodium based on the morphological features after examination with 100X oil immersion objective [10, 11]. The accuracy of diagnosis can be challenging even to expert microscopists; therefore, other techniques have been developed. For example, Rapid Diagnostic Tests (RDTs) which rely on the detection of P. falciparum histidine-rich protein 2 (PfHRP2) or its structural homolog PfHRP3, are commonly used today although they can also report false-positive and false-negatives [6].
The potential of using urine and saliva specimens for malaria diagnosis was investigated in Ghana where blood, saliva and urine were tested for malaria antigens PfHRP2 and parasite lactate dehydrogenase (pLDH). While the sensitivities of urine and saliva were low (35.2% and 57.0% respectively) the use of these non-blood specimens demonstrated a potential for use as non-invasive samples for malaria diagnosis although this approach was only useful in severe parasitemia > 60,000 parasites/µL [12]. Other diagnostic methods which use DNA probes, polymerase chain reaction (PCR) and fluorescent staining, have been reported [10] but require collection of capillary blood moreover molecular based methods are expensive and require more expertise [13].
Collection of a blood sample for diagnostic purposes is invasive and may expose both the health worker and patient to other infections arising from the manipulation of potentially infectious bodily fluids [14] therefore, non-invasive alternative diagnostic methods could be an added advantage. Non-invasive tests for malaria such as the detection of plasmodia parasite antigens or DNA in samples such as saliva, urine or buccal mucosa [12, 13] and the use of skin volatiles as predictors of infection status [13,14,15] have been proposed. Most of these methods are still in their infancy, although the use of saliva- and urine-based tests is well advanced for diagnosis of other infections [13].
Severe Plasmodium falciparum infection results in alteration of microvasculature of various tissues such as liver, kidney and intestines due to isolation of parasitized red blood cells, leading to possible metabolic stress [16]. Late stages of malaria result in complications due to inflammatory immune responses and one or more conditions such as cerebral malaria, renal damage, liver damage, severe anaemia, acidosis and hypoglycaemia which may lead to death [17]. Manifestations of malaria are associated with drastic metabolic alterations in the host, therefore, assessing metabolites in body fluids and tissues can potentially provide information on metabolite changes during malaria infection [18, 19].
Urine is an ideal bio-fluid for disease study because it is rich in metabolites, readily available, easily obtained, can be collected in large volumes and is mostly free from interfering proteins or lipids compared to other body fluids [20,21,22]. Urine has been used in metabolite profiling studies due to its low protein content and limited sample pre-treatment; moreover, it can be collected non-invasively and longitudinally [19, 20, 23]. Approximately 5661 metabolites have been documented in urine [22], associated with about 600 human conditions [23] including obesity, cancer, inflammation neurological disease, and other infectious diseases.
A large number of metabolite profiling reports rely on high end techniques such as LC–MS [11, 19, 24], yet these techniques are not readily available in low and developing economies, therefore, in this study, human urine was investigated for potential metabolite fingerprinting associated with plasmodium malaria infection using Infrared (IR) spectroscopy coupled with chemometry. Infrared spectroscopy of urine has shown potential application in non-invasive cancer diagnosis [25,26,27] and has also been used in the detection of malaria parasites in blood [28, 29]. In this study, we explored the application of Infrared spectroscopy to distinguish between urine of malaria patients and controls in South Western Uganda in an attempt to determine molecular signatures associated with malaria infection. Identification of molecules perturbed during malaria infection can contribute towards development of non-invasive diagnostic kits or methods; hence liquid chromatography–mass spectrometry (LC–MS) was used to validate potential metabolite markers. The information obtained from this study provides baseline information for future development of a non-invasive technique for malaria diagnosis.
2 Materials and methods
2.1 Study site
The study was done in Mbarara City, located in the South Western region of Uganda. Mbarara City the second largest city after Kampala (Latitude of 0.6072° S longitude of 30.6545° E) and about 167 miles (270 km) southwest of Kampala as shown in Fig. 1.

Map of Mbarara City showing the health facilities from which samples were collected
2.2 Study design
A mixed method design was used to collect qualitative and quantitative data. A case–control study design was used; urine samples were collected from malaria patients (cases), who were confirmed Plasmodium falciparum positive using blood film microscopy regardless of the level of parasitemia, before treatment. Controls were sex-matched healthy people with similar age to the cases and had negative test results for malaria. Participants in this study were children (3–5 years), adolescents (10–19) and adults (20–50 years). Only children who were toilet trained were selected in order to collect mid-stream urine which reduces the risk of bacterial contamination. All genders participated and a primary screening included a physician taking a brief history of the participants and a simple urinalysis. Inclusion criteria: Non-obese (BMI < 30 kg/m2), non-pregnant or lactating for women, not diagnosed with a chronic or acute disease (apart from malaria), and not receiving any other drugs, and supplements. Exclusion criteria: Detection of: leucocyte, protein, glucose, bilirubin and nitrite, urine pH less than 5 or more than 7 and urinary system complaints [29]. Qualitative data including demographics data about patients was collected using a questionnaire.
2.3 Ethics approval and consent to participate
All experiments were performed in accordance with the Uganda National Guidelines for Research involving Humans as Research Participants [30]. Informed consent was provided by all the participants (parents/guardians in case of participants under the age of 18 years). Ethical clearance was obtained from Mbarara University Research and Ethics Committee (MUST-2022-590).
2.4 Sample collection, preparation and storage
Mid-stream urine (40 ml) was collected randomly [31] from 112 participants (41 patients and 71 controls) whose malaria status had been confirmed through microscopy diagnosis. The microscopy samples were assigned (+) for < 100 parasites/µl of blood (mild malaria), (++) for 100–9999 parasites/µl of blood (moderate malaria), and (+++) for ≥ 10,000 parasite/µl of blood (severe malaria) [32]. Urine samples were self-collected into clean urine containers in adults while children (3–5 years), collected samples with the help of the parent/guardian and the laboratory technologist and carried in a cool box; no preservatives were used. Simple urinalysis was done to check for any unwanted contaminants using reagent strips [11]. Centrifugation was done at 2000 rpm for 15 min using LC-3000 centrifuge to remove insoluble materials and cellular debris and samples were stored at − 20 °C awaiting freeze drying. Urine samples (30 ml) were freeze-dried using Benchtop Freeze Dryer to remove excess water by placing a sample which was previously frozen at − 80 °C under a vacuum at − 86− and 1 Pascal allowing direct change of the ice to vapour without passing through liquid phase for 18 h.
2.5 Sample analysis using infra-red
The freeze-dried sample (1 mg) was re-dissolved in acetonitrile (1 ml) and vortexed for 2 min. The reconstituted urine sample (5 µl) was dropped onto the diamond crystal surface in an Infrared Spectrophotometer (IR) (Buck 530) and scanned for 3 min in the range from 4000 cm−1 to 600 cm−1 after correction for background interference. The diamond crystal was cleaned with acetonitrile after running each sample [29].
2.6 Sample analysis using LC–MS
2.6.1 Analytical method validation
Amino acids standards (Glentham Life Sciences) were used for preparation of stock solutions by dissolving in LC–MS grade water containing 0.1% formic acid. Working standards solutions were made by diluting of stock solutions. Amino acids solution mixtures of 10, 20, 50,100, 200 and 500 ppb in milli-Q water containing 0.1% formic acid were run and calibration curves were obtained by plotting the peak area against the concentration of the standard analysed. Confirmation of the amino acids was performed based on multiple reaction monitoring (MRM) transitions of the parent and daughter ions for each analyte. Analytical method parameters are indicated in supplementary data.
2.6.2 Quality assurance and quality control procedures
The samples were collected in clean urine containers without any preservatives, prepared and stored in the freezer (− 20 °C) within 30 min of collection to ensure integrity. Freeze-drying of the samples was done to increase the stability of the analytes. The repeatability of the data and stability of the IR equipment were determined by running one sample six times followed by data analysis using Kruskal Wallis ANOVA. LC–MS/MS parameters were verified by determining repeatability, linearity, limit of detection (LOD) and limit of quantification (LOQ). Repeatability was done by analysing each standard six times at two different concentrations: 10 ppb and 500 ppb. Linearity was based on the calibration curves of amino acids mixture within the range of 10 to 500 ppb. The LC–MS/MS LODs and LOQs were defined as the amino acids concentrations required to produce signal to noise ratio of 3:1 and 10:1 respectively. All laboratory and clinical data were entered into the corresponding logbooks and transcribed into Excel worksheet (Windows 10, Microsoft Inc., and Richmond, Washington 2011) and analysed with Origin Pro version 2017 SR26.
2.6.3 Determination of amino acids in urine samples using LC–MS/MS
The freeze-dried urine sample (0.01 mg) was dissolved in 1mL milli-Q-water containing 0.1% formic acid, then filtered through a 0.22 µm syringe -adaptable filter into LC vials and later diluted for analysis. An Agilent 1100 series liquid chromatograph (LC) coupled with a Waters triple quadruple micromass Quattro ultima Mass Spectrometer (MS) operated in positive and negative electrospray ionization (ESI) mode was employed in analysis of the urine samples. The LC–MS/MS analysis was performed using a mobile phase made up of milli-Q- water containing 0.1% formic acid (A) and acetonitrile containing 0.1% formic acid (B) at flow rate of 0.45 ml/min and a pressure of 400 bar; the LC program is shown in Table 1. The standards and samples (10 µl) were injected by an autosampler onto a Kinetex column (5 µm, 100 × 3 mm, 100A EVO C18). The column temperature was maintained at 40 °C. The MS parameters were: desolation temperature of 350 °C, source temperature of 120 °C and gas flow rate of 706 L/Hr. The total LC–MS/MS run time was 8 min. Qualitative and quantitative analysis was done in multiple reaction mode (MRM). Identification and confirmation of the peaks was done based on retention times and comparison of ratios of MRM transitions from the precursor ions to product ions in samples and standards.
3 Results and discussion
3.1 Study population demographics and urinalysis
Out of 100 controls who had initially been selected, 29 had abnormal urine results as shown in Table 2, and were therefore excluded from the study. All the 41 patients who were in the inclusion criteria were included regardless of their urinalysis results because malaria poses some urinary abnormalities such as haematuria, proteinuria, urobilinogenuria and bilirubinuria [32,33,34] hence a total of 112 participants were finally included.
3.2 Infra-red (IR) spectroscopy screening of urine from patients and controls
Generally, male and female controls urine spectral profiles were similar and this agrees with the work done by Sarigul et al., [29]. The spectral profile for all controls was generally similar in the fingerprint region of 1800–600 cm−1, variation was observed in the regions 1676–1614 cm−1 and in region 1445–1434 cm−1 where the intensities in females were higher than in males as shown in Fig. 2. The average spectra of all patients and controls regardless of sex is shown in Fig. 3, the profile for patients and that of controls differed at wave numbers about 3030, 1594, 1454 and 940 cm−1. Principle component analysis (PCA) was used to determine whether patients and control urine samples could be distinguished. PCA was done on normalized data because normalization reduces variance which is not associated with spectral characteristics of samples [35]. Figure 4 is the PCA plot showing that urine from patients and controls could be distinguished. Table 3 shows the relationship between wave numbers and principal components; the observed wave numbers were assigned to functional groups based on literature [29, 35, 36].

Average spectra of patients and controls

Average infra-red spectra from urine of malaria patients (B) and controls (A)

Showing score plot of controls and patients
Based on the loadings (Table 3), the first 3 principal components (PC) explained 90.7% of total variation. PC1 was negatively correlated to the wave numbers 1312, 2969, 3056, and 3362 cm−1 which were assigned to C–N stretching in aromatic amines, C–H and N–H stretching (Table 3). PC2 was positively correlated to 865, 1070, 1150, 1200, 1679 and 3449 cm−1 and also negatively correlated to 1946 cm−1, these peaks were assigned to NH2, S=O, P–O bonds. PC3 was positively correlated to 1438, 1679 cm−1 and negatively correlated to 959 cm−1 and the wave numbers were assigned to C–H bending, C=N; N–H stretching and O–H bend, S–O stretch and P–OH stretching. The wave numbers were associated with amino groups, phosphates, sulphates and carboxylic acids [29, 36] which are functional groups associated with amino acids, implying that amino acids may be perturbed during malaria infection. A common peak at about 1438 cm−1 which is associated with C–H bending in lipids was observed in all controls.
Peak at wave number 1618 cm−1 and 1679 cm−1 (related to N–H functional group) had high intensities in controls than in malaria patients. The reduction in patients may be due to amino acid metabolism during Plasmodium falciparum infection. The parasites and the infected red blood cells have limited capabilities for amino acid biosynthesis [38] and therefore utilize the host cell haemoglobin and plasma free amino acids for protein synthesis [36,37,38,39,40]; for example the parasite’s glutamate dehydrogenase utilizes glutamine as shown in equation (i) for its primary source of parasite NADPH [39, 40];
The peak at 3030 cm−1 (C–H, NH4+ ring stretching) had high intensity in patients compared to controls. This could be as a result of the substantial amount of ammonia produced as a catabolic by-product by Plasmodium falciparum, during malaria infection as shown in equation (i) [37,38,39] or it may be associated with amino acids. The peak at 940 cm−1 (O–H stretching of a carboxylic acid) also showed a high intensity in patients compared to controls. Parasite sequestration results into tissue hypoxia which increases the chances of anaerobic glycolysis. This could result in build-up of lactic acid leading to metabolic acidosis. Lactate clearance is decreased during malaria infection due to liver dysfunction, suppressed glycogenesis and decreased hepatic flow [42]. The wave numbers 959 cm−1 (O–H bend, S–O, P–OH), 3030 cm −1(C–H (ring) stretching, symmetric NH4 stretching), 1618 (C=C stretching, N–H bend (primary amine) and 1679 cm−1 (C=N stretching, C=O stretching) were responsible for differentiating controls and patients. These functional groups (phosphate, amine, carboxylic acid, sulphate,) can be found in amino acids, alluding to amino acid perturbation during Plasmodium falciparum infection.
Based on the Mann–Whitney U test, the urine spectra of controls and patients were not significantly different at a 5% level of significance (z = 0.39) perhaps because all the metabolites present in the urine of controls are also observed in urine patients although the absorbance intensity may differ. PCA showed the samples and controls in different clusters as shown in Fig. 4, implying that intensities of the metabolites differ. Since the prominent peaks were associated with functional groups found in amino acids, samples were subjected to liquid chromatography–tandem mass spectrometry (LC–MS/MS) to establish variations in amino acid concentrations between controls and urine samples from malaria patients.
3.3 LC–MS/MS analysis of amino acid in urine samples
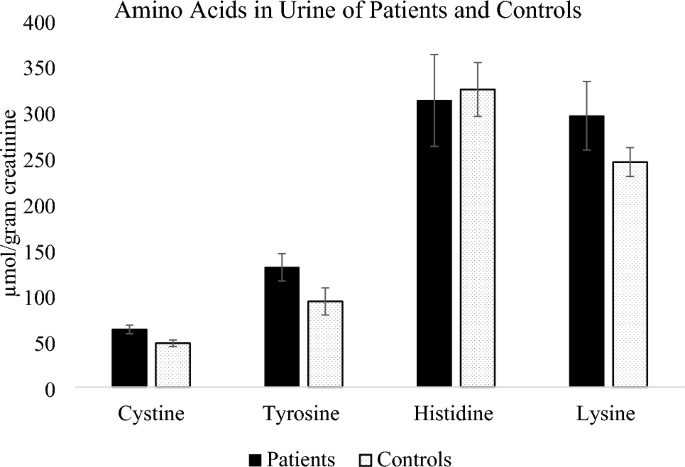
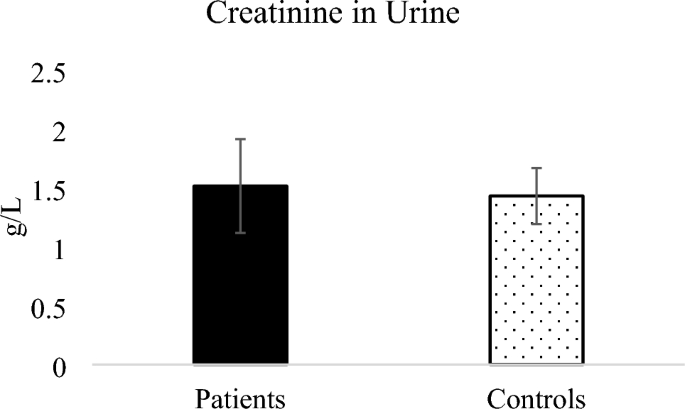
Five amino acids including cystine, tyrosine, histidine, lysine and creatinine were detected in the urine samples from patients and controls and were therefore quantified. Figure 5 shows the amino acids cystine, tyrosine, histidine and lysine expressed in terms of urinary creatinine while Fig. 6 shows the concentration of urinary creatinine in controls and patients urine.
Mean values of amino acids in urine expressed in µmol/g creatinine
Mean creatinine in urine of patients and controls
Amino acids cystine, tyrosine and lysine were higher in patients compared to controls, while histidine was slightly higher in controls. The mean concentration of cystine in both patients and controls was within the normal daily excretion of cystine ranges from 0 to 100 μmol/g creatinine [43] but the mean values were significantly different (P = 0.012). In terms of parasitemia, the patients’ distribution was 36.6% mild malaria, 58.5% moderate malaria and only 4.9% severe malaria. Since severe malaria cases were few, they were considered with moderate malaria cases while assessing the influence of parasitemia on the concentration of amino acids in urine. Amino acids cystine and lysine slightly increased with parasitemia although the increase was not statistically significant as shown in Table 4. Cystine is the predominant form of extracellular cysteine [44] and cysteine can be rapidly oxidized to produce cystine in presence of oxygen [45], the cystine/cysteine redox cycle is major regulator of cell survival [46].
Higher cysteine concentrations in P. falciparum malaria patients has been previously reported in plasma [47] with the level of cysteine found to positively correlate to malaria parasitemia in previous studies [48], thus infection with P. falciparum can be associated with increased cystine/cysteine in human urine.
Tyrosine was also higher in patients compared to controls although the difference between the means was not statistically significant (P = 0.091). Higher values of tyrosine in malaria was previously reported by Conroy et al. [49] where plasma tyrosine levels were found to increase significantly during falciparum malaria in children. Tyrosine is primarily metabolized in the liver and its metabolism might be altered since malaria results in liver damage when sporozoites infect liver cells [50]. Lysine was higher in patients compared to controls although the difference between the mean values of patients and controls did not differ significantly (P = 0.168). Lysine was reported to increase in sera of mice infected with Plasmodium berghei [16], thus dysregulation of lysine can be associated with plasmodium infection.
Histidine average amounts in urine of patients was lower than in controls although the means did not differ significantly (P = 0.827). Elevated levels of Plasmodium falciparum histidine rich protein-2 (pfHRP2) were reported in severe Plasmodium falciparum in blood [51], thus the pfHRP2 is usually used as a diagnostic marker for malaria in blood, however in our study amino acid histidine in patients was lower than in controls.
Creatinine in urine of malaria patients was higher than that in controls as shown in Fig. 6 however the means of creatinine from patients and controls were not significantly different (P = 0.85). Increased serum creatinine levels in mild and severe malaria was reported for patients [49, 50,52, 53] and has been described as among useful biochemical indicators to evaluate prognosis for malaria because patients with a high level of creatinine needed a longer duration for parasite clearance [54]. Elevated creatinine due to malaria infection was for Plasmodium vivax malaria showing that malaria infection affects renal function [55].
4 Conclusions and recommendations
This study evaluated the potential of using Infrared spectroscopy (IR) coupled with principal component analysis (PCA) in distinguishing between urine samples from people infected with malaria and controls. PCA scatter plots demonstrated a difference in clustering of patients’ urine and controls therefore IR-coupled with chemometry can potentially be applied in screening for malaria. A validation using LC–MS/MS study revealed dysregulation of amino acid cystine and an increase in creatinine alluding to potential renal injury as a result of malaria infection. The difference in amino acid concentration was observed even for mild to moderate malaria (< 100–9999 parasites/µl of blood)[12].Therefore, IR enabled identification of functional groups assigned to amino acids implying that malaria affects amino acid metabolism. This study was limited by few severe malaria cases and it was a case control study. In future metabolite finger printing with a higher resolution instrument can be done of all metabolites in the urine of patients and controls. A longitudinal study to assess the changes in the entire metabolite profile and how it varies with parasitemia during infection and after treatment can contribute more useful information.
Data availability
Data that support the findings of this study are within in text and in the supplementary file. Data on participants identity can be shared in coded formats to protect their identities on request from the corresponding author, using email gbirungi@must.ac.ug.
References
Hasselquist D, Hellgren O, Krizanauskiene A, Pe J, Bensch S. What are malaria parasites ? 2005; 21(5): 209–211. https://doi.org/10.1016/j.pt.2005.03.007.
Pance A. Diversify and conquer: the vaccine escapism of Plasmodium falciparum. Microorganisms. 2020;8(11):1–21. https://doi.org/10.3390/microorganisms8111748.
Enato EFO, Okhamafe AO. Plasmodium falciparum malaria and antimalarial interventions in sub-Saharan Africa: challenges and opportunities. Afr J Biotechnol SPEC ISS. 2005;4(13):1598–605. https://doi.org/10.4314/ajfand.v4i13.71774.
World Health Organization. World malaria World malaria report report. World Health Organization; 2023.
Baba E, et al. Effectiveness of seasonal malaria chemoprevention at scale in west and central Africa: an observational study. Lancet. 2020;396(10265):1829–40. https://doi.org/10.1016/S0140-6736(20)32227-3.
Zimmerman PA, Howes RE. Malaria diagnosis for malaria elimination. Curr Opin Infect Dis. 2015;28(5):446–54. https://doi.org/10.1097/QCO.0000000000000191.
Conteh L, Shuford K, Agboraw E, Kont M, Kolaczinski J. Costs and cost-effectiveness of malaria control interventions: a systematic literature review. Value Heal. 2021;24(8):1213–22. https://doi.org/10.1016/j.jval.2021.01.013.
Satimai W, et al. Artemisinin resistance containment project in Thailand II: responses to mefloquine-artesunate combination therapy among falciparum malaria patients in provinces bordering Cambodia. Malaria J. 2012;11:1–13.
Plewes K, Leopold SJ, Kingston HWF, Dondorp AM. Malaria: what’s new in the management of malaria? Infect Dis Clin North Am. 2019;33(1):39–60. https://doi.org/10.1016/j.idc.2018.10.002.
Wongsrichanalai C, Barcus MJ, Muth S, Sutamihardja A, Wernsdorfer WH. A review of malaria diagnostic tools: microscopy and rapid diagnostic test (RDT). Am J Trop Med Hyg. 2007;77(SUPPL. 6):119–27. https://doi.org/10.4269/ajtmh.2007.77.119.
Abdelrazig S, et al. A metabolomic analytical approach permits identification of urinary biomarkers for Plasmodium falciparum infection: a case-control study. Malar J. 2017. https://doi.org/10.1186/s12936-017-1875-z.
Aninagyei E, Abraham J, Atiiga P, Antwi SD, Bamfo S, Acheampong DO. Evaluating the potential of using urine and saliva specimens for malaria diagnosis in suspected patients in Ghana. Malar J. 2020;19(1):1–9. https://doi.org/10.1186/s12936-020-03427-x.
Hazra RK. Overview of current diagnostic methods for malaria. Le Infez Med. 2018; 3: 199–203. https://pdfs.semanticscholar.org/6768/3e09628bbd02bf65663b033cd158676cbce7.pdf
Owusu EDA, Campillo A, Daily J, Ding XC. Acceptance and perceived value of non-invasive malaria diagnostic tests in malaria-endemic countries. Malar J. 2021;20(1):1–10. https://doi.org/10.1186/s12936-021-03911-y.
Rebelo M, Grenho R, Orban A, Hänscheid T. Transdermal diagnosis of malaria using vapor nanobubbles. Emerg Infect Dis. 2016;22(2):343–4. https://doi.org/10.3201/eid2202.151203.
Basant A, Rege M, Sharma S, Sonawat HM. Alterations in urine, serum and brain metabolomic profiles exhibit sexual dimorphism during malaria disease progression. Malar J. 2010;9:1–13.
Trampuz A, Jereb M, Muzlovic I, Prabhu RM. Clinical review: severe malaria. Crit Care. 2003;7(4):315–23. https://doi.org/10.1186/cc2183.
Zhang A, Sun H, Wu X, Wang X. Urine metabolomics. Clin Chim Acta. 2012;414:65–9. https://doi.org/10.1016/j.cca.2012.08.016.
Miller IJ, Peters SR, Overmyer KA, Paulson BR, Westphall MS, Coon JJ. Real-time health monitoring through urine metabolomics. NPJ Dig Med. 2019. https://doi.org/10.1038/s41746-019-0185-y.
Bouatra S, et al. The human urine metabolome. PLoS ONE. 2013. https://doi.org/10.1371/journal.pone.0073076.
Smolders R, Schramm KW, Nickmilder M, Schoeters G. Applicability of non-invasively collected matrices for human biomonitoring. Environ Heal A Glob Access Sci Source. 2009;8(1):1–10. https://doi.org/10.1186/1476-069X-8-8.
Qiu S, et al. Small molecule metabolites: discovery of biomarkers and therapeutic targets. Signal Transduct Target Ther. 2023;8(1):1–37. https://doi.org/10.1038/s41392-023-01399-3.
Waybright TJ, Van QN, Muschik GM, Conrads TP, Veenstra TD, Issaq HJ. LC-MS in metabonomics: optimization of experimental conditions for the analysis of metabolites in human urine. J Liq Chromatogr Relat Technol. 2006;29(17):2475–97. https://doi.org/10.1080/10826070600914638.
Zhu J, et al. Urine based near-infrared spectroscopy analysis reveals a noninvasive and convenient diagnosis method for cancers: a pilot study. PeerJ. 2023;11:1–16. https://doi.org/10.7717/peerj.15895.
Oliver KV, Vilasi A, Maréchal A, Moochhala SH, Unwin RJ, Rich PR. Infrared vibrational spectroscopy: A rapid and novel diagnostic and monitoring tool for cystinuria. Sci Rep. 2016. https://doi.org/10.1038/srep34737.
Ramirez CAM, et al. Infrared spectroscopy of urine for the non-invasive detection of endometrial cancer. Cancers (Basel). 2022. https://doi.org/10.3390/cancers14205015.
Goh B, et al. The application of spectroscopy techniques for diagnosis of malaria parasites and arboviruses and surveillance of mosquito vectors: a systematic review and critical appraisal of evidence. PLoS Negl Trop Dis. 2021;15(4):1–24. https://doi.org/10.1371/journal.pntd.0009218.
Sikulu-Lord M, et al. Rapid and non-invasive detection of malaria parasites using near-infrared spectroscopy and machine learning. PLoS ONE. 2023. https://doi.org/10.1371/journal.pone.0289232.
Sarigul N, Kurultak İ, Uslu Gökceoğlu A, Korkmaz F. Urine analysis using FTIR spectroscopy: a study on healthy adults and children. J Biophotonics. 2021. https://doi.org/10.1002/jbio.202100009.
UNCST. National guidelines for research involving humans as research participants. Gov. Uganda; 2014. p. 1–60.
Khamis MM, Adamko DJ, El-Aneed A. Mass spectrometric based approaches in urine metabolomics and biomarker discovery. Mass Spectrometry Rev. 2017;36:115–34. https://doi.org/10.1002/mas.21455.
Al-Mekhlafi HM, et al. Residual malaria in Jazan region, southwestern Saudi Arabia: the situation, challenges and climatic drivers of autochthonous malaria. Malar J. 2021;20(1):1–14. https://doi.org/10.1186/s12936-021-03846-4.
Ugwuja EI, Ugwu NC. Abnormal findings on dipstick urinalysis of out-patients with malaria in Abakaliki, Nigeria. J Vector Borne Dis. 2011;48(4):205–9.
da Silva JGB, Pinto JR, Barros EJG, Farias GMN, Daher EDF. Kidney involvement in malaria: an update. Rev Inst Med Trop Sao Paulo. 2017;59: e53. https://doi.org/10.1590/S1678-9946201759053.
Mishra P, et al. At-line and inline prediction of droplet size in mayonnaise with near-infrared spectroscopy. Infrared Phys Technol. 2022;123: 104155.
Coates J. Infrared spectral interpretation: a systematic approach. Infrared Spectr Interpret A Syst Approach. 2018. https://doi.org/10.1201/9780203750841.
Sarigul N, Korkmaz F, Kurultak I. A new artificial urine protocol to better imitate human urine. Sci Rep. 2019. https://doi.org/10.1038/s41598-019-56693-4.
Sherman IW. Amino acid metabolism and protein synthesis in malarial parasites. Bull World Health Organ. 1977;55(2–3):265–76.
Rubach MP, et al. Kinetic and cross-sectional studies on the genesis of hypoargininemia in severe pediatric Plasmodium falciparum malaria. Infect Immun. 2019. https://doi.org/10.1128/IAI.00655-18.
Kimoloi S, Rashid K. Potential role of Plasmodium falciparum-derived ammonia in the pathogenesis of cerebral malaria. Front Neurosci. 2015;9:1–12. https://doi.org/10.3389/fnins.2015.00234.
Zeuthen T, et al. Ammonia permeability of the aquaglyceroporins from Plasmodium falciparum, Toxoplasma gondii and Trypansoma brucei. Mol Microbiol. 2006;61(6):1598–608. https://doi.org/10.1111/j.1365-2958.2006.05325.x.
Na J, et al. Discovery of metabolic alterations in the serum of patients infected with Plasmodium spp. by high-resolution metabolomics. Metabolomics. 2020. https://doi.org/10.1007/s11306-019-1630-2.
Guillén M, Corella D, Cabello ML, García AM, Hernández-Yago J. Reference values of urinary excretion of cystine and dibasic aminoacids: classification of patients with cystinuria in the Valencian Community, Spain. Clin Biochem. 1999;32(1):25–30. https://doi.org/10.1016/S0009-9120(98)00087-3.
Combs JA, Denicola GM. The non-essential amino acid cysteine becomes essential for tumor proliferation and survival. Cancers (Basel). 2019. https://doi.org/10.3390/cancers11050678.
Baart GJE, et al. Modeling Neisseria meningitidis metabolism: from genome to metabolic fluxes. Genome Biol. 2007. https://doi.org/10.1186/gb-2007-8-7-r136.
Banjac A, et al. The cystine/cysteine cycle: a redox cycle regulating susceptibility versus resistance to cell death. Oncogene. 2008;27(11):1618–28. https://doi.org/10.1038/sj.onc.1210796.
Chillemi R, Zappacosta B, Simporè J, Persichilli S, Musumeci M, Musumeci S. Hyperhomocysteinemia in acute Plasmodium falciparum malaria: an effect of host-parasite interaction. Clin Chim Acta. 2004;348(1–2):113–20. https://doi.org/10.1016/j.cccn.2004.05.007.
Besouw M, Masereeuw R, Van Den Heuvel L, Levtchenko E. Cysteamine: an old drug with new potential. Drug Discov Today. 2013;18(15–16):785–92. https://doi.org/10.1016/j.drudis.2013.02.003.
Conroy AL, et al. Plasma amino acid concentrations in children with severe malaria are associated with mortality and worse long-term kidney and cognitive outcomes. J Infect Dis. 2022;226(12):2215–25. https://doi.org/10.1093/infdis/jiac392.
Al-Salahy M, Shnawa B, Abed G, Mandour A, Al-Ezzi A. Parasitaemia and its relation to hematological parameters and liver function among patients malaria in Abs, Hajjah, Northwest Yemen. Interdiscip Perspect Infect Dis. 2016;2016:5954394. https://doi.org/10.1155/2016/5954394.
Kwak JD, Young JJ, Stuij AC, Koelewijn R, van Hellemond JJ, van Genderen PJJ. A comparative study of Plasmodium falciparum histidine-rich protein 2 (PfHRP2) blood levels and peripheral blood parasitemia as parameters of disease severity in individuals with imported falciparum malaria. Travel Med Infect Dis. 2021;42: 102076. https://doi.org/10.1016/j.tmaid.2021.102076.
Onyeneke N, Oghenejode EC, Alumonah AM, Okwonko EO, Okpogba CJ. Serum urea and creatinine in Nigerian human patients. Glob J Med Sci. 2003;2:103–6.
Aich T. P. falciparum malaria induced renal impairment. J Med Res. 2019;5(6):220–3. https://doi.org/10.31254/jmr.2019.5605.
Bi D, et al. Biochemical characteristics of patients with imported malaria. Front Cell Infect Microbiol. 2022;12(November):1–10. https://doi.org/10.3389/fcimb.2022.1008430.
Cruz LAB, Barral-Netto M, Andrade BB. Distinct inflammatory profile underlies pathological increases in creatinine levels associated with Plasmodium vivax malaria clinical severity. PLoS Negl Trop Dis. 2018;12(3):1–14. https://doi.org/10.1371/journal.pntd.0006306.
Acknowledgements
The authors acknowledge funding from The Academy of Science in the Developing World TWAS Research Grant Award_21-264 RG/CHE/AF/AC_I-FR324031950.
Funding
The authors acknowledge funding from The Academy of Science in the Developing World TWAS Research Grant Award_21-264 RG/CHE/AF/AC_I-FR324031950.
Author information
Authors and Affiliations
Contributions
This work was conceptualized by Grace Birungi. Laboratory work and manuscript writing were done by Joan Beryl Achar, Denis Byamugisha and Grace Birungi.
Corresponding author
Ethics declarations
Competing interests
Authors declare no competing interests.
Additional information
Publisher's Note
Springer Nature remains neutral with regard to jurisdictional claims in published maps and institutional affiliations.
Supplementary Information
Below is the link to the electronic supplementary material.
Rights and permissions
Open Access This article is licensed under a Creative Commons Attribution 4.0 International License, which permits use, sharing, adaptation, distribution and reproduction in any medium or format, as long as you give appropriate credit to the original author(s) and the source, provide a link to the Creative Commons licence, and indicate if changes were made. The images or other third party material in this article are included in the article's Creative Commons licence, unless indicated otherwise in a credit line to the material. If material is not included in the article's Creative Commons licence and your intended use is not permitted by statutory regulation or exceeds the permitted use, you will need to obtain permission directly from the copyright holder. To view a copy of this licence, visit http://creativecommons.org/licenses/by/4.0/.
About this article

Cite this article
Birungi, G., Achar, J.B. & Byamugisha, D. Characterization of urinary metabolites associated with malaria infection using infra-red spectroscopy and liquid chromatography–mass spectrometry in South Western Uganda. Discov Appl Sci 6, 356 (2024). https://doi.org/10.1007/s42452-024-06061-3
Received:
Accepted:
Published:
DOI: https://doi.org/10.1007/s42452-024-06061-3