
Abstract
This study presents an electrocardiogram (ECG) monitoring and processing system which can observe subjects in real time and display the resultant ECG signals on a computer for observation. The primary application is for the remote observation of cardiac patients. This paper aims to determine its reliability by analysing its portability and wireless connectivity. The system is comprised of three principal units, namely the data acquisition circuit, where cardiac electrical signals are detected using three surface electrodes placed at three different positions on the chest wall to follow the Einthoven Triangle. The signals measured are amplified and filtered by components in a circuit and are then carried to a data processing unit where a ATmega328P microcontroller with a ZigBee interface module are used to transfer the biosignal wirelessly to the Graphical User Interface (GUI) unit which has the capacity to observe ECG biosignals on a computer. The results demonstrated that the design successfully produced a distortion-free signal, namely the hardware and software elements operated and intercommunicated correctly. In both LabVIEW and MATLAB configurations, the GUI characteristics were examined and found to yield unproblematic, user-friendly displays in real-time. Thus, this research provides a novel ECG system design to effectively analyse cardiac patients, however, it would be useful to develop a tool that can differentiate the various forms of cardiac arrhythmia.
1 Introduction
The twenty-first century has observed extensive research on health-related technology and considerable progress has been achieved. Although there has been some improvement, mortality rates remain stubbornly high with respect to preventable illness worldwide, with cardiovascular disease (CVD) being one of the primary causes of death with an increasing prevalence each year. Data from the World Health Organisation (WHO) (2016) indicates that approximately 17.3 million people succumbed to CVD in 2016—a figure that equates to approximately 31% of deaths worldwide. Within the criteria of CVD mortality, approximately 7.3 million people died as a result of coronary heart disease, whilst 6.2 million people died as a result of stroke. Future projections suggest that 23.6 million people will succumb to CVD annually by 2030 [1].
The introduction of electronic technology into medical research has created a nascent field of research known as biomedical engineering. This incorporates technological disciplines including electrical technology, electronics, communications, instrument development, mechanical engineering, very large-scale integration (VSLI), and combinations thereof. Using these techniques, it has been possible to create a new means by which medical practitioners may diagnose and appraise medical presentations and determine courses of medical intervention. Observation of cardiac electrical activity through electrocardiogram (ECG) represents one of the most significantly researched areas in recent years due to the integral role it assumes in patients’ general health. This focus was derived from the invention of the ECG in the early years of the last century by Willem Einthoven [2], which is currently considered a seminal moment in biomedicine. ECG is one of the most important non-invasive tools used to record the heart’s electrical activity and offer diagnoses for cardiac diseases. Telemetry ECG devices allow for easy and rapid ECG monitoring of patients with suspected cardiac arrhythmia. Einthoven’s original machine was developed and refined over the ensuing years in several ways, resulting in a number of means by which cardiac monitoring may be accomplished with great effect, including the use of ultrasound and computed tomography, neither of which require the insertion of probes into the patient [3].
This paper will develop a portable ECG monitoring and processing system that has the capacity to observe subjects in real time and display the resultant ECG signals on a computer or laptop. In order to accomplish this, a Graphical User Interface (GUI) was developed that is compatible with LabVIEW and with MATLAB data processing techniques.
This essay is comprised of five sections, commencing with the Introduction, followed by the System description, the Results and Discussion section, the Conclusion and finally, Further research.
2 System description
2.1 Hardware block diagram of an ECG monitoring and processing system
Figure 1 provides the design of the system hardware; from left to right respectively, this begins with the data acquisition unit, which is comprised of three electrodes attached to the patient’s body following the Einthoven triangle [4] to detect and transmit the ECG signal in an efficient manner. This is followed by the data acquisition circuit components, used to amplify the obtained signal and apply any necessary filtering start with an INA128 instrumentation amplifier (as shown in Fig. 2) to detect potential differences between two body locations. This is further followed by an active high-pass filter (HPF), as depicted in Fig. 3, then the low-pass filter (LPF), as revealed in Fig. 4, and finally culminates with a notch filter (Fig. 5). The subsequent stage is the data processing unit (DPU); this converts the amplified and filtered signal from an analogue to a digital format (ADC) using a ATmega328P microcontroller to transmit the obtained signal wirelessly using a ZigBee module for ultimate display on the practitioner’s computer or laptop using the GUI unit.

Hardware system components description

Instrumentation amplifier INA128

HPF circuit

Third-order LPF
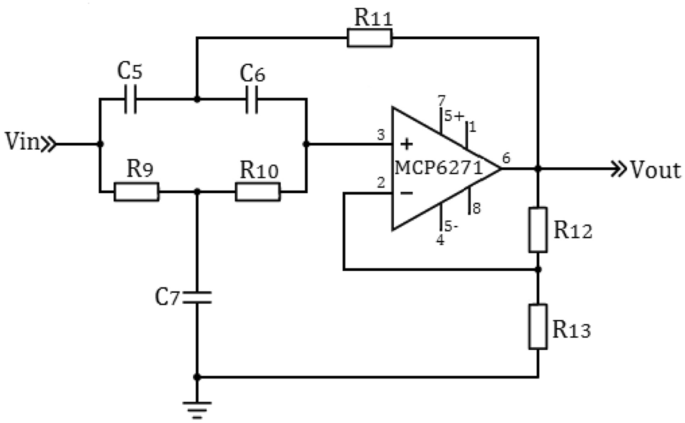
Twin T notch filter
2.2 Hardware system components
2.2.1 Instrumentation amplifier to amplify the ECG biosignal
The INA128 instrumentation amplifier is used to apply the initial amplification to the ECG signal. This component was chosen on the basis of its characteristically high minimum Common Mode Rejection Ratio (CMRR) of 120 dB and its high gain, and an adjustable gain which can be set to any level between 1 and 10,000. In order to prevent saturation of the amplifier, the gain is set to a nominal value of 10. This indicates that in conjunction with the above, the typical ECG signal amplitude should be approximately 1 mV, with a gain of 13 mV for the instrumentation amplifier [5].
The instrumentation amplifier had a 5 V power supply, comprised of two (± 5 V) power supplies connected in parallel, with decoupling provided by earth-connected 0.1 μF capacitors. The resistance required to set the gain of the amplifier is calculated according to the following formula [6].
According to the aforementioned typical ECG signal gain, the gain for the INA128 was set at G = 10
Thus, the external resistor RG can be calculated as following
2.2.2 HPF to remove the direct current offset
The purpose of the active HPF is to allow signals in excess of a predetermined frequency to pass through whilst blocking those of lower frequencies. The instrumentation amplifier’s output is passed through an active high-pass filter set to 0.05 Hz, thereby permitting the accurate recording of ST elements. The rationale is to eliminate direct current (DC) offsets that arise as a result of half-cell voltages in the ECG electrodes, together with any other extraneous low-frequency noise that modulates the ECG signal. The component used to accomplish this high-pass filter function is the OP07D op-amp, characterised by a nominal gain of 2 [7].
If the capacitance value C1 is calculated as \(10 \;\upmu{\text{f}}\), then
2.2.3 LPF to remove high-frequency noise
Following processing by the active high-pass filter, as stated, the ECG signal is subjected to low-pass filtering to eliminate any high frequency noise that results from nearby electromagnetic activity. The cut-off frequency is set to 160 Hz. The active LPF circuit, comprised of a first- and a second-order low-pass filter, is shown in Fig. 3.
The gain of each active low-pass filter is 10, giving a net gain for the pair of 10 × 10 = 100. The resistance and capacitance are determined in accordance with Eq. 5. The cut-off frequency, Fc, is assumed to be 160 Hz.
In the first step design, a non-inverting active first-order LPF with a gain set at 10 and Fc = 160 Hz was used in addition to the input impedance of R4 = 10 kΩ by using the voltage gain of the non-inverting op-amp.
Thereafter, with the 1st LPF, where the cut-off frequency Fc 160 Hz and R2 assumed to be 100 kΩ, the LPF formula can be used to determine C2.
By using the same equation, the voltage gain of the non-inverting op-amp is also:
With the 2nd LPF, where the cut-off frequency Fc = 160 Hz,
If the capacitance of C3 and C4 are depicted as 47 nF and 10 nF, then
2.2.4 Notch filter used to remove the 50 Hz power line interference
The function of the notch filter is to filter the 50 Hz AC power line component that modulates the ECG signal [8]. The type of filter used to accomplish this requirement is the twin T notch filter, as shown in Fig. 5. It can be observed that it is comprised of an MCP6217 op-amp configured with a resistor–capacitor (RC) arrangement. The MCP6271 op-amp is characterised by high input and low output impedances. Its performance can be expressed as follows.
If \({\text{F}}c = 50\;{\text{Hz}},\;C = 0.47\;\upmu{\text{F}}\), then the resistor value can be calculated as follows:
Therefore,\(R9 = 6.769\;{\text{k}}\Omega ,\;R10 = 6.769\;{\text{k}}\Omega ,\;R11 = 3.884\;{\text{k}}\Omega\)
The gain of the notch filter can be expressed as:
2.3 Software system components
The design of the software may be conceptualised as a two-element task, as shown in the block diagram depicted in Fig. 6. A significant degree of processing of the ECG signal occurs within the software function. The software adopted in this project was created within the Arduino integrated development environment (IDE). This IDE has the capability to function as a serial terminal emulator, which permits communication with the hardware.

Block diagram of software application
2.3.1 Data processing unit (DPU) design
The function of the DPU is to take the amplified and filtered ECG signal and convert it from analogue to digital format in order to render it in a form suitable for wireless transmission for ultimate display on the practitioner’s computer or laptop using the GUI.
The DPU is built using the ATmega328P microcontroller. This device incorporates an Atmel-type microcontroller, the function of which is to convert the ECG signal into an universal asynchronous receiver-transmitter (UART) format in order to render it compatible with the ZigBee module’ input specifications and thus suitable for interfacing with both the LabVIEW and MATLAB platforms on the GUI.
The Atmel-designed AVR type microcontroller is situated in the ATmega328P module. The ADC also located therein is characterised by a 10-bit resolution and can process input that vary between 0 V and the power supply voltage. Therefore, the voltage representing the least significant bit (LSB) may be expressed as follows:
Therefore, the ECG signal frequency does not coincide with the module’s upper frequency range.
It is evident that the microcontroller ADC is adequate for the task of sampling the ECG signal, provided that the stipulations of Nyquist’s Theorem—which posits that the sample periodicity must be a minimum of two times the highest ECG signal frequency in order to avoid signal aliasing—are met [9]. As the ATmega328P sampling periodicity is of the order of 100 μs, the sampling frequency should be approximately 10 kHz, correspondingly [10].
The ATmega328P microcontroller incorporates one UART channel, which in this case is used to allow the ZigBee wireless module to transmit and receive data. The baud rate of the UART channel determines the speed at which data is processed (the baud rate being the symbol/S specification). The baud rate differs from the more usual bits per second specification in that bits are not the same as symbols; for example, each symbol may be comprised of a number of bits [11]. The bits-per-second specification of the Arduino Uno module is a nominal 9600, and as each symbol is made up of 10 bits (eight for data and one each for start and stop), its baud rate is 9600.
2.3.2 Selecting the wireless connection module
It is not new for wireless methodology to find application in connecting sensing devices to instruments; however, a recent intensification in related research has attracted new interest and rapid diversification in its application [7]. One such advance in research is exemplified in Digi International Incorporated’s ZigBee radio frequency (RF) module [12].
For the purposes of this design, the ZigBee RF module wireless application was selected due to its advantages in terms of economy, modest power demands, reliability, versatility in terms of use and built-in security elements. In the process of selecting ZigBee, a number of alternatives were considered, including Bluetooth, Institute of Electrical and Electronics Engineers (IEEE) 802.11b, IEEE 802.11g and ultra-wideband (UWB); the outcomes of the comparative appraisal exercise for these are shown in Table 1. Thus, it can be observed that the ZigBee RF wireless option offers the best features, especially in terms of expense and power demand. Another important issue, for obvious reasons, was that of component lifespan, a factor closely related to power demand in that low-power components tend to last longer. The outcomes of this consideration are presented in Table 1, with the ZigBee option projected as being the most durable. ZigBee also outperforms Bluetooth in terms of wireless operating range and whilst this is not the case for other options, its performance in this respect set against its power demands is impressive. The security of any wirelessly transmitted data is another important consideration that was taken into account, with ZigBee proving to be adequate for the purposes of this design, addressing such issues as module authorisation, key establishment, transport and frame protection. In terms of keys, ZigBee is characterised by full-function operation, co-ordinating and storing keys in the role of a trust centre, requiring both transmitting and receiving sites to present matching keys in order to send and receive data [13].
2.3.3 Wireless communication circuit
Naturally, a wireless communication circuit is essentially a switching device that includes the transmitter side, the receiver side, an Analogue to Digital Converter (ADC), the ZigBee transmitter, the ZigBee receiver MCP2220 connection, and the GUI [14].
As can be observed in the schematic diagrams in Fig. 7, the transmitter side processes the signal by converting the ECG signal from an analogue format to a digital, eventually transmitting the same using the ZigBee module. However, the signal is received by the ZigBee receiver and passed through the MCP2220 [15] connection to the GUI to display the final results.

Block diagram of the wireless communication circuit
2.3.4 Design of the GUI using LabVIEW
A crucial feature of the ECG monitoring and processing system that is the subject of this research is its portability, therefore, it is essential that the GUI is appropriate to this objective and versatile with respect to the operator whilst performing with the necessary degree of sophistication and accuracy. As such, the LabVIEW and MATLAB proprietary software applications were selected to play a vital role in the GUI design.
LabVIEW is a proprietary software package that facilitates the design of various types of data management, control and measuring systems; as such, it is eminently suitable for GUI design. The 2014 version of LabVIEW has been used to develop the first GUI. Figure 8 depicts the connection of the system’s operator panel as can be observed on the left side. The setting of the serial port configuration, such as the baud rate (9600) and remainder of the design components are located in the square which represents a loop in the LabVIEW design. This loop will confirm that the design will run continuously to display the ECG signal. A program loop function is employed to maintain operation until such a time as the operator terminates it. The loop function encompasses all necessary functions, running with a delay of the order of a number of milliseconds in order to protect against computer CPU overload.

Schematic of the LabVIEW block diagram
Microcontroller connectivity is achieved by implementing a link that specifies the COM port being used and the transmission baud rate. The COM port is specified as the computer USB port to which the ZigBee RF module is connected and recognised by the device management software. As long as these specifications are correctly made and recognised by the relevant system modules, connectivity will be established automatically to other design elements and communication between them will be enabled.
2.3.5 Design of the GUI using MATLAB
A GUI is a common feature of numerous modern applications, thus, it is unsurprising that software solutions exist for their design. MATLAB is no exception, offering a user-friendly GUI creation facility. A GUI created using MATLAB is generally characterised by being robust in terms of data processing power, which is one reason why it is implemented in biotechnology applications [16]. As such, it has been selected for the GUI design in the present study for real-time tracking of the ECG signal.
2.4 Implementation using printed circuit board pand enclosure
In this research, the design of the printed circuit board (PCB) was accomplished with the aid of the proprietary Proteus software application, which ensured the PCB was produced economically in both spatial and monetary terms. All physical parameters of the parts to be attached to the PCB were included in the design. Figure 9 shows the completed PCB. The PCB design was then converted to Gerber format, as used by the computer numerical control (CNC) apparatus used in the PCB’s physical manufacture. The use of Gerber viewer software ensured that this process was accomplished free from errors.

The top layer of the PCB board
Once the Gerber files’ accuracy had been verified, the following assembly stages were conducted. The first stage involved the scrupulous cleaning of the PCB and ensuring that no short circuits existed. Thereafter, the DAU component was assembled on the PCB design, soldering it as shown in Fig. 10, which further illustrates the DAU in its final form with all components in place and therefore ready for testing.

Final design in box
2.5 Results and discussion
Typically, when a patient with cardiac disease is identified as requiring observation and/or diagnosis, this requires hospital admission. This observation and diagnosis generally require the use of an ECG machine which, due to expense and the need for expert operation, is generally only found in large, centrally located hospitals. Treatment, therefore, is likely to involve significant inconvenience and expense for patients. There is hence a real need for a portable and economical ECG devices. The need for such a device to be wireless stems from the requirement with current ECG machines for patients to be attached to the machine by electrical wires, thus requiring the machine and patient to be in close proximity. A wireless machine, however, would facilitate patient and machine not being physically proximate. In this project, a portable wireless ECG monitoring and processing system was designed which is capable of performing all the functions of centrally based existing ECG machines, but utilising wireless technology to make connections with centrally based nodes. This was accomplished by patient-connected electrodes fitted with micro-modules that have the ability to process digitally and wirelessly convey obtained signals by means of ZigBee module transfer methods. The different aspects of the design were tested and evaluated as depicted in the following section.
2.5.1 Data equalisation circuit test
Following the analysis and specification of each circuit components, testing commenced. Testing of the DAU was conducted in a software environment using the Multisim software application, which creates simulated ECG signals that connect directly to the DAU through positive and negative terminals of the INA128 Op-Amp and the output ECG signal can then be viewed on an oscilloscope (as shown in Fig. 11).

Schematic design test in mutism
Figure 11 displays the DAU functions as expected, demonstrating that the software operates correctly, as exemplified by the clear PQRST elements of the ECG signal. This differs from the real-world scenario in that the Multisim-generated ECG signal does not contain any noise components, therefore, even with the low-pass, high-pass and notch filters taken out, the ECG signal will remain clean. As a result, real-world testing will not precisely replicate the Multisim-based test and the consequences of this should be anticipated; such effects are likely to include power-line noise which in the real-world scenario, the notch filter would seek to minimise. In order to ensure the ECG signal is efficiently detected and transmitted, it is essential that the ECG electrodes are properly located on the patient. For the purposes of this design, two electrodes were connected to the patient’s upper chest below the lower edge of the scapula on either side, with the third being connected underneath the left-hand side chest electrode immediately above the patient’s upper rib following the Einthoven triangle. Thereafter, the ECG signal is captured by the ECG electrodes and passed to the INA128. The differential ECG signal output characteristics observed on an oscilloscope at the laboratory are presented in Fig. 12.

ECG signal after instrumentational amplifier
The post-instrumentation amplification ECG signal shown in Fig. 12 also exhibits a high-frequency noise component that is generated from various sources such as a power line and body movement. This is subsequently minimised by the filters appearing in the following stage. The high-pass (low frequency) active filter used in the second stage of the ADU is one of the most critical, as it seeks to remove any low-frequency less than (0.05 Hz, Fig. 13) interference from the amplified ECG signal, thereby permitting the accurate recording of QRST elements. The reason for applying HPF is to eliminate DC offsets that arise as a result of half-cell voltages occurring in the ECG electrodes, together with any other extraneous low-frequency noise that modulates the ECG signal.

Active HPF bode plot illustrates the cut-off frequency (50.025 m Hz ≅ 0.05 Hz)
This filtering function was accomplished by means of an OP07D Op-Amp together with a number of resistors. The characteristics of this filter are shown in Fig. 3, and the result of this filter illustrates a peak of the ECG signal, such as the QRS complex, however, mixed with high frequency noise. Therefore, more filters need to be applied in order to enhance the ECG signal (Fig. 14).

ECG signal after high-pass filter
In the final stage of DAU, the ECG signal is subjected to LPF to eliminate any high frequency noise that may result from nearby electromagnetic activity. The applied low-pass (high frequency) active filter removes any high-frequency more than 160 Hz (Fig. 15). This is also accomplished by means of an appropriately configured OP07D Op-Amp. With regards to the LPF result in Fig. 16, a significant improvement in the ECG signal can be observed as a result of applying the LPF. The ECG signal displayed with all its details, presents the P wave and QRS complex with a clear T wave.

Active 3rd order LPF bode plot illustrate cut-off frequency (160.063 m Hz ≅ 160 Hz)

ECG signal after low pass filler
It is worth acknowledging that where ADC in the microcontroller cannot manage the negative voltages and the ECG signal contains a positive and negative component which is the [R, S] wave, to remove the negative component from ECG signal whilst maintaining the [S] wave signal, the signal transitions from the zero level by applying the DC offset (as shown in Fig. 17). The DC offset shifts the waveform of [R, S] wave upwards. As a result, it can be observed that the zero level is no longer a reference for the ECG signal. This change will be observed with the results of DAU.

ECG Signal after a twin T notch filter
Following the low- and high-pass filtering previously described, the ECG signal undergoes notch filtering by means of an MCP6217 Op-Amp, the purpose of which is to minimise interference resulting from 50 Hz power line noise. This is a twin-T filter, the characteristics of which are shown in Fig. 5. The result in Fig. 17 illustrates a substantial improvement in the ECG signal as a result of applying the consecutive band reject filter (notch filter), which successfully removed the 50 Hz power line noise. Consequently, the details of the ECG signal [PQRST] peaks are thus, clearer. The obtained ECG signal from the final stage of DAU confirms that DAU works properly and provides expected results.
The resultant approximately 1.0 V peak-to-peak post-amplification and filtering ECG signal can be viewed on an oscilloscope. This signal will be transferred to the subsequent unit, namely the DPU will be converted to a digital signal and sent wirelessly to the final (GUI) unit.
2.5.2 GUI test and results
Using MATLAB and LabVIEW, the design of the present study offers an excellent integrated platform with notable advantages, for example, it can analyse the large data set collected from DAU in real-time and the software provides a user-friendly environment (GUI), which can be easily used to diagnose a patient with cardiac disease. Moreover, it contains a number of advanced mathematical blocks that can be used to develop unique features, such as storing patient data to allow offline data analysis. The design generally demonstrated that the hardware and software elements operated and intercommunicated correctly and as expected. In both LabVIEW and MATLAB configurations, the GUI characteristics were examined and were found to yield unproblematic, user-friendly displays in real-time.
As shown in Fig. 18, the results of the GUI LabVIEW design enabled the user to diagnose the heart activity of the patient. Moreover, the signal displays full details of typical ECG signal, P wave, QRS complex and T wave. Furthermore, as illustrated in Fig. 19, MATLAB design of the GUI has further proved similar results as obtained in Fig. 11.

The result of LabVIEW design

The results of the MATLAB design
Furthermore, we validated our obtained ECG signal against three different ECG signals the one generated by the existing hospital’s traditional ECG Fig. 20a, and the results of two developed ECG monitoring systems with different graphical user interfaces LabVIEW Fig. 20b [17], and MATLAB Fig. 20c [18]. As result, our ECG signal with both platform LabVIEW and MATLAB showed high level of similarity with traditional ECG signal in Fig. 20a in term of observing a clear P wave, QRS complex and T wave. However, our generated ECG signal was it slightly better than the results in Fig. 20b, c, because of the filtering circuit that we applied in our design.

3 Conclusion
The objectives of this research have been successfully accomplished through the acquisition of a noise-free ECG signal. Once the acquisition of a noise- and distortion-free ECG signal were successfully accomplished, it was transmitted wirelessly by use of the ZigBee module. Additionally, a suitable GUI was created by means of both LabVIEW and MATLAB proprietary software applications. This GUI facilitates real-time patient ECG observation.
In summary, it may be confidently asserted that as a result of the work conducted in this paper, cardiac patients need not be committed to attending centrally located medical facilities in order to be observed and treated. This development has been facilitated by the application of wireless technology reported in this work.
4 Further research
Although the project achieved its stated objectives in terms of creating an ECG monitoring and processing system, a number of potential improvements, as identified retrospectively, can be identified. Firstly, the wires connecting the ECG electrodes to the data acquisition module are not optimal; improvements could be made by using RF shielded wiring in order to prevent the effects of environmental RF radiation. Secondly, the ECG signal could be viewed globally if the project incorporated internet-compatible connectivity. This would enable the participation of cardiac practitioners regardless of their geographical location, with consequent benefits for patient care. Finally, an analysis tool could be added to both the LabVIEW and MATLAB platform GUIs to help detect different cardiac arrhythmia.
References
Cardiovascular Diseases (CVDs): key facts (2017) World Health Organization. https://www.who.int/news-room/fact-sheets/detail/cardiovascular-diseases-(cvds). Accessed Sept 2017
Habte TT, Saleh H, Mohammad B, Ismail M (2019) Ultra low power ECG processing system for IoT devices. Springer, Berlin
Gupta R, Mitra M, Bera J (2014) ECG acquisition and automated remote processing, vol 20. Springer, Berlin
Zeng R (2015) Graphics-sequenced interpretation of ECG. Springer, Berlin
Borromeo S, Rodriguez-Sanchez C, Machado F, Hernandez-Tamames JA, de la Prieta R (2007) A reconfigurable, wearable, wireless ECG system. In: 2007 29th annual international conference of the IEEE engineering in medicine and biology society. IEEE, pp 1659–1662
INA12x Precision (2016) Low-power instrumentation amplifiers. http://www.ti.com/lit/ds/symlink/ina128.pdf. Accessed July 2016
Manjare P, Deshmukh V, Agrawal S, Puranik S (2014) Advance wireless ECG monitoring system based on GSM 3G. Int J Emerg Technol Adv Eng 4(6)
Nayak S, Soni M, Bansal D (2012) Filtering techniques for ECG signal processing. Int J Res Eng Appl Sci 2(2):671–679
Olshausen BA (2000) Aliasing: nyquist sampling theorem. PSC 129–Sensory Processes, pp 1–6
Zhou P, Z-C Li, Wang F, Jiao H-Y (2016) Portable wireless ECG monitor with fabric electrodes. Chin J Biomed Eng 25(4):179–189
Neri A, Becchetti Claudio (2013) Baud rate somerset. Wiley, New York
‘ATmega328/P Datasheet Complete’ (2016) http://www.atmel.com/Images/Atmel-8271-8-bit-AVR-Microcontroller-ATmega48A-48PA-88A-88PA-168A-168PA-328-328P_datasheet_Complete.pdf. Accessed July 2016
Abdullah A, Ismael A, Rashid A, Abou-ElNour A, Tarique M (2015) Real time wireless health monitoring application using mobile devices. Int J Comput Netw Commun (IJCNC) 7(3):13–30
Zulkifli N, Harun FC, Azahar N (2012) XBee wireless sensor networks for heart rate monitoring in sport training. In: 2012 international conference on biomedical engineering (ICoBE). IEEE, pp 441–444
Yang H-C, Cheng C-M, Chein T-F (2010) A novel design of ECG electrode combined with antenna for ZigBee-based wireless measurement. In: 6th world congress of biomechanics (WCB 2010). August 1–6, 2010. Springer, Singapore, pp 1382–1385
Chaibi S, Bouet R, Jung J, Lajnef T, Samet M, Bertrand O, Kachouri A, Jerbi K (2012) Developement of Matlab-based graphical user interface (GUI) for detection of high frequency oscillations (HFOs) in epileptic patients. In: 2012 IEEE international conference on emerging signal processing applications. IEEE, pp 56–62
Todkar SD, Pange PD (2018) Design of the real time ECG signal processing and monitoring system using Lab VIEW with data acquisition system. Int J Innov Sci Res Technol 3(6):2456–2165
Rosli KA, Omar MH, Hasan AF, Musa KS, Fadzil MFM, Neu SH (2018) Development of electrocardiograph monitoring system. In: MATEC web of conferences, EDP sciences, p 01013
Acknowledgements
Sincere appreciation is afforded to all academic staff at the university for their support, encouragement and guidance during this research project.
Author information
Authors and Affiliations
Corresponding author
Ethics declarations
Conflict of interest
The researchers declare that they have no conflicts of interest.
Human and animal rights
The present study does not contain any experimentations with human or animal participants.
Additional information
Publisher's Note
Springer Nature remains neutral with regard to jurisdictional claims in published maps and institutional affiliations.
Rights and permissions
Open Access This article is licensed under a Creative Commons Attribution 4.0 International License, which permits use, sharing, adaptation, distribution and reproduction in any medium or format, as long as you give appropriate credit to the original author(s) and the source, provide a link to the Creative Commons licence, and indicate if changes were made. The images or other third party material in this article are included in the article's Creative Commons licence, unless indicated otherwise in a credit line to the material. If material is not included in the article's Creative Commons licence and your intended use is not permitted by statutory regulation or exceeds the permitted use, you will need to obtain permission directly from the copyright holder. To view a copy of this licence, visit http://creativecommons.org/licenses/by/4.0/.
About this article

Cite this article
Ehnesh, M., Abatis, P. & Schlindwein, F.S. A portable electrocardiogram for real-time monitoring of cardiac signals. SN Appl. Sci. 2, 1419 (2020). https://doi.org/10.1007/s42452-020-3065-9
Received:
Accepted:
Published:
DOI: https://doi.org/10.1007/s42452-020-3065-9