
Abstract
Reducing vehicles exhaust emissions pollution associated with gasoline combustion become growing interest locally and global-wide. To satisfy the exhaust gas emissions rules and regulations it is very significant and critical for gasoline internal combustion engines to have an accurate control of air–fuel ratio (AFR). Therefore, studying the relationship between the AFR, lambda (λ) and the exhaust emissions of gasoline-fueled vehicles is very important and necessary. A sensitive and detailed analysis conducted to analyze and predict the relationship between the AFR, lambda (λ) and the exhaust emissions percentages and values of gasoline-fueled vehicles. The results of the study provides better understating to the relation between AFR, lambda (λ) and the gasoline-fueled vehicles exhaust emissions percentages and values, because it is connecting the actual field measurements and results with theoretical relation between AFR, lambda (λ) and the gasoline-fueled vehicles exhaust emissions percentages and values. Also as a part of this study results, significant relations determined between the studied variables in the form of polynomial and linear equations with high accuracy, which helps in understanding the relationship between the studied variables and determining the values of some of the variables if the others were known.
1 Introduction
The increase of vehicles market competition together with the increase of the environmental pollution led to complex engine systems development. The strategies of Innovative control are required to simplify and improve the system of engine management, moving towards engines with energy saving and satisfying the regulations and restrictions on gases emissions standards [1]. Accurate measurement of the air–fuel ratio (AFR) in the internal combustion engines is desirable for precise engine control [2]. The control of AFR remains a major goal for the control of the engines, especially for exhaust emissions pollution purpose. The AFR is the quantity of air over the quantity of fuel injected in each cylinder of the engine compared with stoichiometric condition. This variable is characterizes the quality of the combustion and the performances of the engine according to fuel consumption and gases emissions. The catalytic technology for exhaust gases emission imposes an AFR of 1 (± 5%). Generally, for a gasoline-fueled engine, the quantity of fuel injected in each cylinder controls the air–fuel ratio (AFR) [3].
The AFR is the air mass to fuel mass ratio present in gasoline fuel combustion process, such as in the internal combustion engine (IC engine). The AFR is very important and significant measure or indicator for controlling or tuning the engine performance and reasons directly related to air quality and anti-pollution. If the air provided to the gasoline fuel combustion is exactly enough to completely burn all the gasoline fuel, the AFR is named stoichiometric mixture. AFR numbers lower than stoichiometric are considered rich mixtures. The rich AFR mixtures are less efficient, but burn cooler and produce or generate more power, which is kinder and less harm on the vehicle’s engine. AFR numbers higher than stoichiometric called lean mixtures. Lean AFR mixtures are more efficient, but may cause damage to the vehicle’s engine and produce higher nitrogen oxides (NOx) exhaust emission levels. For accurate and precise AFR calculations, the combustion oxygen content air should be specified because of oxygen (O2) additives enrichment or possible dilution by water vapor from the ambient. Theoretically stoichiometric AFR mixture has just enough or exactly air to completely burn the available gasoline fuel. Practically this case is never quite has been achieved, because the available time for each combustion cycle is very short in the IC engine. At an engine with 6000 rpm speed, in about 4–5 ms most of the combustion process is completed. This is the time spent from when the spark is fired until the combustion of gasoline fuel and the fuel mix is basically complete after the crankshaft rotation by 80 and some degrees. Catalytic counters are designed and made to work with the best performance when the vehicle’s exhaust emission gases passing through them are resulted from ideal or perfect combustion [4].
To generate energy through combustion process, thermal engines use fuel and O2 from the air. A specified or certain quantities of fuel and air need to be provided in the chamber of the combustion to guarantee the process of combustion. When all the fuel is burned, a complete combustion takes place, and as a result the exhaust gases emission will be free from any unburned fuel. The theoretical air–fuel ratio mixture for a gasoline fueled engine, for complete gasoline fuel combustion, the stoichiometric air–fuel ratio is about 14.7:1. In order to completely burn 1 kg of gasoline fuel, the combustion process needs 14.7 kg of air. The combustion process is possible even the air–fuel ratio is different from the stoichiometric mixture. In order to the combustion process to take place in gasoline fueled engine, the minimum air–fuel ratio is around or near 6:1 and the maximum can get around 20:1. When air–fuel ratio is higher than the stoichiometric ratio the air–fuel mixture called lean mixture, and when the air–fuel ratio is lower than the stoichiometric ratio the air–fuel mixture called rich mixture. As example, for a gasoline fueled engine the air–fuel ratio of 16.5: is a lean mixture and 13.7:1 is a rich mixture. Spark ignition engines normally or usually run on gasoline fuel, the air fuel ratio ranges from 12:1 (rich mixture) to 201:1 (lean mixture), depending on the operating conditions of the engine; speed, load, temperature, etc. Mainly for emission gases treatment reasons the moderate or new internal combustion engines run as much as possible around or near stoichiometric air–fuel ratio [5].
New vehicles are provided with air–fuel mixture composition sensor in the exhaust gas, placed in the vehicle exhaust system, the sensor facilitates the estimation of the mixture based on the concentration of oxygen (O2) in the vehicles exhaust gas. The signal produced by the mixture sensor is characterized by a long time delay relation to the fuel injection signal. The delay can have dozens of values of sequential fuel injections. In the case of incorrect value of the dose of fuel injection, the correction will occur with a considerable time shift. The situation with incorrect values of oxygen (O2) concentration in the exhaust gases emission has a clearly reactive effect on engine operation and performance, as it decreases combustion efficiency and catalysis of vehicle toxic exhaust gas components as well as leads to the worsening of vehicle ecological properties [6].
One of the main parts of the more complex vehicles exhaust emissions reduction for combustion engines is the problem of air–fuel ratio (AFR) control. The quality of the mixture is essential for efficiency of a three-way catalytic converter and therefore sufficient control techniques are required to fulfill and satisfy emission legislation [7].
Most modern vehicle’s engines are calibrated to run under stratified conditions, which allow the losses to be minimized or even eliminated and helps to increase the fuel conversion efficiency. This also helps to largely and dramatically reduce carbon monoxide (CO) and nitrogen oxide (NOx) emissions as the combustion efficiency is increased [3].
2 Study objectives
The objective of this study is to analyze and predict the relationship between the air–fuel ratio (AFR), lambda (λ) and the exhaust emissions percentages and values of gasoline-fueled vehicles using versatile and portable emissions measurement system tool. Where, in order to meet and satisfy the exhaust gas emissions rules and regulations, it is very significant and critical for gasoline internal combustion engines to have an accurate control of air–fuel ratio (AFR).
3 The study air–fuel ratio (AFR), lambda (Λ) and exhaust emissions measurement tool (exhaust gas analyzer)
For the purposes of air–fuel ratio (AFR), lambda (λ) and exhaust emissions measurement of this study, the E instruments model F5000-5GAS was selected (see Fig. 1). The F5000-5GAS is an extremely versatile and portable emissions measurement system designed to measure and analyze exhaust gases from vehicles, trucks, buses and forklifts. It has been designed as a modular system, permitting the installation, in the field, of most of the various available options. The E INSTRUMENTS Model F5000-5GAS is a portable state of the art exhaust gas analyzer designed to measure, record, and remotely transmit combustion parameters used for the following tasks [8]:

The Study air–fuel (AFR), lambda (λ) and exhaust emissions measurement device-E Instruments model F5000-5GAS [9]
-
(1)
To accurately measure air–fuel ratio (AFR), lambda (λ), O2, CO2, CO, HC, and NO/NOx from the engine exhaust pipes of automobiles, forklifts, trucks, buses, and other vehicles running on fuels such as gasoline, diesel, LPG, CNG, and propane.
-
(2)
To perform routine engine tuning and maintenance, and to help diagnose potential engine problems.
-
(3)
To assist in servicing a vehicle to the manufacturers emissions specifications, and for pre-compliance verification testing.
-
(4)
To assist the operator of a vehicle with the task of optimizing its engine efficiency, performance, and fuel savings.
-
(5)
To be used as a management tool to assist the operator with keeping records and controlling costs.
4 The exhaust gas analyzer (the E instruments model F5000-5GAS analyzer) technical specification
The E INSTRUMENTS F5000-5GAS uses sophisticated electronics and programming design for increased accuracy and flexibility. It measures five different exhaust gases, and calculates air–fuel ratio (AFR) and Lambda (λ). It stores, prints and graphs data. It communicates with a variety of other computers, tablets, and other Windows compatible devices located nearby using Bluetooth wireless technology and/or USB cable. It has a library of six fuels, and the operator can add more fuels if needed. It is designed to operate on its internal rechargeable battery pack as well as AC power [8]. The technical specification of The E INSTRUMENTS Model F5000-5GAS analyzer is summarized and explained in Table 1 and Fig. 2.

The location of the sensors on their housing in the E INSTRUMENTS Model F5000-5GAS analyzer [9]
5 Combustion process in internal combustion (I.C.) engines
The internal combustion gasoline fueled engines are those engines in which the gasoline fuel combustion takes place inside the cylinders of the engine. The special features of the internal combustion gasoline fueled engines is the heat energy resulted from the combustion process and conversation this energy to mechanical work occur or take place inside a cylinder of gasoline fueled engine (see Fig. 3). These gasoline fueled engines are recognized for their high efficiency, low operation cost, compactness, lightweight, and always ready for starting. Exhaust emissions from internal combustion (IC) gasoline fueled engines is the main source of air pollution and global warming. The relations between the combustions of fuel and air mixture and the combustion products called combustion stoichiometry. Combustion stoichiometry relations depend only on the conversation of mass of each chemical element of the fuel and air mixture [10].

Internal combustion (IC) four-stroke cycle in a typical gasoline engine [11]
6 The air–fuel ratio (AFR)
The air–fuel ratio is a significant indicator and very important measure for gasoline engine performance controlling and tuning, and anti vehicles exhaust emissions pollution reasons. The AFR called or known as stoichiometric mixture when the provided air is exactly enough to completely burn all of the gasoline fuel. Air–fuel ratio with lower numbers than stoichiometric are considered rich air–fuel mixture, which are less efficient, generate more power and mixture burn cooler, which is gentler on the engine. Air–fuel ratio numbers higher than stoichiometric mixture are considered lean air–fuel mixtures, which are more efficient but cause damages to the engine and generate higher levels of nitrogen oxides (NOx) emission. A stoichiometric air–fuel mixture burns very hot and may cause damages to the engine parts and components if the engine is run or operate under high load at stoichiometric air–fuel mixture. Because of the high temperature at this air–fuel mixture, detonation of the air–fuel mixture is possible shortly after maximum cylinder pressure under high load causing knocking. Serious and big engine damages can be caused by detonation of the air–fuel mixture as the un-controlling the burning of the air–fuel mixture can generate very high pressure in the cylinders of the engine. As a result, stoichiometric air–fuel mixtures are used under the light load conditions, a richer mixture is used to generate cooler combustion’s products and prevent engine cylinders heads over heating and detonation. The air–fuel ratio is the most common measure and indicator used for air–fuel mixtures in gasoline fueled internal combustion engines and it is calculated with Eq. 1 [4].
where mair = mass of air, mfuel = mass of fuel
7 Air–fuel equivalence ratio or lambda (λ)
Air–fuel equivalence ratio or lambda (λ) is the actual ratio of actual air–fuel ratio (AFR) to stoichiometric air–fuel ratio (AFR). For a given mixture, λ = 1.0 is at stoichiometric air–fuel ratio (AFR), rich air–fuel mixtures has λ < 1.0, and lean mixtures has λ > 1.0. There is a direct relationship between lambda (λ) and air–fuel ratio (AFR). To calculate the air–fuel ratio (AFR) from a given lambda (λ) value, multiply the measured lambda (λ) by the stoichiometric air–fuel ratio (AFR) for that fuel. Alternatively, to recover lambda (λ) value from an air–fuel ratio (AFR), divide air fuel ratio (AFR) by the stoichiometric air–fuel ratio (AFR) for that fuel. The Eq. 2 is often used as the definition of lambda (λ) [12]:
where AFR = actual AFR, AFRstoich = stoichiometric AFR
Because of common fuels composition varies seasonally and many modern cars can handle different fuels when operating, it is making more sense to talk about lambda (λ) values rather than air–fuel ratio (AFR). Most practical measurement air–fuel ratio (AFR) devices in fact measure the amount of residual oxygen (O2) for lean mixes or un-combusted hydrocarbons (HC) for rich mixtures in the vehicles exhaust emissions [4].
8 The impact of air–fuel ratio on gasoline engine exhaust gases emission
Internal combustion (IC) gasoline fueled engines exhaust gases emission depend heavily and mainly on the air–fuel ratio. For a gasoline fueled engine, carbon monoxide (CO), hydrocarbons (HC), and nitrogen oxides (NOx) exhaust gases emission are significantly influenced by air–fuel ratio. CO and HC are majorly generated or produced with rich air–fuel mixture, while NOx with lean air–fuel mixtures which mean that there is no fixed air–fuel mixture for which it can obtain the minimum for all exhaust gases emission [5].
9 Gasoline fueled internal combustion engine’s pollution emissions and their harmful effects and scale of impacts
Vehicles exhaust gases emission participate significantly to air pollution (two-third) in the urban areas [10]. Vehicles produce various and multiple exhaust and other gases emission which are harmful to the environment and to the air quality, as summarized in Table 2. Some gases and other emissions are localized in effect, while others are regional or global, and therefore location is less important in term of harmful effect. Technologies of emissions control have reduced emissions rates and values of some but not all pollutants such particulates [13].
10 Results and discussion
For the purposes of this study, the data were collected and air–fuel ratio (AFR), lambda (λ) and exhaust emissions measurements conducted using the E INSTRUMENTS Model F5000-5GAS analyzer for 125 vehicles at a checkpoint located at a major highway in the south of Sulaimaniya Governorate in Kurdistan Region-North of Iraq (see Figs. 4, 5). The collected data for each vehicle included manufacturing company, engine size, manufacturing year, air–fuel ratio (AFR), lambda (λ) and exhaust emissions percentages and values.

Iraq map with study location-Kalar City (Google Maps)

Data collection and air–fuel ratio (AFR), lambda (λ) and exhaust emissions measurements
The air–fuel ratio (AFR), lambda (λ) and exhaust emissions measurements included 6 gasoline-fueled engines sizes vehicles (1.6, 1.8, 2.0, 2.4, 2.5 and 2.7 L gasoline engine sizes) with different manufacturing years. The measured exhaust emission gases for each vehicle included oxygen (O2), carbon dioxide (CO2), carbon monoxide (CO), nitrogen oxide (NO), and hydrocarbons (CxHy). For the purposes of this study the most frequent vehicles with two engine sizes 1.6 and 2.5 L were selected to be studied.
To separately analyze and predict the relation between air–fuel ratio (AFR), lambda (λ) and the exhaust emissions percentages and values of gasoline-fueled vehicles for each of the selected two engine sizes (1.6 and 2.5 L gasoline engine sizes), the collected data, air–fuel ratio (AFR), lambda (λ) and emissions measurements were classified, studied and discussed as in the following:
10.1 Analyze and predict the relationship between the air–fuel ratio (AFR), lambda (λ) and the exhaust emissions percentages and values for 1.6 L gasoline engine size
To study the relation between air–fuel ratio (AFR), lambda (λ) and the exhaust emissions percentages and values for 1.6 L gasoline engine size, the collected data for each vehicle including manufacturing company, manufacturing year, air–fuel ratio (AFR), lambda (λ) and exhaust emissions percentages and values were summarized and illustrated in Table 3.
10.2 The relation between the air–fuel ratio (AFR) and air–fuel equivalence ratio or lambda (λ)
For the vehicle with 1.6 L engine size, the measured λ values ranged from 1 to 5.14 (see Table 3), wherein theoretical, λ = 1.0 is at stoichiometric AFR, and lean mixtures have λ > 1.0. The measured values of AFR ranged from 14.71:1 to 75.60:1 (see Table 3), where the theoretical AFR for a gasoline engine, for a complete combustion, the stoichiometric AFR is around 14.7:1 and AFR > 14.7:1 is lean. The λ and AFR measurements indicate that the entire vehicles operated with air–fuel mixtures ranged between stoichiometric and lean mixtures.
Lambda is the ratio of actual AFR to stoichiometric AFR, according to that the measurements show that the stoichiometric AFR is 14.71:1, where all the measured AFR values corresponding to measured λ = 1 were 14.71:1(see Table 3). For the measured AFR and λ values a polynomial relation determined with high R-squared (R2) = 93.52%, which mean a relatively high accuracy (see Eq. 3 and Fig. 6).
where AFR = air–fuel ration, λ = air–fuel equivalence ratio or lambda

The relation between air–fuel equivalence ratio or lambda (λ) and air–fuel ratio (AFR) for the vehicles with engine size 1.6 L
10.3 The relation between air–fuel equivalence ratio or lambda (λ) and exhaust emissions percentages and values
The relation between measured lambda (λ) and exhaust emission gases, which included oxygen (O2), carbon dioxide (CO2), carbon monoxide (CO), nitrogen oxide (NO), and hydrocarbons (CxHy) were studied and discussed as in the following:
-
1.
The relation between measured lambda (λ) and exhaust emitted oxygen (O2) percentages: the measurement results show that as the lambda (λ) values increase, the oxygen (O2) emission is increasing (see Table 3 and Fig. 7). In the ideal or complete combustion, all of the oxygen (O2) will be consumed with the fuel and produce only carbon dioxide (CO2) and water. For the measured λ values and O2 percentages, a linear relation determined with high R-squared (R2) = 95.67%, which mean a relatively high accuracy (see Eq. 4 and Fig. 7).
Fig. 7 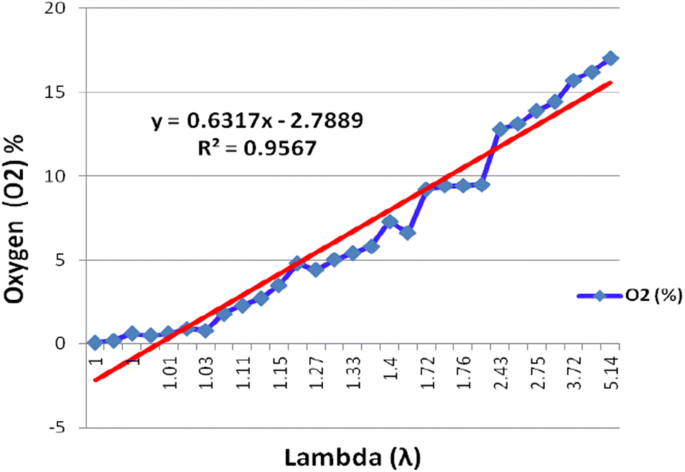
The relation between air–fuel equivalence ratio or lambda (λ) values and oxygen (O2) exhaust emission percentages-1.6 L engine size
$$Oxygen \, \left( {O_{2} } \right) \, \% \, = \, 0.631 \, \lambda \, {-} \, 2.7889$$(4)where Oxygen (O2) % = exhaust oxygen (O2) emission percentage, λ = air–fuel equivalence ratio or lambda
-
2.
The relation between measured lambda (λ) and exhaust emitted carbon dioxide (CO2) percentages: the measurement results show that as the lambda (λ) values increase, the carbon dioxide (CO2) emission is decreasing (see Table 3 and Fig. 8). In the complete combustion of fuel produce only carbon dioxide (CO2) and water. For the measured λ values and CO2 percentages, a linear relation determined with high R-squared (R2) = 95.33%, which mean a relatively high accuracy (see Eq. 5 and Fig. 8)
Fig. 8 
The relation between air–fuel equivalence ratio or lambda (λ) values and carbon dioxide (CO2) exhaust emission percentages-1.6 L engine size
$$Carbon \, dioxide \, \left( {{\text{CO}}_{ 2} } \right) \, \% \, = \, - \, 0.4687 \, \lambda \, + \, 17.545$$(5)where Carbon dioxide (CO2) % = exhaust carbon dioxide (CO2) emission percentage, λ = air–fuel equivalence ratio or lambda
-
3.
The relation between measured lambda (λ) and exhaust emitted carbon monoxide (CO) percentages: the measurement results show that as the lambda (λ) values increase, the carbon monoxide (CO) emission is decreasing (see Table 3 and Fig. 9). Where availability of oxygen (O2) helps in better fuel combustion and reduces the emission of carbon monoxide (CO) which produces from incomplete combustion of fuel. In the complete combustion of fuel produce only carbon dioxide (CO2) and water.
Fig. 9 
The relation between air–fuel equivalence ratio or lambda (λ) values and carbon monoxide (CO) exhaust emission percentages-1.6 L engine size
-
4.
The relation between measured lambda (λ) and exhaust emitted hydrocarbons (CxHy) values: the measurement results show that as the lambda (λ) values increase, the hydrocarbons (CxHy) emission is decreasing (see Table 3 and Fig. 10). Where availability of oxygen (O2) helps in better fuel combustion and reduces the emission of hydrocarbons (CxHy) which produce from incomplete combustion of fuel. In the complete combustion of fuel produce only carbon dioxide (CO2) and water.
Fig. 10 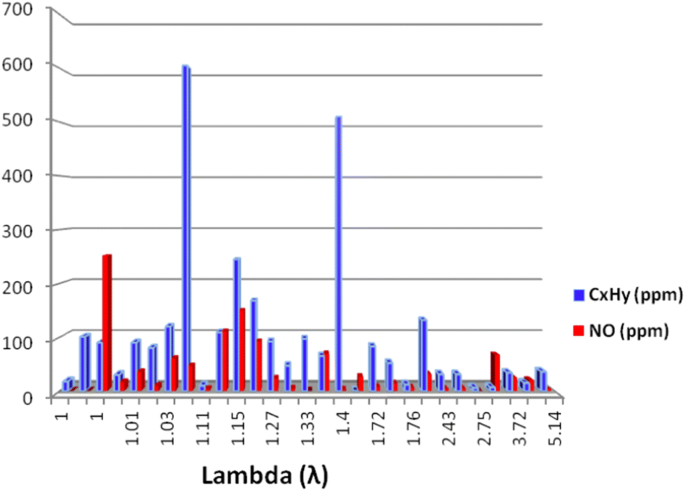
The relation between air–fuel equivalence ratio or lambda (λ) values and hydrocarbons (CxHy) and nitrogen oxide (NO) exhaust emission values-1.6 L engine size
-
5.
The relation between measured lambda (λ) and exhaust emitted nitrogen oxide (NO): the measurement results show that the increase of lambda (λ) values not having the complete influence on nitrogen oxide (NO) emission values as nitrogen is primarily from two sources, the air that mixes with gasoline inside the engine or/and from the fuel itself (nitrogen enriched gasoline) (see Table 3 and Fig. 10).


10.4 Analyze and predict the relationship between the air–fuel ratio (AFR), lambda (λ) and the exhaust emissions percentages and values for 2.5 L gasoline engine size
To study the relation between air–fuel ratio (AFR), lambda (λ) and the exhaust emissions percentages and values for 2.5 L gasoline engine size, the collected data for each vehicle including manufacturing company, manufacturing year, air–fuel ratio (AFR), lambda (λ) and exhaust emissions percentages and values were summarized and illustrated in Table 4.
10.5 The relation between the air–fuel ratio (AFR) and air–fuel equivalence ratio or lambda (λ)
For the vehicle with 2.5 L engine size, the measured λ values ranged from 0.99 to 2.51 (see Table 4), wherein theoretical, λ = 1.0 is at stoichiometric AFR, and lean mixtures have λ > 1.0. The measured values of AFR ranged from 14.56:1 to 36.92:1 (see Table 4), where the theoretical AFR for a gasoline engine, for a complete combustion, the stoichiometric AFR is around 14.7:1 and AFR > 14.7:1 is lean. The λ and AFR measurements indicate that the entire vehicles operated with air–fuel mixtures ranged between almost or near stoichiometric and lean mixtures.
Lambda is the ratio of actual AFR to stoichiometric AFR, according to that the measurements show that the stoichiometric AFR is 14.71:1, where the measured AFR value corresponding to measured λ = 1 was 14.71:1 (see Table 4). For the measured AFR and λ values a polynomial relation determined with high R-squared (R2) = 95.74%, which mean high accuracy (see Eq. 6 and Fig. 11).
where AFR = air–fuel ration, λ = air–fuel equivalence ratio or lambda

The relation between air–fuel equivalence ratio or lambda (λ) and air–fuel ratio (AFR) for the vehicles with engine size 2.5 L
10.6 The relation between air–fuel equivalence ratio or lambda (λ) and exhaust emissions percentages and values
The relation between measured lambda (λ) and exhaust emission gases, which included oxygen (O2), carbon dioxide (CO2), carbon monoxide (CO), nitrogen oxide (NO), and hydrocarbons (CxHy) were studied and discussed as in the following:
-
(1)
The relation between measured lambda (λ) and exhaust emitted oxygen (O2) percentages: the measurement results show that as the lambda (λ) values increase, the oxygen (O2) emission is increasing (see Table 4 and Fig. 12). In the ideal or complete combustion, all of the oxygen (O2) will be consumed with the fuel and produce only carbon dioxide (CO2) and water. For the measured λ values and O2 percentages, a linear relation determined with high R-squared (R2) = 94.05%, which mean a relatively high accuracy (see Eq. 7 and Fig. 12).
Fig. 12 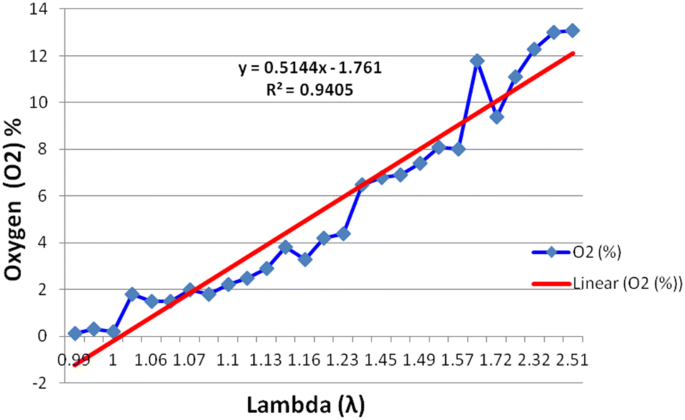
The relation between air–fuel equivalence ratio or lambda (λ) values and oxygen (O2) exhaust emission percentages-2.5 L engine size
$$Oxygen \, \left( {O_{2} } \right) \, \% \, = \, 0.5144 \, \lambda \, {-} \, 1.761$$(7)where Oxygen (O2) % = exhaust oxygen (O2) emission percentage, λ = air–fuel equivalence ratio or lambda
-
(2)
The relation between measured lambda (λ) and exhaust emitted carbon dioxide (CO2) percentages: the measurement results show that as the lambda (λ) values increase, the carbon dioxide (CO2) emission is decreasing (see Table 4 and Fig. 13). In the complete combustion of fuel produce only carbon dioxide (CO2) and water. For the measured λ values and CO2 percentages a linear relation determined with high R-squared (R2) = 92.62%, which mean a relatively high accuracy (see Eq. 8 and Fig. 13).
Fig. 13 
The relation between air–fuel equivalence ratio or lambda (λ) values and carbon dioxide (CO2) exhaust emission percentages-2.5 L engine size
$$Carbon \, dioxide \, \left( {CO_{2} } \right) \, \% \, = \, - \, 0.3864 \, \lambda \, + \, 16.892$$(8)where Carbon dioxide (CO2) % = exhaust carbon dioxide (CO2) emission percentage, λ = air–fuel equivalence ratio or lambda
-
(3)
The relation between measured lambda (λ) and exhaust emitted carbon monoxide (CO) percentages: in general, the measurement results show that as the lambda (λ) values increase, the carbon monoxide (CO) emission is decreasing (see Table 4 and Fig. 14). Where availability of oxygen (O2) helps in better fuel combustion and reduces the emission of carbon monoxide (CO) which produce from incomplete combustion of fuel. In the complete combustion of fuel produce only carbon dioxide (CO2) and water.
Fig. 14 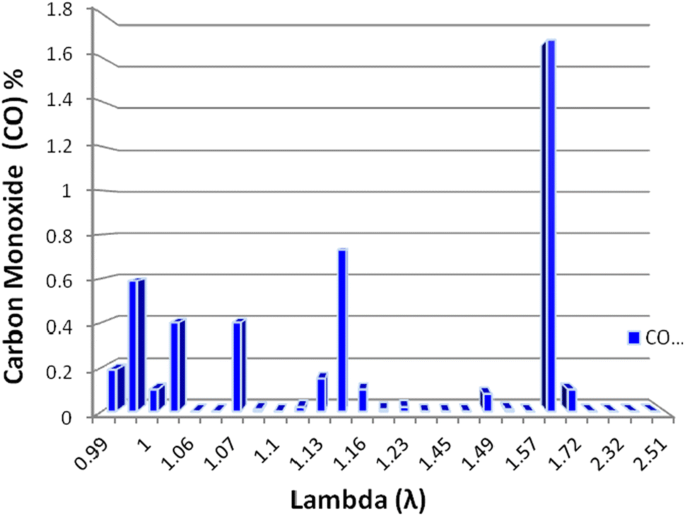
The relation between air–fuel equivalence ratio or lambda (λ) values and carbon monoxide (CO) exhaust emission percentages-2.5 L engine size
-
(4)
The relation between measured lambda (λ) and exhaust emitted hydrocarbons (CxHy) values: in general, the measurement results show that as the lambda (λ) values increase, the hydrocarbons (CxHy) emission is tend to decrease except some abnormal values (see Table 4 and Fig. 15). Where availability of oxygen (O2) helps in better fuel combustion and reduces the emission of hydrocarbons (CxHy) which is produce from incomplete combustion of fuel. In the complete combustion of fuel produce only carbon dioxide (CO2) and water.
Fig. 15 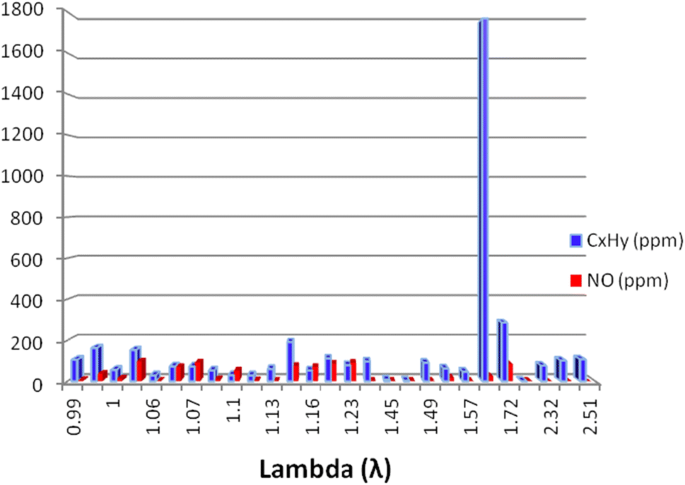
The relation between air–fuel equivalence ratio or lambda (λ) values and hydrocarbons (CxHy) and nitrogen oxide (NO) exhaust emission values-2.5 L engine size
-
(5)
The relation between measured lambda (λ) and exhaust emitted nitrogen oxide (NO): the measurement results show that the increase of lambda (λ) values not having the complete influence on nitrogen oxide (NO) emission values as nitrogen is primarily from two sources, the air that mixes with gasoline inside the engine or/and from the fuel itself (nitrogen enriched gasoline) (see Table 4 and Fig. 15).


11 Conclusion
Based on the results of this study, the following points can be concluded:
-
1.
The vehicle’s exhaust gasses emission analyzers are effective versatile and portable emissions measurement tools, measure and analyze exhaust gases from vehicles and provide a very good range of data and results.
-
2.
Most or almost all the vehicles included in this study were operating with AFR range between stoichiometric (λ = 1.0) to lean (λ > 1.0) mixtures.
-
3.
For the vehicles with both engine sizes 1.6 and 2.5 L:
-
A.
A direct relationship between air–fuel ratio (AFR) and lambda (λ) in the form of polynomial equations with high accuracy determined based on field data and measurements, which can help in understanding the relation between air–fuel ratio (AFR) and lambda (λ) and determine the value of any one of them if the other value is known.
-
B.
A direct relationship between lambda (λ) and exhaust oxygen (O2) emission determined whereas the lambda (λ) values increase, the oxygen (O2) emission is increasing. A relationship between lambda (λ) and oxygen (O2) emission in the form of linear equations with high accuracy determined based on field data and measurements, which can help in understanding the relation between lambda (λ) and oxygen (O2) emission and determine the value of any one of them if the other value is known.
-
C.
A direct relationship between lambda (λ) and exhaust carbon dioxide (CO2) emission determined whereas the lambda (λ) values increase, the dioxide (CO2) emission is decreasing. A relationship between lambda (λ) and dioxide (CO2) emission in the form of linear equations with high accuracy determined based on field data and measurements, which can help in understanding the relation between lambda (λ) and dioxide (CO2) emission and determine the value of any one of them if the other value is known.
-
D.
As the lambda (λ) values increase, the carbon monoxide (CO) emission is decreasing, where availability of oxygen (O2) helps in better fuel combustion and reduces the emission of carbon monoxide (CO) which produce from incomplete combustion of fuel. In the complete combustion of fuel produce only carbon dioxide (CO2) and water.
-
E.
As the lambda (λ) values increase, the hydrocarbons (CxHy) emission is decreasing, where availability of oxygen (O2) helps in better fuel combustion and reduces the emission of hydrocarbons (CxHy) which produce from incomplete combustion of fuel. In the complete combustion of fuel produce only carbon dioxide (CO2) and water.
-
F.
The increase of lambda (λ) values is not having the complete influence on nitrogen oxide (NO) emission values as nitrogen is primarily from two sources, the air that mixes with gasoline inside the engine or/and from the fuel itself (nitrogen enriched gasoline).
The results of this study provides better understating to the relation between air–fuel ratio (AFR), lambda (λ) and the gasoline-fueled vehicles exhaust emissions percentages and values, because it is connecting the actual field measurements and results with theoretical relation between air–fuel ratio (AFR), lambda (λ) and the gasoline-fueled vehicles exhaust emissions percentages and values. Also as part of this study results a significant relations determined between the studied variables in the form of polynomial and linear equations with high accuracy, which helps in understanding the relation between the studied variables and determining the values of some of the variables if the others were known.
References
Di Leo R (2015) Methodologies for air-fuel ratio and trapped mass estimation in diesel engines using the in-cylinder pressure measurement. Energy Procedia 2:957–964
Howlett R, Walters S, Howson P, Park I (1998) Air-fuel ratio measurement in an internal combustion engine using a neural network. Department of Electrical and Electronic Engineering, University of Brighton, Moulsecoomb, Brighton
Lauber J, Guerra TM, Dambrine M (2011) Air-fuel ratio control in a gasoline engine. Int J Syst Sci 42(2):277–286
World Heritage Encyclopedia (2016) Air–fuel ratio. Retrieved from http://self.gutenberg.org/articles/eng/Air–fuel_ratio
X-engineer.org (2018) Air-fuel ratio, lambda and engine performance, 2018. [Online]. https://x-engineer.org/category/automotive-engineering/internal-combustion-engines/performance/. Accessed 26 Feb 2018
Heywood J (1988) Internal combustion engine fundamentals. McGraw-Hill Book Co., New York
Poloni T, Johansen T, Rohaľ-Ilkiv B (2006) Modeling of air-fuel ratio dynamics of gasoline combustion engine with ARX network, vol 6
E Instruments International LLC (2017) F5000-5GAS instruction and operations manual-version 1.01
E Instruments International (2017) F5000-5GAS catalog
Hasan M, Rahman S, Paul N, Halder PK, Alam M, Raquib MA, Islam MA, Khan PA (2013) Analysis of exhaust emission of vehicles in Dhaka City of Bangladesh. Glob J Sci Front Res Environ Earth Sci. https://globaljournals.org
Michael House A (2015) Part load characterization of a small-bore diesel piloted dual fuel compression ignition engine with methane. Queen’s University, Kingston
Aditya S, Anil K (2016) Analysis of emission characteristics of MPFI gasoline engine using the 5 gas analyser. IJARIIE 2(2):1052–1062
Winer A, Zhu Y, Paulson S (2014) Carmageddon or Carmaheaven? Air quality results of a freeway closure. ACCESS 2014. http://www.accessmagazine.org
U.S. Environmental Protection Agency (1999) Indicator of the environmental impacts of transportation
Victoria Transport Policy Institute (2017) Transportation cost and benefit analysis II: air pollution costs
Author information
Authors and Affiliations
Corresponding author
Ethics declarations
Conflict of interest
The author declares that there is no conflict of interest.
Additional information
Publisher's Note
Springer Nature remains neutral with regard to jurisdictional claims in published maps and institutional affiliations.
Rights and permissions
About this article

Cite this article
Al-Arkawazi, S.A.F. Analyzing and predicting the relation between air–fuel ratio (AFR), lambda (λ) and the exhaust emissions percentages and values of gasoline-fueled vehicles using versatile and portable emissions measurement system tool. SN Appl. Sci. 1, 1370 (2019). https://doi.org/10.1007/s42452-019-1392-5
Received:
Accepted:
Published:
DOI: https://doi.org/10.1007/s42452-019-1392-5