
Abstract
Fused filament fabrication allows for the additive manufacturing of complex geometries without requiring moulds. However, due to large air voids and poor layer adhesion, the mechanical properties of parts manufactured using fused filament fabrication lag behind those of parts manufactured using conventional techniques. A previous study found that the tensile strength and Young’s modulus of such parts could be increased by a heat-treatment process. However, large air voids were still present after annealing. This study, therefore, investigates the influence of a post-pressure-treatment process on the mechanical performance and the air void ratio of continuous glass fibre-reinforced polyamide 6 in the directions perpendicular to the fibres. Without the treatment, Young’s modulus on the plane parallel to the printing bed is eight times higher than Young’s modulus perpendicular to it. Annealing at 1 MPa homogenises the material and leads to a significant increase of both the tensile strength (55 MPa) and Young’s modulus (5 GPa). Increasing the pressure to 3 MPa only slightly increases the mechanical performance, whereas a further increase to 6 MPa causes no significant changes.
1 Introduction
Fused filament fabrication (FFF) is a method of producing thermoplastic parts during which a thermoplastic filament is melted by a heater block and then extruded through a nozzle moving on a two-dimensional plane. A three-dimensional part is created by stacking multiple layers on top of each other. The performance of these parts can be significantly improved when continuous fibres are embedded into the filament. An overview of the existing body of knowledge regarding the mechanical performance of such parts can be found in [1].
Due to the heat flow and the cooling down of the finished layer, the adhesion between layers is not as strong as the adhesion between individual strings forming a layer. Therefore, the matrix strength and stiffness in the build-up direction is worse than in the perpendicular direction [2]. In addition, the interlaminar shear strength is very low compared to other fibre-reinforced plastics [3].
A previous study determined that heating these additively manufactured parts in a container filled with mineral oil significantly increases the tensile strength and Young’s modulus [4]. For the chopped fibre-reinforced filament, the air void ratio did not change, whereas it significantly increased for the continuous glass fibre-reinforced material. This finding was concluded to be a result of the spring tension stored in the bent fibres.
Wang et al. made similar observations regarding the air-inclusions when analysing the annealing effects of continuous carbon fibre-reinforced amorphous thermoplastic for temperatures between 50 and 200 °C [5]. As was the case for the continuous glass fibre-reinforced thermoplastic, their material contained air voids due to the printing process before the heat treatment process. While annealing at 100 °C for 4 h led to a 1% decrease in air voids, annealing at 200 °C led to a 6% increase.
Qinghao et al. subjected additively manufactured parts to 5 MPa of pressure for 10 min after heating them to 230 °C [6]. The initial air void content of 12% was reduced to 6%, and the flexural strength increased by 93% as a result. While the material used by Qinghao et al. was marketed as a continuous carbon fibre pre-impregnated with polyamide 6, further in-depth investigation of the filament showed that it was an amorphous thermoplastic [7]. Instead of applying constant pressure, the researchers chose to use spacers to control the material’s thickness. Pascual-González et al. conducted similar experiments but with temperatures between 70 and 270 °C and applying 1 MPa of pressure for 15 min with samples heated on a heating plate [8]. While temperatures of up to 170 °C led to a significant decrease in porosity, large air voids close to the edges of the part remained after the treatment. Almost complete consolidation was observed for temperatures of 210 °C and above. However, the parts’ thickness decreased due to the application of force from the top, while the width and length increased as the annealing temperature was increased. As a result, annealing at 150 °C was recommended.
As mineral oil is incompressible, a logical next step is to simultaneously apply pressure to address the high air void ratio. The main purpose of this study is to determine to what extent the strength and stiffness can be increased and the air void ratio decreased by applying pressure and heat to additively manufactured continuous fibre-reinforced parts. As previous studies observed in other studies, the material runs away when just applying pressure from one side, a mould press was chosen for this study. The mould prevents the diffluence of the high-viscosity polyamide and is expected to create an environment similar to that in an autoclave.
The main difference between the existing literature and the present study is the material that is being used as well as the method for pressure application. In this work, a semicrystalline glass fibre-reinforced thermoplastic is investigated, whereas previous works focused on a carbon fibre-reinforced amorphous thermoplastic. In addition, a pressure-controlled mould press is used instead of applying the pressure only from one side. Furthermore, the effect of different pressures is investigated. This study provides a solid foundation for taking the post-pressure-treatment from the laboratory to the industrial scale.
2 Experimental setup
2.1 Materials
This work focuses on parts produced by a Markforged “Mark Two”. The proprietary software that controls the printer mandates that all parts must be surrounded by at least one layer of Onyx, which is polyamide mixed with chopped carbon fibres, on all sides. The material was processed as it was delivered, without subjecting it to any thermal or dehumidifying procedures. It was stored in a dehumidified storage box as recommended by the manufacturer. An in-depth analysis of the raw filament can be found in [7]. It is polyamide 6 with a fibre volume content of 32% and Young’s modulus of the fibres is 82GPa.
2.2 X-ray radiography
To quantitatively compare the reduction of air voids within the material, X-Ray radiography was used. Images were taken with a “Y. Cheetah” X-Ray System from “YXLON International” set to 100 kV and 39 µA.
2.3 Microscopy
Magnified images of the fracture surfaces of the different test tokens were captured by a Leica MZ6 with an Axiocam 305 Color attached to it. For higher magnifications, a LEO 1430 scanning electrode microscope was used with the beam voltage set to 20 kV.
2.4 Thermal characterisation
A “DS821e” differential scanning calorimeter (DSC) from “Mettler Toledo “ with a “FRS5” sensor was used to analyse the samples with a temperature rate of 10 K/min with 5 mg samples in standard 40 µl pierced aluminium pans starting from 30 °C and up to 230 °C according to ASTM D3418 [9]. Calibration of the measurement device was conducted according to the user manual and standard using Indium as reference material. The test chamber was purged with 50 ml/min of nitrogen, and each measurement was repeated twice. Samples were extracted with a sharp cutting tool such that a flat surface resulted. The degree of crystallinity K is calculated as
where ΔHmeassured is the measured melting enthalpy and ΔH100% is the melting enthalpy for a 100% crystalline material. There is a lack of consensus about the exact value, but most researchers have agreed on 230 J/g for polyamide 6 [10]. The mass of the plastic is calculated as
using the same densities (\(\rho\)) and fibre volume content (\(\varphi )\) as in the previous study [4].
2.5 X-ray diffraction
X-ray diffraction (XRD) measurements were performed using a Malvern Panalytical Empyrean. The machine was equipped with a cobalt cathode (wavelength = 1.7890100 Å), and the voltage and current were set to 40 kV and 30 mA. The intensity data were collected from 10° to 40° every 0.02° for a period of 0.7 s.
2.6 Mechanical testing
Tensile testing was performed on an Instron 5966 machine. The strain rate was set to 0.01/min as recommended by ASTM D3039 to achieve a quasi-static load [11]. Notch effects, which can result from using mechanical gages, were avoided by using an Instron 2663-901 video extensometer for non-contact strain measurements. The length, height and width at the centre were measured using a calliper.
All test tokens are designed according to the ASTM D3039 standard with a length of 110 mm. In our previous study, aluminium tabs were used, and the test samples produced acceptable failure modes (failure within the gauge section). However, the pressure-treated samples failed directly at the tabs. As reported, the materials’ inner defects in the previous study led to failure, which most likely overshadowed any inhomogeneities at the tabs. The standard does not dictate a specific material; thus, epoxy-laminated circuit board was tested, as recommended by Adams [12]. This test also led to tab failure; therefore, polyamide tabs were tested, which produced acceptable failure modes.
The coordinate axes were named in accordance with previous works on conventional fibre-reinforced plastics. “X1” refers to the fibre direction, “X2” is perpendicular to “X1” and on the same plane and “X3” is perpendicular to the printing bed (often referred to as the lay-up or build-up direction). In transverse isotropic materials, the stiffnesses and strengths in the “X2” direction are the same as in the “X3” direction (comp. Fig. 1). This work focuses on the material performance in the “X2” and “X3” directions.

Coordinate System for laminates. “X1” is the fibre direction, “X2” is perpendicular to the fibres and within one layer and "X3" is perpendicular to the fibres and perpendicular to the layer (build-up direction for 3D printing) [4]
Tensile samples As in the previous study, a rectangular tube with a concentric fill pattern was printed, from which the tokens for the build-up strength test (“X3” direction) were extracted (comp. Fig. 2) [4]. The “start rotation percent,” which determines the location of the starting point, was chosen to be either 1%, 26%, 51% or 76%. Through this method, the starting point of the fibre paths was in the corners and the samples were therefore homogenous in the tested section. The starting point is illustrated in Fig. 2 in the top right corner. As mentioned in the introduction, the printer mandates a chopped carbon fibre outer layer for the continuous glass fibre samples. The chopped carbon fibre layer is represented as a white line in the figure, whereas the orange line represents the glass fibre paths. The layer height for both materials was 0.1 mm. The test tokens for the “X2” direction were printed individually with the dimensions shown in Fig. 3. After the pressure treatment, the edges were milled off to achieve homogenous samples with no connecting ends.

Rectangular tube with cutting patterns for the extraction of the X3 test tokens (left), cross-section of the rectangular tube. The fibre paths are orange and the onyx paths are white. Starting point of the fibre path is in the top right corner (right) [4]

X2 tensile test geometry with cutting patterns. The fibre paths are orange and the onyx paths are white
Cutting The cuts were made using a Mutronic Diadisc 4200 high-precision saw equipped with a custom air-cooling system that uses high-pressure air from the system in the workshop.
2.7 Damping and modal frequencies
The influence of the pressure treatment on the damping and modal frequencies of the X2 tensile test tokens was evaluated using Siemens “LMS Test.Lab”. A Polytec PDV-100 laser vibrometer was used to measure the vibrations. This option was chosen because attaching an accelerometer would significantly influence the mass and damping resulting in inaccurate measurements.
Vibration excitation via a loudspeaker was tested. However, due to the small sample area, it was not possible to sufficiently transfer enough energy into the sample even at elevated sound levels. The result was very distorted signals, which did not provide reliable information. However, the same setup was successfully tested with larger composite plates, producing accurate results. The samples were consequently exited with a “PCB 084A17” impulse hammer that is designed for low mass. For each point, the measurement was performed out five times and the coherence and frequency response functions were monitored. The measurement was discarded and repeated in if any error was detected (e.g., pushing the sample instead of giving an impulse).
2.8 Heat treatment
A “Memmert 100–800” oven, which allows the setting of ramp-up and cool-down heat rate as well as the hold temperature in between, was used. This oven has two P100 temperature sensors built in, which are positioned at the top of the chamber. The air circulation fan was set to its maximum speed to ensure that no temperature gradient built up inside the heat chamber.
2.9 Finite element analysis
For the finite element analysis, the structural analysis and simulation software from ANSYS® was used. The mesh was created using the auto meshing feature with a 0.5 µm mesh size, and tetrahedral elements were used.
3 Design of experiment
The post-treatment strength is expected to be a function of the annealing temperature, annealing time and heat-up and cool-down rates. In the preceding investigation, a heat-up rate of 15 K/h and a cool-down rate of 10 K/h were chosen. To improve the throughput time and thereby achieve a higher practical relevance, a heating rate of 60 K/h and a cooling rate of 40 K/h were used in the present study. Figure 4 illustrates the XRD analysis for the increased heating and cooling rates without any pressure applied. The gamma phase, which forms when the polyamide is fast cooled from the molten state, gets transformed into the alpha phase [13]. Thus, this increase did not cause a change in the phase transformation compared to the slower cooling rate. Any observed changes were caused by the applied pressure.

Effect of heating and cooling rates on the crystalline phases
While the previous study showed that paraffine oil is a suitable annealing medium, the simultaneous application of pressure was deemed too dangerous in the context of a university project. A failure of the container containing 200 °C hot oil at a pressure of 6 MPa (60 bars) would be a very serious health hazard.
Therefore, a mould press was designed to create the pressure. Figure 5 presents the different components. A steel stamp and mould are connected by six screws with an M10 thread. Disc springs are used to apply and sustain the pressure. The device containing the test tokens was heated up to 200 °C and the pressure was then applied using disc springs. After 30 min, the pressure was released and the part cooled down at the defined cooling rate.
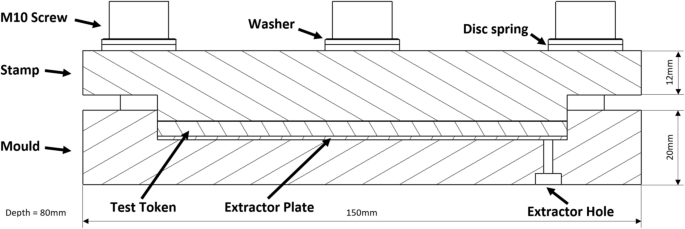
Cross-section of the pressure device
4 Testing results
This chapter presents the results of the DSC, XRD, damping, optical analysis and the mechanical. The following chapter discusses the results in further detail.
4.1 DSC analysis
Figure 6 presents the results of the DSC analysis. The top curve represents the non-treated material as a reference. The wide melting peak indicates the presence of mixed crystal sizes [14]. The second curve from the top shows the sample annealed at 200 °C for 6 h at atmospheric pressure. The peak is significantly narrower than the reference curve, which makes it likely that the crystals have grown/merged. The increase in melting temperature due to annealing was previously observed for polyamide 12 and was attributed to an improvement in the crystalline order [15]. The tokens annealed under pressure at 200 °C (but only for 30 min) also exhibited a significantly narrower peak. However, the melting temperature did not increase. The different pressures also had no significant effect on the degree of crystallinity, which was measured to be 17.8% on average. This level is slightly lower than the 20.4% crystallinity measured for the samples annealed at 6 h.

DSC analysis of the non-annealed, heat- and pressure-treated samples
4.2 XRD analysis
Figure 7 illustrates the results of the XRD analysis for the different annealing pressures, including both the gamma phase at 24.9° as well as the alpha phase with peaks at 23.4° and 28°. In the untreated material, the gamma phase was dominant, but the broad shoulders show small amounts of the alpha phase. As reported in the previous study, the heat treatment process causes a solid-state phase transition [4]. The applied pressure treatment had no influence on this transition; as a result, the gamma phase fully transitioned into the alpha phase as was the case when no pressure was applied.

XRD analysis for the different pressures
4.3 Tensile testing
Figure 8, Tables 1, 2 and 3 present the results of the tensile tests for both the X2 (dashed line) and X3 (continuous line) directions. For the untreated samples (black line), Young’s modulus in the X3 direction was eight times smaller (0.6 GPa vs 4.3 GPa) and the ultimate tensile strength four times smaller (7 MPa vs 29 MPa) than in the X2 direction.

Averaged stress–strain diagram for the X2 and X3 directions for different pressures. The values for the non-treated and annealed samples were taken from [4]
However, when applying 1 MPa of pressure (red line), Young’s moduli are almost equal, with 4.9 GPa in the X3 direction and 5.2 in the X2 direction. The ultimate tensile strength increased to 55 MPa for the X2 direction and 34 MPa for the X3 direction. While an increase in pressure to 3 MPa led to a 0.5 GPa increase in Young’s modulus, a further increase to 6 MPa did not lead to a further increase in Young’s modulus in the X2 direction. The same observation was made for the tensile strength. In the X3 direction, an increase to 3 MPa led to a 0.2 GPa decrease for Young’s modulus and a 7 MPa decrease for the tensile strength. However, these tensile strength results in the X3 direction do not represent the full potential of the material, as further discussed in Chapter 1.
Figure 9 presents the unedited stress–strain diagrams for an untreated and pressure-treated X2 sample. There are two phenomena visible: noise from the very beginning for both graphs and “steps” occurring only in the pressure-treated samples. These “steps” occurred for all pressure-treated samples in both directions starting at strains between 0.3 and 0.5%. It is very likely that these “steps” represent crack growth along with the fibre-matrix interface. However, this hypothesis should be verified using computed tomography (CT) imaging.

Unedited stress–strain diagrams for pressure-treated and non-treated samples
4.4 Geometric changes
Table 4 presents the dimensions of the test tokens before and after the pressure treatment. The width of the test tokens was not affected by the pressure treatment, whereas the height and length decreased. It should be noted that the width of the X3 test tokens was a result of the cutting process and not the printing process. At 1 MPa, the length is decreased by 1.6% on average and the height by 8.5% for the X2 test tokens. While there was no further length decrease when 3 MPa of pressure were applied, the height decreased by a further 5%. An increase in pressure to 6 MPa did not lead to further dimensional changes. The changes in the X3 samples were similar.
4.5 X-ray radiography
Figure 10 depicts the results for the X-Ray radiography analysis, where the brightness is indirectly proportional to the density (white = low density). To make the air inclusions clearly visible, the brightness and contrast of the images were increased. As this measurement projects a three-dimensional part onto a two-dimensional plane, only quantitative information could be obtained. Computer tomography would allow for more detailed information, but this technology was not available. Nonetheless, the images reveal that the non-treated sample has bright stripes located close to the fibre bends and the centre. These stripes were most likely caused by large air inclusions, as the density of air (0.0012 kg/m3) is significantly less than the density of polyamide 6 (1.2 g/cm3) and the density of glass fibre (2.5 g/cm3). Thus, the air voids appear brighter. Furthermore, there are ± 45° lines visible. These lines resulted from the mandatory non-reinforced layers mentioned in Sect. 2.1.

X-Ray radiographic images of the non-treated and post-processed “X2” test tokens. The contrast and brightness were increased for better visualisation. The continuous red line indicates the fibre path and the arrows mark large air inclusions. Brighter colours corelate with a lower density. The slightly visible ± 45° lines for the untreated sample originate from the non-reinforced layers. At 3 and 6 MPa of pressure, there were no visible differences between the X-Ray images; therefore, only one was included
The stripes at the bends became smaller when 1 MPa of pressure was applied and disappeared in the parts centre. At 3 and 6 MPa, no bright stripes could be observed. Furthermore, at 3 and 6 MPa, the images’ overall brightness became slightly darker in direct comparison to the other images, meaning that the air void content further decreased.
4.6 Optical microscopy
Optical microscopy of the samples’ cross-sections allowed for a more detailed analysis of the decrease in air voids. Based on the X-Ray analysis, the air voids were expected to decrease as the distance from the fibre bends increased. The cross-sections at the fibre bends and close to the centre were consequently analysed. As illustrated in Fig. 11, the non-treated sample has both large columns as well as a significant number of small air inclusions. When treated with 1 MPa, the small air inclusions were greatly reduced, but the large air columns remained. This change led to a drop from 10.5 to 5.5% in air inclusions. Although the air void ratio significantly dropped when further increasing the pressure, the difference between the 3 MPa (0.5%) and 6 MPa (0.3%) pressure treatment was only minor.

Air inclusions close to the fibre bends
The cross-sections close to the centre exhibited a similar pattern (see Fig. 12). While the air inclusions significantly reduced compared to the ones close to the fibre bends, the air void ratio was still 3.8%. It is important to note here that some of the embedding material found its way into the non-treated sample. As a result, the air voids in the centre of the figure appear bright instead of dark. In contrast to the cross-section close to the fibre bends, the 1 MPa treatment achieved a large reduction of the air voids in the parts centre, similar to the reduction at 3 MPa (0.5%) and 6 MPa (0.3%). The change in air inclusions is summarised in Table 5. These observations align with the results from the X-Ray analysis; however, to achieve a higher statistical relevance, a CT analysis should be conducted.

Air inclusions close to the samples’ centre
Figure 13 depicts the fractured X3 (left) and X2 (right) samples. The X3 samples, which were not milled off after annealing, exhibited oxidation on the outside, indicated by the brown surface. As the X2 samples were milled off to eliminate the fibre connections, there was no oxidised layer. While the mould itself was closed during the whole heating cycle, it was not airtight.

Fracture surface of the X3 sample (left) with visible oxidation and X2 sample (right) with milled-off sides
4.7 Scanning electron microscopy
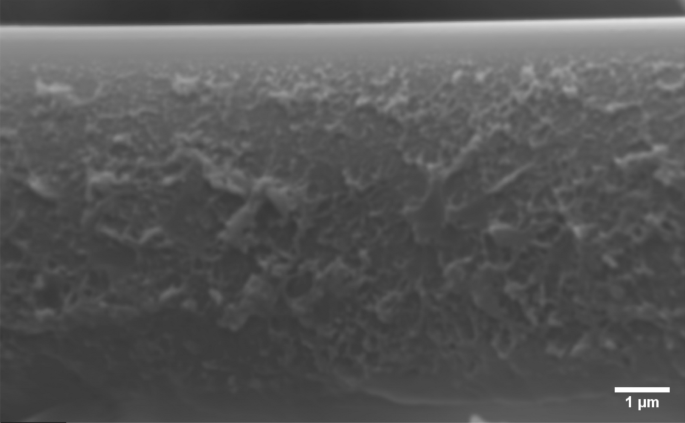
Figure 14 presents magnified images of the fracture surface for the non-treated X2 sample taken with the scanning electron microscope. As illustrated in Fig. 14a, b, most fibres on the surface have almost no matrix material on them, as if it has been stripped of. While these images only illustrate a small frame, they are representative of the whole fracture surface. At 10,000 × magnification (Fig. 14c), partial delamination can be observed. A piece of polyamide is partially detached from the fibre (right-hand side) and the other half is still attached to it. In the upper half of the image, there is residue visible on the fibre. It is unclear whether it is the fibre coating that is breaking off or matrix material. The image could not be focused any further beyond a magnification of 20,000×, but as is illustrated in Fig. 15, the residue is most likely matrix material adhering to the fibre, as the infrared analysis in the previous study indicated the use of alkoxysilane compounds as a sizing agent [4]. These compounds would not exhibit such ductile behaviour. This ductile deformation at the fibre-matrix interface indicates a good connection between the glass fibre and the polyamide.

Fracture surface of the non-treated X2 sample magnified 300× (a); 1000× (b) and 10,000× (c)
Residue on the fibre at a 20,000 × magnification
The magnified fracture surfaces of the pressure-treated X2 samples demonstrate a different pattern of damage (comp. Fig. 16). Compared to the non-treated sample, much more matrix material is still adhering to the fibres. The same partial delamination (Fig. 16c) can be observed, but in many more places. In addition, instead of only small pieces still adhering to it, much of the fibre’s surfaces is still covered by or connected to the matrix material (please note that the magnification is 5000×). For both the untreated and postprocessed samples, many broken-off fibres are visible.

Fracture surface of the pressure treated X2 sample magnified 500× (a); 1000× (b) and 5000× (c)
4.8 Damping and modal frequencies
Figure 17 shows the first and second modes determined by the impact measurement. All of the signals are of equal quality, which allows for comparison with one another. The frequencies and damping values are listed in Table 6. The heat and pressure treatment had no significant influence on the material damping. Changes in the frequencies were caused by changes in geometry and in Young’s modulus.

Results of the impact measurements showing the first Eigen frequency
4.9 Unit cell
To determine the theoretical maximum material performance, the constituent’s properties were used to calculate the composite’s elastic properties. For this purpose, it was assumed that the fibre distribution is homogenous and that the element shown in Fig. 18 is a repeating pattern within the material. The boundary surface S of this element is subjected to constant homogenous strain \({\varepsilon }_{ij}^{0}\):

Representative volume element used to determine the elastic properties with a 9.2 µm fibre
It was assumed that the average strains \({\overline{\varepsilon }}_{ij}\) of the composite equal the strains at the boundary surface \({\varepsilon }_{ij}^{0}\) [16]. The displacement field created by \({\varepsilon }_{kl}^{0}\) = 1 can be written using \({u}_{i}^{\left(kl\right)}\left(x\right)\) as:
The resulting strains are calculated as:
Using Hook’s law, the resulting strains are calculated as
where \({C}_{ijpq}(x)\) represents the location-dependent elasticity tensor for the fibre and matrix material. The average stress is calculated by averaging the strains over the volume element:
where \({C}_{ijkl}^{*}\) is the desired elasticity tensor of the composite. The strains were applied via periodic boundary conditions (PBCs). This approach was chosen because displacement boundary conditions cause a stiffer response due to all of the outer surfaces of the unit cell remaining flat [17]. For this reason, PBCs are commonly used for the micromechanical investigation of composite and porous materials [18,19,20,21]. These boundary conditions are achieved by constraining the displacement of opposite nodes of the unit cell:
where \({u}_{j}^{i}\) are the node displacements, \({\varepsilon }_{ij}^{0}\) the macroscopic strain tensor and \({l}_{i}\) the length of the unit cell. An overview of different implementation methods into the FE code can be found in [22]. The calculations were performed using the values shown in Table 7, with a 32% fibre volume content [7]. As polyamides are known to change their properties when absorbing water, calculations for both the dry and conditioned material state were performed. The results are listed in Table 8. As expected, Young’s modulus in the fibre direction was only slightly affected by the change of the matrix properties whereas Young’s modulus in the directions perpendicular to the fibres significantly dropped when the polyamide was conditioned.
5 Discussion
The XRD analysis demonstrated that applying pressure while the material was heated above the melting point did not affect the crystalline structure, nor did the increased heating rate of 60 K/h or cooling rate of 40 K/h. While the DSC analysis revealed no difference in the degree of crystallinity between the different pressures, the sample annealed for 6 h in the previous study exhibited a slightly higher degree of crystallinity and melting point. This finding could explain, why the samples from the previous study showed a slight increase in Young’s modulus independent from the temperature when annealed for 6 h compared to shorter annealing periods.
Analysis of the geometric changes indicated that the width of the samples is not affected by the pressure treatment. This result was expected, as the fibres were aligned in that direction. Unlike the matrix material, the fibres remain solid at the annealing temperature and do not experience any plastic deformation. Thus, unless the fibres are moved during the annealing process, the width cannot be affected. The change in the test token length can be attributed to thermal contraction. When the pressure is applied, the test token takes the shape of the mould at a temperature of 200 °C. During the cool-down phase, the polyamide contracts. This process is independent of the pressure, which is why the decrease in length was almost the same for all pressure levels. The decrease in height is an indicator of the reduction of air voids. However, if the geometry is used for density calculations, the 3D contour should be measured using a coordinate measurement machine. Furthermore, it must be taken into account that the polyamide 6 phases exhibit different densities [26].
The X-Ray analysis indicated an inhomogeneous distribution of air voids, with larger air-inclusions located at the fibre bends. Microscopic analysis confirmed this observation, which is likely a result of the high bending rigidity of the fibres (comp. Fig. 19). At the 180° turns, the bending moment causes a displacement of the strands from their ideal path. The bending moment decreases as the printing nozzle moves further away from the bend. The same effect was reported for carbon fibre-reinforced plastics [6]. As a result, the air voids decrease as the distance to the fibre bends increase. These fibre bends are also likely the reason why, at a pressure of 1 MPa, there were still large air voids present. The compaction process requires a higher pressure to push the fibres closer to each other. A pressure of 3 MPa seems to be high enough, as the large air inclusions at the fibre bends almost completely disappeared. A further increase to 6 MPa did not lead to a significant further decrease in the air void ratio. While these observations align with the measured mechanical properties, the microscopic and X-Ray measurements can only be considered an indicator. For a more precise analysis, a computer tomography analysis is required to determine the 3D distribution of air voids inside the part.

Air voids caused by fibre bends
Nonetheless, the observed insignificant difference between 3 and 6 MPa seems plausible. The high viscosity of the plastic hinders the small remaining air bubbles from escaping. Instead of being squeezed out, they are compressed and remain inside the material. The same effect can be observed in conventional fibre-reinforced plastics manufactured from prepregs, where the high viscosity of the uncured matrix material causes air bubbles to be trapped inside the material [27].
The mechanical tests revealed a high standard deviation in both the untreated and post-processed samples. This result is most likely caused by the air inclusions, fibre orientation, and poor layer adhesion. Variations in the size and distribution of the air voids can lead to localised stress concentrations and premature failure. Misaligned fibres will also influence the mechanical properties, as the fibres have a greater effect on the mechanical properties if they are oriented in the tensile direction. As illustrated in Fig. 19, the fibre bends already cause a slight fibre misalignment at the bends in the untreated state. When pressure is applied, the bends will be squeezed together. However, it cannot be guaranteed that the fibres will align perfectly in this process. Beyond the effect on Young’s modulus, local fibre misalignment can also cause local stress concentration and therefore premature failure. However, despite the deviations, the measurements were able to indicate the effects of different pressure levels on the mechanical properties, which are discussed in the following paragraphs.
In the untreated state, tensile tests revealed that the material exhibited vastly different properties in the X2 and X3 directions. This difference can be attributed to the poor layer adhesion, which mainly affects the build-up (X3) direction. This factor is an important aspect to consider when applying failure criteria that assume transverse isotropic material properties [28]. After the application of 1 MPa of pressure, Young’s moduli in both directions significantly increased with Young’s modulus in the build-up direction still slightly lower. This difference was most likely due to the oxidation of the outer layer, which only remained in the X3 samples as they were not milled off prior to testing. As most studies investigating oxidation behaviour focus on low-temperature oxidation, there is no data available for temperatures of 200 °C. However, at 160 °C, a study indicated that short exposure times of under 1 h cause significant breaking of the polymer chains [29]. Oxidation is also the probable cause of the significant 20 MPa difference in the ultimate tensile strengths between the two testing directions. The very brittle oxidised outer layers are expected to initiate crack growth, leading to premature material failure. Long-term studies have shown that oxidation must also be taken into consideration when using polyamide at temperatures as low as 70 °C [30]. While stabilisation agents have been proven to prevent a drop in tensile strength, the elongation at brake inevitably decreases at prolonged exposure to high temperatures [31].
A further increase of pressure to 3 MPa leads to a further increase in Young’s modulus. This result can be explained by the air voids in the fibre bends, which remained at 1 MPa of pressure. As the air inclusions increase the cross-section used for the calculation of Young’s modulus, Young’s modulus appears lower. At 3 MPa, these air voids almost completely disappeared, which is also why a further increase to 6 MPa did not affect Young’s modulus and tensile strength. Comparison with the theoretical Young’s modulus determined by the finite element method indicates that the post-processed material nearly matches the theoretically achievable Young’s modulus. The difference between the ideal model and the experimental data can be explained by the non-reinforced outer layers.
The small “steps” observed in the stress-stain diagram were most likely caused by localised delamination, evidence of which was found in the SEM images. Similar behaviour can be observed in conventional fibre-reinforced composites, where cracks propagate along with the fibre matrix interface [32,33,34]. This hypothesis should be verified using in-situ tomography tensile testing. For the untreated X2 samples, the primary cause of failure is most likely the large air inclusions. These air-inclusions cause a notch effect and thereby localised stress concentration, initiating part failure. However, as the fibres were not aligned perfectly, they still connected the two halves of the failed test sample. As the tensile test continued, the fibres were slowly pulled out of the matrix, which shows as a horizontal line in the stress–strain diagram. This event would explain the absence of matrix material on the fibres on the fracture surface of the non-treated test tokens as well as the broken-off fibres. As not all fibres were aligned in the same angle, some were pulled out and others broke off. As the pressure treatment significantly reduced the air inclusions, significant energy is built up in the pressure-treated samples, as indicated by the increased ultimate tensile stress. When the part failed, the two halves were separated more abruptly and the fibres were not be pulled out. Therefore, the fracture images of the post-processed samples show much more matrix material still adhering to the fibres.
While dry polyamide 6 has a tensile strength of up to 80 MPa, the achieved strength of 55 MPa is most likely very close to the material’s optimum performance. This is because Young’s modulus of the fibres is significantly higher than Young’s modulus of matrix materials. At a given stress level, the elongation within the matrix is significantly higher than the elongation in the matrix. The fibres also limit the contraction of the matrix material. These effects cause an inhomogeneous stress/strain distribution within the matrix [28]. An illustration of this effect is presented in Fig. 20, where light refraction shows the inhomogeneous stress/strain distribution in a transparent matrix material. Local stress accumulation causes crack initiation, leading to material failure. For conventional composites, the effect has a stronger impact, as thermosets are much more brittle, leading to tensile strengths below 50 MPa [35]. Simulations have demonstrated that this effect causes the crack growth along with the fibre/matrix interface, as described in the previous paragraph [36].
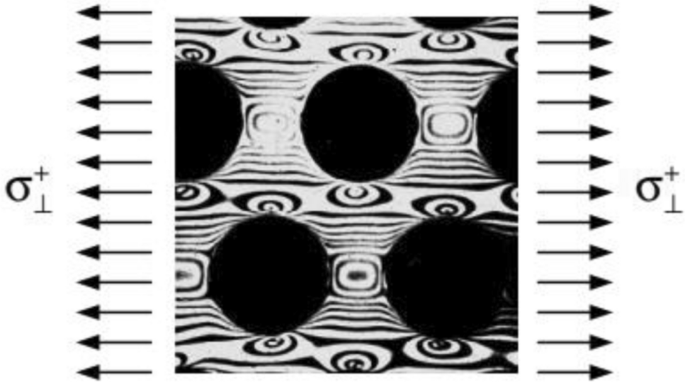
Image of the stress concentration within the transparent matrix [37]
This effect also explains why a further increase in pressure did not significantly increase the tensile strength. As the microscopic and X-Ray analysis indicated, there were more air inclusions present at 1 MPa than at 3 MPa and 6 MPa. In homogenous materials, these inclusions would initiate the crack growth and be the limiting factor. However, for this material, the inhomogeneous stress distribution caused by the embedded fibres seemed to overshadow the influence of the small remaining air inclusion.
6 Future research needs
All of the experiments in this study were conducted using a mould press. Using such a press in practice would take away the benefits of the additive manufacturing process, which does not require a mould. The investigated pressure levels of 1 MPa and 3 MPa can be achieved by commonly available autoclaves that are currently used to cure conventional thermosetting composite materials. However, the pressure of 6 MPa can only be achieved by using an actual mould press. Nonetheless, as the results indicate that there is no significant difference between 3 and 6 MPa, there is no need to use the higher pressure. Future studies should consequently investigate using an autoclave to post-process the additively manufactured composite. When heating the polyamide up to its melting point without a mould, gravity will presumably cause significant material deformation. As shown in a previous study, this effect can be prevented by submerging the parts in mineral oil. The buoyancy effect prevents deformation and protects the polyamide from oxidation [4]. Future research should also investigate how much the heating and cooling rates can be increased to decrease the overall processing time.
As the analysis of the RVE indicated that the composites’ properties significantly change when the polyamide is saturated, this aspect should also be explored. Moisture absorption is a slow process. The test samples used in this study are expected to take roughly nine months to reach equilibrium at normal temperature and air moisture levels [38]. During that time, the outer parts of the material will be saturated, whereas the inner parts will remain dry, which is a factor to consider.
Finally, the failure behaviour of the material under combined loads (e.g., tensile + shear) should be investigated. Failure criteria for conventional composites assume a transverse isotropic material. As demonstrated in this study, this assumption is only met for the pressure-treated material. In the untreated state, the properties in the X2 and X3 directions are significantly different. According to Puck’s failure theory, fibre-reinforced thermoplastics behave like brittle materials if the fibre volume content is sufficiently high [28]. Under pure compressive stress, the brittle material is supposed to fail at a 54° ± 3° fracture plane. A pure compression test is one of the basic tests to see if Puck’s failure theory can be applied. In a previous study, this aspect was investigated for untreated additively manufactured composites [39]. A FEM-optimised test token that is designed for this purpose is presented in Fig. 21a. As illustrated in Fig. 21b, compression test samples failed at the predicted angle. However, at the same time, (vertical) separation of the fibre strands occurred. This separation can also be observed in the compression-strain diagram (Fig. 21c) where a short drop in stress occurred before the sample failure. Based on the findings of this study this failure can be attributed to the large air inclusions. As the results demonstrated that the material is homogenised while the air inclusions significantly decrease, it would be interesting to analyse the compression failure of the pressure-treated material and to investigate the applicability of conventional failure criteria.

a Compression test sample, b compression-strain-diagram and c Front (top) and back (bottom) of a failed compression test sample [39]
7 Conclusion
This study analysed the effects of a post-processing pressure treatment on the mechanical properties and the air void ratio of additively manufactured continuous fibre-reinforced plastics. The tests focused on the properties in perpendicular directions to the fibres. Three different pressure levels were investigated using a mould press. The researchers observed that 1 MPa of pressure significantly decreased the air void and increased the mechanical performance, with Young’s modulus increase from 4.3/0.6 to 5.2/4.9 GPa and a tensile strength increase from 29/7 to 55/34 MPa in the “X2”/”X3” direction. However, air voids close to the fibre bends remained. At a pressure of 3 MPa, these air voids disappeared, leaving only small air voids. Young’s modulus also increased to 5.7/5.1GPa. A further increase of pressure (6 MPa) had no significant effect on the air voids or the tensile strength. However, since no protective atmosphere was used, oxidation occurred, which led to a premature failure of the test tokens in the “X3” direction. The “X2” test tokens were milled off and did not prematurely fail. As a result, the ultimate tensile strength of the “X3” test tokens was significantly lower. Nonetheless, Young’s modulus in both directions was almost identical after the pressure treatment process. This finding does not hold true for the as-printed state, which demonstrates that the pressure treatment process homogenises the additively manufactured composite material. Based on an FEM analysis and the shape of the stress–strain graph, the values obtained for the post-processed “X2” samples are likely to represent the materials’ maximum performance. Future studies should focus on a post-pressure-treatment process using an autoclave and optimisation of the process parameters. Furthermore, an analysis of the failure behaviour under combined loads should be performed.
References
Handwerker M, Wellnitz J, Marzbani H (2021) Review of mechanical properties of and optimisation methods for continuous fibre-reinforced thermoplastic parts manufactured by fused deposition modelling. Progress Addit Manuf 6:663–677
Todoroki A, Oasada T, Mizutani Y, Suzuki Y, Ueda M, Matsuzaki R, Hirano Y (2020) Tensile property evaluations of 3D printed continuous carbon fiber reinforced thermoplastic composites. Adv Compos Mater 29(2):147–162
Caminero MA, Chacón JM, García-Moreno I, Reverte JM (2018) Interlaminar bonding performance of 3D printed continuous fibre reinforced thermoplastic composites using fused deposition modelling. Polym Testing 68:415–423
Handwerker M, Wellnitz J, Marzbarni H, Tetzlaf U (2021) Annealing of chopped and continuous fibre reinforced polyamide 6 produced by fused filament fabrication. Compos B Eng 223(15):109119
Wang K, Long H, Chen YF, Baniassadi M, Rao Y, Peng Y (2021) Heat-treatment effects on dimensional stability and mechanical properties of 3D printed continuous carbon fiber-reinforced composites. Compos Part A 147:106460
Qinghao H, Wang H, Kunkun F, Lin Y (2020) 3D printed continuous CF/PA6 composites: effect of microscopic voids on mechanical performance. Compos Sci Technol 191:108077
Pascual-González C, Iragi M, Fernández A, Fernández-Blázquez J, Aretxabaleta L, Lopes C (2020) An approach to analyse the factors behind the micromechanical response of 3D-printed composites. Compos B Eng 186:107820
Pascual-González C, Martín P, Fernándeza A, León A, Lopes C, Fernández-Blázquez J (2021) Post-processing effects on microstructure, interlaminar and thermal properties of 3D printed continuous carbon fibre composites. Compos B 210:108652
ASTM D3418–15 (2015) Standard test method for transition temperatures and enthalpies of fusion and crystallization of polymers by differential scanning calorimetry. ASTM International, West Conshohocken, PA, 2015, www.astm.org. Accessed 01 June 2021
Klata E, Borysiak S, Van de Velde K, Garbarczyk J, Krucińska I (2004) Crystallinity of polyamide-6 matrix in glass fibre/polyamide-6 composites manufactured from hybrid yarns. Fibres Text Eastern Eur 12(3):64–69
ASTM D3039/D3039M-17 (2017) Standard test method for tensile properties of polymer matrix composite materials. ASTM International, West Conshohocken
Adams DO, Adams DF (2021) “Tabbing guide for composite test specimens,” 01 10 2002. [Online]. http://www.tc.faa.gov/its/worldpac/techrpt/ar02-106.pdf. Accessed 3 Aug 2021
Zhang Y, Zhang Y, Liu S, Huang A, Chi Z, Xu J, Economy J (2010) Phase stability and melting behavior of the α and γ phases of nylon 6. Appl Polym Sci 120(4):1885–1891
UserCom 11 (2000) METTLER TOLEDO, Greifensee, p 3. https://www.eng.uc.edu/~beaucag/Classes/Characterization/DSCParts/Artifacts%20in%20DSC%20Usercom_11.pdf
Gogolewski S, Czerniawska K, Gasiorek M (1980) Effect of annealing on thermal properties and crystalline structure of polyamides. Colloid Polym Sci 258(10):1130–1136
Aboudi J, Arnold S, Bednarcyk B (2013) Micromechanics of composite materials. Butterworth-Heinemann, Oxford
Okereke M, Keates S (2018) Boundary conditions. In: Finite element applications. Springer International Publishing, Basel, pp 243–298. https://link.springer.com/book/10.1007/978-3-319-67125-3
Tian WQL, Chao X, Liang J, Fu M (2019) Periodic boundary condition and its numerical implementation algorithm for the evaluation of effective mechanical properties of the composites with complicated micro-structures. Compos B Eng 162:1–10
Pelukhov E, Keip M-A (2020) Computational homogenization of transient chemo-mechanical processes based on a variational minimization principle. Adv Model Simul Eng Sci 7:35. https://doi.org/10.1186/s40323-020-00161-6
Akpoyomare A, Okereke M, Bingley M (2017) Virtual testing of composites: imposing periodic boundary conditions on general finite element meshes. Compos Struct 160:983–994
Alsayednoor J, Harrison P, Guo Z (2014) Large strain compressive response of 2-D periodic representative volume element for random foam microstructures. Mech Mater 66:7–20
Garoz D, Gilabert F, Sevenois R, Spronk S, Paepegem WV (2019) Consistent application of periodic boundary conditions in implicit and explicit finite element simulations of damage in composites. Compos B Eng 168:254–266
Kern GmbH (2021) “Polyamid 6,” 01 08 2021. [Online]. Available: https://www.kern.de/de/technisches-datenblatt/polyamid-pa-6-e?n=1101_1. Accessed 01 Aug 2021
Polymerservice Merseburg (2021) “Lateral Contraction,” 01 08 2021. [Online]. https://wiki.polymerservice-merseburg.de/index.php/Poissonzahl. Accessed 01 Aug 2021
Swiss Composite (2021) “Composite Material Data,” 01 08 2021. [Online]. https://www.swiss-composite.ch/pdf/i-Werkstoffdaten.pdf. Accessed 01 Aug 2021
Fornes T, Paul D (2003) Crystallization behavior of nylon 6 nanocomposites. Polymer 44(14):3945–3961
Mehdikhani M, Gorbatikh L, Verpoest I, Lomov SV (2018) Voids in fiber-reinforced polymer composites: a review on their formation, characteristics, and effects on mechanical performance. J Compos Mater 53(12):1579–1669
Knops M (2008) Analysis of failure in fiber polymer laminates—the theory of alfred puck. Springer-Verlag, Berlin
El-Mazry C, Hassine M, Correc O, Colin X (2013) Thermal oxidation kinetics of additive free polyamide 6–6. Polym Degrad Stab 98(1):22–36
Zhao X, Li X, Ye L, Li G (2013) Stress–thermooxidative aging behavior of polyamide 6. Appl Polym Sci 129(3):1193–1201
Shu Y, Ye L, Yang T (2008) Study on the long-term thermal-oxidative aging behavior of polyamide 6. Appl Polym Sci 110(2):945–957
Bergan A, Dávila C, Leone F, Awerbuch J, Tan T-M (2016) A Mode I cohesive law characterization procedure for through-the-thickness crack propagation in composite laminates. Compos B Eng 94:338–349
Koerber H, Kuhn P, Ploeckl M, Otero F, Gerbaud P-W, Rolfes R, Camanho P (2018) Experimental characterization and constitutive modeling of the non-linear stress–strain behavior of unidirectional carbon–epoxy under high strain rate loading. Adv Model Simul Eng Sci 5:17. https://doi.org/10.1186/s40323-018-0111-x
Kosmachev PV, Alexenko VO, Bochkareva SA, Panin SV (2021) Deformation behavior and fracture patterns of laminated PEEK- and PI-based composites with various carbon-fiber reinforcement. Polymers 13(14):2268
Kawai M, Saito S (2009) Off-axis strength differential effects in unidirectional carbon/epoxy laminates at different strain rates and predictions of associated failure envelopes. Compos A Appl Sci Manuf 40(10):1632–1649
Lüders C (2020) Nonlinear-elastic orthotropic material modeling of an epoxy-based polymer for predicting the material behavior of transversely loaded fiber-reinforced composites. J Compos Sci 4(2):46
Puck A (1967) Zur Beanspruchung und Verformung von GFK-Mehrschichtverbund-Bauelementen. Kunststoffe 12:965–973
Chemistry LE (2021) Moisture absorption in Durethan polyamide parts. 01 05 2005. [Online]. https://techcenter.lanxess.com/scp/americas/en/docguard/PIB_Durethan_Moisture_Absorption.pdf. Accessed 8 June 2021
Handwerker M, Wellnitz J, Marzbani H (2021) “Mikromechanische Betrachtung von additiv hergestellten endlosfaserverstärkten Thermoplasten [Micromechanical investigation of additively manufactured thermoplastics],” in 10. Landshuter Leichtbau-Colloquium (2021), Landshut, 2021
Acknowledgements
The authors would like to thank Prof. Dr. Jörg Bienert for his help with the vibration measurements and Simon Keim for his help with the X-Ray and SEM measurements. Michael Handwerker was supported in this research by a grant from Startupspider.
Funding
Open Access funding enabled and organized by Projekt DEAL.
Author information
Authors and Affiliations
Corresponding author
Ethics declarations
Conflict of interest
On behalf of all authors, the corresponding author states that there is no conflict of interest.
Additional information
Publisher's Note
Springer Nature remains neutral with regard to jurisdictional claims in published maps and institutional affiliations.
Rights and permissions
Open Access This article is licensed under a Creative Commons Attribution 4.0 International License, which permits use, sharing, adaptation, distribution and reproduction in any medium or format, as long as you give appropriate credit to the original author(s) and the source, provide a link to the Creative Commons licence, and indicate if changes were made. The images or other third party material in this article are included in the article's Creative Commons licence, unless indicated otherwise in a credit line to the material. If material is not included in the article's Creative Commons licence and your intended use is not permitted by statutory regulation or exceeds the permitted use, you will need to obtain permission directly from the copyright holder. To view a copy of this licence, visit http://creativecommons.org/licenses/by/4.0/.
About this article

Cite this article
Handwerker, M., Wellnitz, J., Marzbani, H. et al. Pressure and heat treatment of continuous fibre reinforced thermoplastics produced by fused filament fabrication. Prog Addit Manuf 8, 99–116 (2023). https://doi.org/10.1007/s40964-022-00315-5
Received:
Accepted:
Published:
Issue Date:
DOI: https://doi.org/10.1007/s40964-022-00315-5