
Abstract
3D sand printing provides a means to fabricate molds and cores without the need to fabricate patterns and core boxes. It is desirable to understand when to use this evolving advanced technology versus conventional pattern making. This analysis evaluates this question by examining the cost of molds and cores as a function of part design complexity quantified by a complexity factor. Two case studies are presented where the complexity of the castings is systematically varied by changing the geometry and number of cores. Tooling costs and fabrication costs are estimated for both 3D sand printing and conventional pattern making. The breakeven points are identified, and it is shown that 3D sand printing is cost-effective for castings with complexity factor values greater than that of the breakeven points. For low volume production of these castings, 3D sand printing is shown to be cost-effective for low quantities (<45 parts) of castings with lower complexity. However, it can also be very cost-effective for casting with higher complexity even at quantities of 1000 units. Since breakeven point is sensitive to the cost of 3D sand printing, lowering the materials and operations costs can significantly improve the cost-effectiveness of 3D sand printing for varied production volume and part design complexity.
Introduction
Due to the recent advancements in additive manufacturing (AM), foundries can now choose to produce molds and cores using either conventional pattern making or using 3D sand printing technology. But there is a lack of understanding about the cost benefits of 3D sand printing when compared to traditional processes to fabricate molds and cores. Decision makers in foundries do not have discrete criteria to evaluate the economic feasibility of using this technique to produce molds and cores.1 The motivation of this paper is to develop a part complexity-based cost metric to analyze decisions for economically viable implementation of 3D sand printing. Although there have been major advancements in metal processing technologies, sand casting still remains one of the oldest and most widely used processes.2 A study showed that over 70 % of all metal castings are produced via sand casting and it is a vital manufacturing process used in oil and gas, aerospace and automotive industries.3 Sand casting is used to make relatively larger parts in which molten metal is poured into a mold cavity made of sand. Sand casting is the most economical method to produce metal parts of nearly any alloy.3 – 5 Tooling for the sand casting process typically involves the fabrication of patterns to make the molds and the fabrication of core boxes in order to make cores. 3D sand printing is the direct fabrication of molds and cores through additive manufacturing of sand.
Background
Integral aspects of every sand casting process involve tooling associated with mold making. This includes the fabrication of patterns used to make the molds, and the fabrication of core boxes to make cores. Some of the major limitations in mold making using traditional techniques (e.g., machining) include constraints such as limitations on minimum wall thickness, elimination of sharp corners, and undercuts resulting in higher draft angle leading to increased fabrication costs. This is further amplified in the case of tooling for parts with higher design complexity. For example, expensive core and/or set of cores are required for parts with complex internal geometry such as an engine block.6 In some cases, part design modification is required (e.g., higher draft angle) to facilitate pattern removal prior to pour during sand casting. Often, this leads to nonfunctional part design modification (often adding weight to the casting) and/or additional processing steps after casting.7
Additive Manufacturing: 3D Sand Printing
Additive manufacturing (AM) in the form of 3D sand printing is complimentary to the traditional approach of mold making in sand casting. 3D sand printers can directly print a sand mold from computer-aided design (CAD) models of desired part design in a matter of a few hours without the need for patterns or core boxes. Currently, 3D sand printing is accomplished using a specific category of additive manufacturing called binder-jetting.8 As shown in Figure 1, in binder-jetting a binding agent is selectively deposited (based on CAD model) on a spread layer of powder.9 For the purposes of mold and core making, foundry-grade resins such as furan can be used as the binding agent.10 The process is repeated until the mold is completely produced. It should be noted that post-processing steps associated with binder-jetting for metal or ceramics such as curing of binders, sintering and infiltration are not required for 3D sand printing of molds. In the case of 3D sand printing, unbound sand (i.e., gates, sprues, runners and risers) is removed using vacuum and are recycled for subsequent production cycles.

Schematic of binder-jetting.
3D sand printing provides unique advantages in mold making such as significantly reduced lead time and flexibility without the need for tooling which is dependent on part designs. For instance, depending on the size of mold and cores required for a single part design (limited by available print volume), multiple molds and cores can be fabricated at the same time. For example, Voxeljet® and ExOne® offer commercial 3D sand printing systems with print volume up to 4 m × 2 m × 1 m with layer thickness in the range of 280–500 microns.9 , 11 – 13
Another unique advantage of this approach is the geometric freedom offered by AM that can be leveraged to produce metal casting of highly complex geometry which are otherwise not feasible or unaffordable using traditional approach as shown in Figure 2.6 Sand printing has also been shown to enable cellular lattice castings14 and topologically optimized cast structures.15 In addition, other design and manufacturing benefits include16:

Relationship between production cost and part complexity.6
-
Consolidation of cores resulting in reduced labor costs, reduced stacking tolerances and improved dimensional control. An example of a complex core is shown in Figure 3.
Figure 3 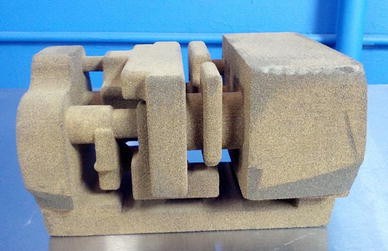
A 3D sand printed core for train air brake casting.
-
Placement of critical surfaces in the drag to reduce inclusions and air bubbles (incorporation of downstream processing characteristics)
-
Incorporation of risers at critical locations without the need to eliminate undercuts
-
Simplification of vent fabrication (i.e., elimination of vent incorporation into hard tooling)
-
Enhancement of mold design through novel nonhorizontal parting lines to allow for un-bonded sand removal

Tooling and Fabrication Cost
The sequential processing steps of conventional sand casting are outlined in Figure 4, and it should be noted that downstream operation after fabrication of core box is independent of traditional and 3D sand printing. The primary scope of this study is associated with decision making in the tooling of molds and cores and the fabrication of core boxes prior to pouring of molten metal as shown in Figure 4.

Process map of conventional sand casting.17
It is assumed that part design complexity will have minimal or no influence on the cost per casting in postfabrication operations including pour, shakeout and secondary operations such as heat treatment, machining and inspections. However, it should be noted that consolidation of number of required cores (through 3D sand printing) could substantially eliminate or mitigate flash that would generate additional finishing or inspection.
Among several cost factors in sand casting, two major cost components are the tooling and fabrication costs which involve a variety of operations to produce the mold and cores and subsequently fabrication of cores and inspection.18 , 19 The unit cost of a core box depends on the number of cores, cavity geometry/size, mold and core sizes and production volume for that specific part design (i.e., number of castings per design). In the case of traditional mold making, there are additional operations involved with multiple cores including the assembly of the cores, bonding of cores and inspection.
Several studies have identified the relationship between complex part designs which require multiple cores and its impact on tooling cost in traditional approaches to fabricate core box. In conventional manufacturing of sand molds, the production cost is directly influenced by part complexity because of the need for multiple operations, special tools, skillful labors, significant tool wear and lower productivity.7 , 20 , 21 Another analysis showed it was evident that machining of tooling was relatively higher for complex part designs with similar geometric volume.21
Components of tooling costs shown in Figure 5 include two main components: pattern and core boxes.22 It was identified that tooling cost is influenced by pattern material, part size, desired accuracy and part complexity.22 Hence, it can be concluded that tooling cost for complex part geometry with larger part size and greater accuracy will be significantly higher than traditional manufacturing of tooling (for similar mold-core material).

Components of tooling cost.
It was also observed that tooling cost in foundries and pattern shops is usually amortized over the number of castings produced and hence is a critical factor that increases unit cost during low production volume.20 It is important to note that tooling cost is a fixed initial cost in traditional mold making and this negatively impacts the number of part designs that can be produced economically. This is especially true for low quantity production that would occur during product development. The motivation of this study is to develop a model based on part design complexity, production volume and tooling-fabrication costs of core boxes. The developed model will be applied to evaluate the economic feasibility of traditional sand casting methods and 3D sand printing for varied combination of part designs and production volume. This would provide decision makers in foundries quantitative criteria to evaluate economic feasibility to pursue capital investment in 3D printers and related resources including training and redesigning core boxes.
Methodology
The methodology employed in this study involves: (1) creation of CAD models for each casting design for evaluation, (2) quantification of part design complexity in cast parts using a criterion adopted from a prior study,21 (3) estimation of fabrication costs associated with conventionally produced molds and cores and 3D sand printing for varied production volume, (4) analysis of fabrication costs as a function of part complexity factor values, (5) estimation of breakeven costs between traditional and 3D sand printing to determine levels of part complexity where 3D sand printing is more cost-effective, and (6) examination of the effects of changing the costs of 3D sand printing.
The Complexity Factor
The criterion for measuring part design complexity used in this study is adopted from a prior study focused on quantification of part complexity of cast parts for traditional processes.21 Key geometric attributes that can be determined from the CAD model of the desired part associated using this complexity model are presented in Table 1. The tooling cost is influenced by tool design and tool complexity which is dictated by the part design complexity. For example, the mold for a complex part design such as a train air brake may require multiple cores. Alternatively, a simpler casting might be a solid uniform cross-sectioned part without the need for a single core. Designers and tool makers observed that the tooling cost depends on the number of cores, volume and surface area of part, core volume, draw depth (i.e., the depth of tooling) and variation in section thickness.21
The ratios have a value between 0 and 1; higher values indicate a greater contribution to complexity:21
-
Part volume ratio \( (C_{\text{PR}} ) \):
$$ C_{\text{PR}} = 1 - \frac{{V_{\text{P}} }}{{V_{\text{b}} }} $$(1) -
Area ratio \( (C_{\text{AR}} ) \):
$$ C_{\text{AR}} = 1 - \frac{{A_{\text{S}} }}{{A_{\text{P}} }} $$(2)where \( A_{\text{S}} = (4\pi )^{{\frac{1}{3}}} (3V_{\text{P}} )^{{\frac{2}{3}}} ; \)
-
Number of cores \( (C_{\text{NC}} ) \):
$$ C_{\text{NC}} = 1 - \frac{1}{{\sqrt {1 + N_{\text{C}} } }} $$(3) -
Cores volume ratio \( (C_{\text{CR}} ) \):
$$ C_{\text{CR}} = 1 - \frac{{\sum V_{{{\text{C}}_{i} }} }}{{V_{\text{b}} }} $$(4) -
Thickness ratio \( (C_{\text{TR}} ) \):
$$ C_{\text{TR}} = 1 - \frac{{T_{\hbox{min} } }}{{T_{ \hbox{max} } }} $$(5) -
Depth ratio (CDR):
$$ C_{\text{DR}} = 1 - \frac{{0.5 \left( {\hbox{min} \left( {L,W,H} \right)} \right)}}{{D_{\text{d}} }} $$(6)
Equations 1–6 are quantitative measures of part complexity of cast parts using geometry-driven criteria based on number of cores, part volume ratio, core volume ratio, area ratio, thickness ratio and depth ratio. In,21 regression analysis was used for 40 industrial parts of varying complexity to determine coefficients of part complexity shown in Eqn. 7.
This relationship will be used as a measure of part design complexity for the castings analyzed in our case studies.
Cost Estimation
For a given part design, estimation of mold making for both pattern making and 3D sand printing is conducted. As noted in “Additive Manufacturing: 3D Sand Printing” section, this study did not include costs associated with downstream operations such as melting, pouring, cooling, solidification, heat treatment and inspection based on the assumption that they are similar between sand printing and conventional pattern making.
For conventional pattern making, tooling costs were generated using an Internet-based cost generator.18 The bounding box of the part, the number of cores and the number of part features are required to generate the tooling costs. Fabrication costs of molds and cores were estimated by industry quotation method based on the size of the casting, number of cores and other factors. Generally, mold costs are estimated by the following relationship:
where C M is the cost of mold making, V b is the bounding box of the part, V m is additional sand required around the part for the mold and C pm is the volumetric cost of mold making including labor, energy, depreciation and overhead.
The cost of 3D sand printing is based on bounding box volume of the mold and bounding box volume of cores as shown in the following equation:
where C SP is the cost of 3D sand printing, V b is the bounding box of the part, V m is additional sand required around the part for the mold, V b,c is the bounding box of the cores (which can be nested during printing) and C bj is the volumetric cost of the binder-jetting sand printing process including consumables (sand, resin, cleaner and catalyst), labor, energy, depreciation and overhead. Volumetric cost for 3D sand printing is less than $0.20 per in3, and as such $0.17 per in3 is a reasonable estimate.
Results and Analysis
The impact of part design complexity, increasing the number of cores and complexity of core geometries are analyzed with respect to production cost of mold making using traditional and 3D sand printing.
Case Study #1: Train Air Brake
The part geometries in these case studies are derivative designs of actual castings. Each case study starts with a solid casting, and cores are sequentially added until all the desired cores are included. This methodology maintains the constant bounding box while gradually increasing the part complexity with growing number of cores.
The first case study involves the train air brake casting shown in Figure 6. Using conventional processes, design and assembly of eight cores are required, and models of those cores are shown in Figure 7. The casting was designed in SolidWorks® as shown in Figure 8. Beginning with a solid part (1.0) as shown in Figure 8, cores were added sequentially until the final number of cores (eight) was reached. The corresponding design attributes described in complexity factor Eqns. 1 through 7 were obtained using CAD models in SolidWorks®. The geometric data and corresponding complexity factor are shown in Table 2.

Views of the casting (transparent) and cores (gray).

Conventional pattern making requires eight cores for the train air brake.16

Side view of each casting evaluated for Case Study #1 where cores are added sequentially to systematically increase complexity.
In conventional pattern making, there is a tooling cost associated with fabrication of patterns and the core box needed for each core. The relationship between tooling costs per set of mold and corresponding complexity factor is shown in Figure 9. It should be noted that 3D sand printing tooling costs are not presented since there are no tooling costs associated with 3D sand printing (i.e., a tooling-less process).

Tooling costs (i.e., patterns and core boxes) as a function of complexity for Case Study #1.
Figure 10 shows the relationship between fabrication costs for both conventional pattern making and 3D sand printing at different levels of complexity for Case Study #1. For conventional pattern making production costs, the fabrication cost proportionally increases with increasing complexity: As cores are added, the cost in labor to assemble cores, cost of materials (i.e., sand, glue) and scrap costs all increase.

Fabrication costs for Case Study #1 for 3D sand printing costs and conventional pattern making.
It was observed that lower levels of complexity lead to higher fabrication cost in 3D sand printing than conventional mold manufacturing approach. Figure 10 shows that cost of molds is constant after the second core is added since 3D sand printing cost depends on printed bounding box of cores and is constant for subsequent addition of cores. In the case of, part design with complexity greater than ~56, the fabrication cost of 3D sand printing is lower than conventional pattern making. 3D sand printing provides a unique advantage here by consolidating cores into single core. This results in lower labor and scrap costs with higher numbers of cores which is a benefit of this approach.
Figure 11 incorporates both tooling and fabrication costs as a function of part design complexity. For conventional manufacturing, cost curves for quantities of 30, 100 and 1000 was included to show that the costs of patterns and core boxes were amortized across the production volume. For production volume below 30 castings, 3D sand printing is more affordable than conventional pattern making even in the case of no cores. In other words, the breakeven point is the lowest level of complexity for this family of castings at this quantity. However, for quantities greater than 30 castings, it depends on the level of part design complexity. As quantity increases, the breakeven point shifts to increasing levels of complexity. For production quantities of 1000 castings, the tooling cost per mold/set is so low that fabrication costs significantly dominate and cost/complexity behavior is almost identical to the fabrication costs shown in Figure 10.

The total costs (tooling + fabrication) for Case Study #1 where conventional pattern making costs are shown for quantities of 30, 100 and 1000 units.
Case Study #2: Turbocharger
Similar approach of Case Study#1 was used in this case study involving a turbocharger shown in Figure 12a—final part and Figure 12b—cores (which would require three cores using conventional pattern making).

(a) Casting for Case Study #2 and (b) Core geometry.
Similar to Case Study #1, cores are sequentially added starting with a solid casting until the incorporation of all three cores. However, in the case of this part design as shown in Figure 13, the core geometries are different for each sub-case, wherein the first core is added in the shape of a cube and subsequently the cubic core is replaced by two cylindrical cores. Finally, the cylinders are replaced by the actual three cores. The geometric data and complexity factor for each sub-case study are shown in Table 3.

Sequentially increasing the number of cores starting with (a) no core, (b) one cubic core and (c) two cylindrical cores.
The relationship between tooling set and complexity factor is presented in Figure 14. Again, no tooling costs are shown for 3D sand printing because there are none.

Tooling costs as a function of complexity for Case Study #2.
Figure 15 presents the relationship between fabrication costs for both conventional pattern making and 3D sand printing at different levels of complexity for Case Study #2. As with the previous case study, the conventional pattern making production costs increases as a function of complexity; however, there is a drastic increase between one cube-shaped core and two cylindrical cores. For 3D sand printing, it was also observed that at lower levels of complexity the fabrication cost was higher than that of conventional manufacturing. Unlike the previous case study, the 3D sand printing cost does not “level out” because the volume of the cores is significantly increased due to the cylinders and the final core geometry.

Fabrication costs for Case Study #2 for 3D sand printing costs and conventional pattern making.
For complexity factor values greater than ~51, the fabrication cost of 3D sand printing is lower than conventional mold making. As the final three core geometry is approached, the 3D sand printed cores are consolidated into a single core providing a cost advantage versus conventional mold making.
Figure 16 presents the combined effects of tooling and fabrication costs and part design complexity factor. For production volume of less than 26 castings, 3D sand printing is more affordable than conventional pattern making even in the case of casting without any cores. However, for production volume greater than 26 castings, it depends on the level of part-core complexity. As seen in the previous case study, the breakeven point shifts to increasing levels of complexity as the quantity increases. In the case of 1000 castings, as observed in Case Study #1, the tooling cost per mold/set is significantly lower since fabrication costs is more significant and the scenario is very similar to Figure 15.

Total costs (tooling + fabrication) for Case Study #2 where conventional pattern making costs are shown for quantities of 26, 100 and 1000 units.
The Effect of 3D Sand Printing Cost
As shown in Figure 17, nearly a third of 3D sand printing costs include materials and consumables, and hence, cost of 3D sand printing is a critical variable which requires additional analysis. It was observed that two-thirds of the costs include labor, energy, depreciation and overhead.23 Research by the Metal Casting Center at University of Northern Iowa has demonstrated that the use of regional sands and alternative resins, catalysts and cleaners resulted in a nearly 90 % reduction in materials and consumable costs.23 Similar price reduction would lead to a nearly 30 % reduction in the overall cost of 3D sand printing. In this study, we examine both a 20 % reduction in overall cost and, conversely, a 20 % increase in overall cost.

Printing materials, consumables and other costs in 3D sand printing.23
Figure 18 shows the impact of reducing 3D sand printing cost by 20 % on Case Study #1. The costs of sets of molds and cores made using conventional manufacturing remain unchanged. For all production quantities, the breakeven point shifts to a lower level of complexity factor. For the lowest level of design complexity involving no cores, 3D sand printing is affordable up to fabrication of 45 units when compared to 30 units as shown in Figure 11 with the baseline cost of 3D sand printing. Hence, a reduction in 3D sand printing cost has a significant effect in allowing 3D sand printing to be more cost competitive at lower levels of complexity.

The total costs (tooling + fabrication) for Case Study #1 where the costs of 3D sand printing have been reduced by 20 %. Pattern making costs are shown for quantities of 45, 100 and 1000 units.
In contrast, a 20 % increase in 3D sand printing cost as shown in Figure 19 results in the shifting of the breakeven point to a higher level of complexity. As a result, only up to 20 parts are affordable using 3D sand printing at the lowest level of complexity involving no cores. An increase in the cost of 3D sand printing indicates that the casting must possess substantial higher design complexity in order for 3D sand printing to be cost-effective.

The total costs (tooling + fabrication) for Case Study #1 where the costs of 3D sand printing have been increased by 20 %. Pattern making costs are shown for quantities of 20, 100 and 1000 units.
Similar trends were observed in Case Study #2 as shown in Figure 20 where the total costs of the sets of molds and cores for the scenario of 3D sand printing cost reduced by 20 %. It is more affordable to produce up to 40 units using 3D sand printing than conventional pattern making when compared to 26 units for the baseline cost as shown in Figure 15. At production volume of 1000 units, the breakeven criteria shift from a complexity factor of approximately 51–45.

The total costs (tooling + fabrication) for Case Study #2 where the costs of 3D sand printing have been decreased by 20 %. Pattern making costs are shown for quantities of 40, 100 and 1000 units.
Figure 21 shows the costs of sets of molds and cores for Case Study #2 where the costs of 3D sand printing have been increased by 20 %. The most striking aspect is that at production volume of 1000 units, conventional pattern making is most cost-effective irrespective of complexity factor.

The total costs (tooling + fabrication) for Case Study #2 where the costs of 3D sand printing have been increased by 20 %. Pattern making costs are shown for quantities of 20, 100 and 1000 units.
Fabrication Time
“The Effect of 3D Sand Printing Cost” section focused solely on fabrication cost. However, in some situations where repaid response is critical, fabrication time is also important. For the casting examined in Case Study #1, using conventional pattern making in the condition involving 8 cores would take an average of 11 weeks to design and manufacture tooling and fabricate molds and cores for a single part. With 3D sand printing, this could be reduced to 4 weeks. These time estimates start with the receipt of customer purchase order and extends to delivery of molds and cores to customer. In the case of the casting design for Case Study #2 involving three cores, it would take 8 weeks using conventional pattern making and 3 weeks using 3D sand printing.
In the case of conventional pattern making, about 60 % of the production time was expended on tooling which included procuring tooling material, tooling design, tooling, customer approvals and the likes. However, the fabrication of patterns and cores and related processes such as sand preparation and design of gating systems account for 35 % of the production time. On the other hand, when 3D sand printing was used, the majority of the production time is associated only with mold and core design, and design of gating system using customer’s 3D model.
Conclusion
The primary scope of this study was associated with decision making in tooling of cores and fabrication of core boxes prior to pouring of molten metal. This study developed decision criteria for economic feasibility of 3D sand printing based on part design complexity and its relationship for various production volume and was demonstrated using case studies. Part design complexity was varied by changing the number of geometries of cores while maintaining constant exterior geometry of the part. The costs of conventional pattern making and 3D sand printing were estimated and compared.
The part design complexity of casting has quantitatively evaluated using the method found in Ref. 21. This complexity criteria used six geometric attributes (part volume ratio, area ratio, core volume ratio, number of cores ratio, thickness ratio and depth ratio) in order to measure the complexity factor.
The following conclusions are derived:
-
The economic opportunity for 3D sand printing exists for castings with a higher part design complexity factor value than the point at which the cost of 3D sand printing and conventional pattern making is equal. This point is called the breakeven point, and it is a function of production volume (castings),
-
At lower production volume, 3D sand printing is advantageous irrespective of complexity factor. This can be attributed to signification tooling costs in conventional pattern making. Hence, 3D sand printing offers a unique economic advantage where increase in part design complexity has little or no impact on fabrication cost of molds and cores.
-
In the case of higher production volume (e.g., 1000 castings), as illustrated through case studies, tooling costs in conventional pattern making become negligible. In such scenarios, 3D sand printing could only be advantageous for extremely high levels of part design complexity.
-
The breakeven point varies significantly as a function of 3D sand printing costs. When the costs of 3D sand printing were decreased by 20 %, the breakeven point shifted to lower levels of part complexity indicating that 3D sand printing becomes more affordable to produce molds and cores for less complex part designs. Alternatively, 3D sand printing can only be cost-effective for exceptionally high levels of complexity when the costs are increased by 20 %. In the case of 3D sand printing by binder-jetting, a 20 % decrease or increase in total cost could be a function of changing the costs of materials and consumables, cost of operation, and/or reducing the cost of the equipment.
-
In the case of part geometries in this study (i.e., 8 cores for Case Study #1 and 3 cores for Case Study #2), there was a 62 % reduction in fabrication time by 3D sand printing to produce sand molds and cores.
Future Work
In order to accelerate the adoption of emerging technology such as 3D sand printing in the foundry industry, this study recommends that future work would examine the combinations of conventional pattern making and 3D sand printing for a single casting. For example, the economics of using conventional patterns for molds and 3D sand printing for complex cores could be explored. Further, economics and fabrication time associated with using alternative AM technologies for pattern making such as material extrusion (also known as Fused Deposition Modeling) could be explored.
In addition, the nonrecurring costs of mold-core design process should also be explored. One could hypothesize that as the complexity increases, the nonrecurring design costs would also increase. Thus, the increased complexity offered by 3D sand printing molds and cores is not necessarily “free.” However, actual design costs could be more complicated. For example, when 3D sand printing permits consolidation of multiple cores (as in conventional pattern making) into a single core, design time and costs would be reduced because there is no longer a need to design multiple core boxes.
There should also be an examination of alternative methods to assess part design complexity that is more tailored for 3D sand printing and not based only on the number of cores (e.g., conventional pattern making). This would accelerate evaluation of economic feasibility based on complexity and cost estimation for direct part production including other types of additive manufacturing such as laser powder bed fusion.
This study assumed that the 3D sand molds and cores printing provided an equivalent surface finish and sand performance with traditional pattern making for molds and cores manufacturing. However, an extension to this study would focus on incorporating additional factors to incorporate such attributes. Thus, evaluation of such factors can be achieved by measuring surface finish and testing of physical and mechanical properties (e.g., density, porosity, microstructure, hardness, compressive strength and the likes). This work will give additional evaluation criteria for both approaches along with estimated cost.
Finally, incorporation of these results into a CAD–CAM software system would be immediately beneficial to foundries. The end user should be able to plug in the geometric attributes of the castings as shown in Table 1. A means should be available to input cost parameters such as materials, consumables, labor, depreciation and other costs for both pattern making and 3D sand printing.
References
D.L. Bourell, M.C. Leu, D.W. Rosen, (eds.), Roadmap for Additive Manufacturing Identifying the Future of Freeform Processing, (Laboratory for Freeform Fabrication, Advanced Manufacturing Center, The University of Texas at Austin, 2009)
R. Banchhor, S. Ganguly, Optimization in green sand casting process for efficient, economical, and quality casting. Int. J. Adv. Eng. Technol. 25–29, 1–3 (2014)
United States. U.S. Environmental Protection Agency. Office of Enforcement and Compliance Assurance. Profile of the Metal Casting Industry. By The EPA’s Office of Compliance. Vol. EPA/310, (Washington, DC: U.S. Environmental Protection Agency, 1997). Print. 97-004
S. Kalpakjian, S. Schmid, Metal-casting processes and equipment; heat treatment, in Manufacturing Processes for Engineering Materials, 5th ed. (Pearson Education, 2008), p. 88
Step-by-Step Sand Casting Instructions. (Lost & Foundry, 2013), http://www.foundry101.com/new_page_7.htm. Accessed 5 Jan 2016
B.P. Conner, G.P. Manogharan, A.N. Martof, L.M. Rodomsky, C.M. Rodomsky, D.C. Jordan, J.W. Limperos, Making sense of 3-D printing: creating a map of additive manufacturing products and services. Addit. Manuf. 1–4, 64–76 (2014). doi:10.1016/j.addma.2014.08.005
“3D Printing as an Alternative to Patternmaking.” MoldMaking Technology. N.p., 20 Jan. 2014. Web. 28 Mar. 2015. http://www.moldmakingtechnology.com/articles/3d-printing-as-an-alternative-to-patternmaking
ISO/ASTM 52900:2015(en), “Additive manufacturing—General principles—Terminology.”, http://www.iso.org
D. Snelling, H. Blount, C. Forma, K. Ramsburg, A. Wentze, The effects of 3D printed molds on metal casting, in Proceedings of the Solid Freeform Fabrication Symposium (2013), pp. 827–845
“Patternmaker Sees Future in 3-D” Modern Casting, 103(11), 24–25 (2013)
Exerial™ Industrial Production 3D Printer (The ExOne Corporation, 2015) http://www.exone.com/Systems/Production-Printers/Exerial. Accessed 4 Jan 2016
S-Max™ Industrial Production 3D Printer (The ExOne Corporation, 2015) http://www.exone.com/Systems/Production-Printers/S-Max. Accessed 5 Jan 2016
VX4000 The large-format 3D printing system (Voxeljet AG, 2015), http://www.voxeljet.de/fileadmin/Voxeljet/Systems/VX_4000/voxeljet_3d-printer_VX4000_2015.pdf. Accessed 5 Jan 2016
D. Snelling, Q. Li, N. Meisel, C.B. Williams, R.C. Batra, A.P. Druschitz, Lightweight metal cellular structures fabricated via 3D printing of sand cast molds. Adv. Eng. Mater. 17(7), p923–p932 (2015)
S.J.Grunewald, A 3D Printed Algorithmic Mold was Used to Cast this Solid Aluminum Stool (3D Print.com, 2015). http://3dprint.com/107050/algorithmic-aluminum-stool/. Accessed 5 Jan 2016
K. Woods, S. Ravi, Design considerations for 3-D printed cores and molds. Mod. Cast. 105(5), 24–29 (2015)
S. Dalquist, Life cycle analysis of conventional manufacturing techniques: sand casting. 1–13 (2015)
Sand Casting. Custompart.Net (CustomPartNet, 2009). http://www.custompartnet.com/wu/SandCasting. Accessed 5 Jan 2016
M. Al-Tahat, A. Al-Refaie, Activity-based cost estimation model for foundry systems producing steel castings. Jordan J. Mech. Ind. Eng. 6(1), 75–86 (2012)
R. Chougule, B. Ravi, Casting cost estimation in an integrated product and process design environment. (Mechanical Engineering Department, Indian Institute of Technology, 2005), pp. 1–19
D. Joshi, B. Ravi, Quantifying the shape complexity of cast parts. Comput. Aided Des. Appl. 7(5), 685–700 (2010)
A. Fagade, D. Kapoor, D. Kazmer, A discussion of design and manufacturing complexity, 1–24 (2015)
J. Thiel, Metal Casting Center Update. UNI Workshop. (University of Northern Iowa, Iowa, 2015)
Acknowledgments
This study was supported by America Makes, the National Additive Manufacturing Innovation Institute through a Youngstown Business Incubator led project: “Accelerated Adoption of Additive Manufacturing in the American Foundry Industry.”
Author information
Authors and Affiliations
Corresponding author
Rights and permissions
Open Access This article is distributed under the terms of the Creative Commons Attribution 4.0 International License (http://creativecommons.org/licenses/by/4.0/), which permits unrestricted use, distribution, and reproduction in any medium, provided you give appropriate credit to the original author(s) and the source, provide a link to the Creative Commons license, and indicate if changes were made.
About this article

Cite this article
Almaghariz, E.S., Conner, B.P., Lenner, L. et al. Quantifying the Role of Part Design Complexity in Using 3D Sand Printing for Molds and Cores. Inter Metalcast 10, 240–252 (2016). https://doi.org/10.1007/s40962-016-0027-5
Published:
Issue Date:
DOI: https://doi.org/10.1007/s40962-016-0027-5