
Abstract
Interface shear behavior between geosynthetics and clayey soil was investigated by large scale direct shear tests. The interfaces investigated are geomembrane (GM) and clayey soil; GM and geotextile (GT); and GT encased geosynthetics clay liner (GCL) and clayey soil. For GM/clayey soil interfaces, a softer GM resulted in a higher apparent adhesion, and higher water content of the soil yielded lower interface strength. A GM/bentonite interface had a small friction angle of 3 –4° only. For all cases tested, the interface shear strength (τ f) was lower than the shear strength of the corresponding soil (τ fs), and the lowest τ f /τ fs ratio was about 0.55. For GM/GT interfaces, the stiffer a GM, the lower the interface shear strength. Also a GT with a woven slit film layer, which is smoother than a randomly aligned nonwoven fiber surface, had a lower interface shear strength. The moisture content of a cover silty soil layer also had a considerable effect on the interface shear strength. Higher water content of the cover soil promoted soil particles entering the openings of the GT and increased the strength. For GCL/clayey soil interfaces, increase the water content of the bentonite in the GCL, reduced the interface friction angle, but increased apparent adhesion. The ratios of τ f /τ fs was about 0.8–1.0, and it reduced with the increase of the water content of the bentonite and overburden pressure possibly due to migration of water from the GCL to the interface.
Introduction
Liner system is an important component of modern landfill, and using engineered liner system was started in 1970s. The liner was developed from compacted clay liner to composite liner systems, i.e. combination of geomembrane (GM), geosynthetic clay liners (GCL) and compacted clay layer [1–4]. For the composite liner systems, some of the interface shear strengths between the components may be weaker than that of the subsoil. To design a composite liner system for a slope or an inclined base condition, sliding failure of the system needs to be checked [5–7]. There are landfill failure cases intrigued by sliding failure between GMs and clay layers, such as the hazardous waste landfill at Kettleman City, California, USA [8] and a landfill failure in China [9]. There are three critical geosynthetics and clayey soil interfaces among components of composite linear systems, i.e. GM/clayey soil; GM/GT (GT means geotextile), and GCL/clayey soil [10].
There are a number of publications about the shear strength at GM/soil interfaces [11–14]. Fleming et al. [13] proposed two mechanisms for the interface shear resistance. One is sliding shear and other is “plowing” shear. For the latter case, some soil particles partially embedded into the surface of a GM and making plowing tracks on the surface of the GM during the shearing process. However, the development of the “plowing” mechanism depends on the confining pressure and the stiffness of the GM. The softer the GM and the higher the confining pressure, the easier for the “plowing” mechanism to be developed.
There are two scenarios of a GM/GT interface. One is a GT layer above a GM layer serving as a protection layer, and the other is a GM layer above a GT encased GCL in a liner system. For the former case, not only the properties of the GT and GM considered, but also the properties of the cover soil above the GT layer will influence the interface shear strength [15]. In case of a GM/GCL interface, there are reported laboratory test results that hydrated bentonite in the GCL was partially extruded out of the GT and formed GM/bentonite contacts [16, 17]. After hydration, bentonite can become very soft, and the GM/bentonite interface may be very weak.
For an interface between a GT encased GCL and a clayey soil, if there is no bentonite extrusion occurring, it is a GT/clayey soil interface. The interface shear strength is influenced by the moisture content of the clayey soil and the texture of the GT [18–20]. The mostly published results are related to GT reinforced earth structures, and the shear behavior of a GCL/clayey soil interface, which often occurring in a composite liner system, has not been investigated comprehensively.
The interface shear behavior between geosynthetics and clayey soils is influenced by both the properties of geosynthetics and soils involved, and there are many geosynthetics products in the market. Because of this kind of nature, [15] suggested that site specific testing should be carried out for detailed design purposes. In this study, interface shear strengths of GMs and clayey soils (including a bentonite); GMs and GTs, and a GCL and clayey soils were tested by a large scale direct shear device using geosynthetics in Japanese market. The effects of initial water content of the clayey soils, initial water content of the bentonite in the GCL samples, stiffness of GMs and texture of GTs, and overburden pressure on interface shear strengths were investigated. The material used and test method are presented first. Then test results are discussed in terms of interface friction angle (δ), adhesion (c a), and the ratio of interface shear strength to the shear strength of the soil in case clayey soils were involved.
Large Scale Interface Shear Tests
Device and Test Procedure
Sketch and photo of a direct shear device are shown in Figs. 1 and 2 respectively. In principle, the test method is the same as ASTM D5321/D5321M-14 [21]. The device and the test procedure are briefly explained here. The upper shear box has a cross-sectional area of 200 mm by 200 mm and thickness of 70 mm. The lower box has an area of 220 mm by 450 mm, and depth of 100 mm. Both the boxes were made by stainless steel. The larger area of the lower box ensures no shear area reduction during a test. To test shear strengths of geosynthetics and clayey soil interface, the soil was put into the upper box, and the lower box was covered by a stainless steel plate with a thickness of 10 mm, and then a geosynthetics sheet was installed on the top of the plate. The test procedure is as follows.

Sketch of the direct shear device

Photo of the direct shear device
-
1.
Cut a geosynthetics sample (GM or GT or GCL) with a size of 240 mm by 450 mm, and set it on the top of the lower box and fix it at right side edge (Fig. 1). During a test, the lower box will move toward right side.
-
2.
Set up the upper box and fill with testing soil in 3 layers, and each layer was compressed under 50 kPa static pressure before adding a new soil layer. In case of a GM/GT interface, set a GM sheet at the lower box, and set a GT sample of 200 mm wide and 240 mm long at the bottom of the upper box first. In the shear direction, the GT sample was wrapped up about 20 mm inside the box at each side. Then put the soil into the upper box above the GT sample. The top surface of the soil in the upper box is in a fully drainage condition.
-
3.
Apply pre-determined overburden pressure (25–100 kPa) to compress (for unsaturated case) or consolidate (for saturated) soil sample. And monitor vertical displacement (d v) of the sample. The maximum normal pressure of 100 kPa equivalents to the pressure of 5–7 m thick of waste material in a landfill.
-
4.
When d v almost no changes within 2 h., start shear test with a shear displacement rate of 2 mm/min. When shear resistance reaches a residual value (or shear displacement reached 33 mm), terminate the test. During a shear test, vertical displacement and shear resistance were recorded by a computer through a data logger.
-
5.
After the shear test, measure the water content of the soil in case a soil is involved.
Materials
-
1.
GMs and GTs Three types of GM (GM-1, -2 and -3) and two types of GT (GT-1 and -2) were tested as listed in Table 1. GM-1 and -3 are stiffer than GM-2.
Table 1 Geosynthetics tested -
2.
GCL A GT encased GCL tested consists of granular bentonite powders encased by geotextiles (a nonwoven geotextile as “cover” and a nonwoven geotextile with a slit film woven layer as “carrier”). The carrier is the same as GT-2. The “carrier” and “cover” geotextiles were connected by needle punched fibers with thermal treatment with pitches of 3 mm × 4.5 mm. The bentonites used were mined in Wyoming, USA and their dioctahedralsmectite contents were 85–91 % (provided by manufacturer). Using tap water, its liquid limit was w l = 537.0 % and plastic limit of w p = 45.8 %; and using 1 % NaCl solution, values of w l and w p were 235 and 46.3 % respectively [25].
-
3.
Soils Three types of soil were tested (Table 2). One was powders of decomposed granite (Masado in Japan) passing through 425 μm sieve, which was used as cover soil for testing GM/GT interfaces. The grain size distribution of the Masado is given in Fig. 3. Second one was a mixture (mixed soil) of Ariake clay and the Masado. The mixing ratio by dry weight was Ariake clay/Masado powders = 3 by 10. The Ariake clay used in the mixed soil had a compositions of 71 % of clay (>5 μm), 25 % of silt and 4 % of sand. Its liquid limit was 120.3 %, plastic limit of 56.8 % and specific gravity of 2.65. Another soil used was a bentonite mined in Japan, which is different from the bentonite in the GCL. Liquid limits (w L), plastic limits (w p) for clayey soils and the average diameter of the Masado particles are listed in Table 2. The mixed soil and the bentonite were used as clayey soils.
Table 2 Plastic and liquids limits of the soils Fig. 3 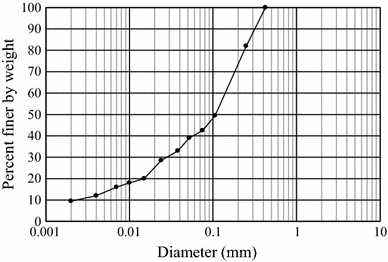
Grain size distribution of the Masado used

GM/Clayey Soil Interface Shear Strengths
Conditions Adopted
GM-1 and -2, the mixed soil and the bentonite were used in this series of tests. Considering seasonal variation of moisture content in the field, different initial water content of the soils were adopted for the tests. For the mixed soil, initial water content of 28 and 60 % were adopted. The former is almost the same as its value of w p, and the latter is higher than its value of w L. However, for the initial water content of 60 % cases, after consolidation and before the shear test, the water content of the soil was lower than the initial value. For the bentonite, adopted initial water contents were 90, 120 and 150 %. They are all much higher than its value of w p but lower than its value of w L. Therefore, the soil layer adopted in the tests was not compacted at its optimum water content. It may represent a natural clayey soil layer. In case of using the bentonite, only GM-1 was used in the tests.
Test Results
Shear Displacement—Shear Stress Relationships
Figure 4 shows three shear displacement (d x)—shear stress (τ) curves. The water content of the mixed soil was 28 %. In case of GM-1/mixed soil and GM-2/mixed soil interfaces, the peak shear stress (τ f) was mobilized at d x = 8–10 mm, and the residual resistance was reached at d x > 20 mm. While in case of GM-1/bentonite interface, the peak strength was mobilized at d x ≒ 1 mm, and the residual strength reached at d x ≒ 2 mm. The peak shear stresses were used to interpret the interface friction angle (δ) and the adhesion (c a).

Three GM/soil interface shear displacement—shear stress curves
Effect of GM Type
For GM-1/mixed soil and GM-2/mixed soil interfaces, the overburden pressure (σ n)—shear strength (τ f) relationship are compared in Fig. 5. The water content of the mixed soil was 28 %. There is a tendency that the case with GM-2 had a higher apparent adhesion (c a) than that of GM-1. [11] reported that softer GMs had higher GM/soil interface shear resistances than that of harder GMs. The reason considered is that soil particles can cause local uneven surface on a softer GM and result in an apparently higher value of c a. For the results in Fig. 5, the friction angles are about 17° to 26°, which are comparable with the data reported in the literature for GM and clayey soil interfaces [11, 12].

Comparison of GM/soil interface shear strength envelops
Effect of Water Content of Clayey Soil
To investigate the effect of water content of clayey soil, the initial water content of the mixed soil was increased from 28 to 60 % (higher than its w L). While after consolidated under 50–100 kPa, the final water content became about 36–39 % (about the same as w L), the higher the consolidation pressure, the lower the resulting water content. The shear test conducted was not under undrained condition, but with a relative high shear displacement rate (2 mm/min.), it was close to undrained condition. The results are shown in Fig. 5 also. It clearly shows that for GM-1/mixed soil interface, increase water content of the soil, both values of δ and c a were reduced.
Test results of GM-1/bentonite interface with different initial water content of the bentonite are compared in Fig. 6. It shows that GM-1/bentonite interface had a very small δ value of about 3°–4° and it was not influenced by the initial water contents investigated. It also shows that for the bentonite, increase the initial water content from 90 to 120 %, there was almost no effect on the interface shear strength. However, when the initial water content increased to 150 %, the value of c a was reduced to about half of that for initial water content of 90–120 %. The water contents investigated are much lower than the value of w L of the bentonite. While for initial water content of 150 % case, there was water squeezed out of the bentonite and appeared at the interface during the shear test. It is postulated that a water membrane was formed between GM-1 and the bentonite particles and reduced c a value.

Interface shear strength envelops of GM/bentonite interfaces
Shear Strength Ratio
For a saturated (or higher water content) clayey soil, the undrained shear strength reduces with water content. The interface shear strength (τ f) was compared with the shear strength of the soil (τ fs). The ratios of τ f/τ fs are plotted in Figs. 7 and 8 for the mixed soil and the bentonite respectively. For the mixed soil (Fig. 7), τ f/τ fs reduced with the increase of water content of the soil. However, the tendencies of variation of τ f/τ fs with σ n are different for different water content of the soil. When the water content was about the same as the plastic limit (w p), there is a slight increase of τ f/τ fs ratio with σ n, but when the water content was about the same as its liquid limit (w L), τ f/τ fs ratio reduced with σ n due to significant reduction of interface friction angle (δ) (Fig. 5). The lowest τ f/τ fs ratio was about 0.55, i.e. the interface shear strength is about half of the shear strength of the soil. In case of the bentonite, although the data are scattered, there is a slight increase tendency of τ f/τ fs with σ n. As for the effect of the water content on the value of τ f/τ fs, there is no clear trend, and the initial water content of 120 % case resulted in highest value of τ f /τ fs. As shown in Fig. 6, for the initial water content increased from 90 to 120 %, it not caused considerable change of the interface shear strength, but the shear strength of the bentonite was reduced considerably. As a result, the τ f/τ fs ratio was higher.

Ratios of GM/soil interface shear strength and the strength of soil

Ratios of GM/bentonite interface shear strength and the strength of bentonite
The strength of the soils were measured by a standard direct shear test device with a specimen size of 60 mm in diameter and 20 mm in height. It is understood that there is a scale effect on the measured shear strength parameters. For the soil tested, there was a reduction of strength after the peak value, but the reduction was small. Also Dadkhah et al. [22] reported that for clayey soils, a larger scale direct shear box resulted in a lower friction angle but a higher apparent cohesion. In relative lower normal stress range, the strength from the larger shear box is comparable with that from the small shear box. Therefore, it is considered that to compare the interface shear strength from the larger scale shear box with the shear strength of the soil from the small scale shear box still has a meaning.
GM/GT Interface Shear Strengths
Three GMs and two GTs listed in Table 1 were used in this series of tests. Cover soil used was Masado. The effects of moisture content of the cover soil, types of GM and GT on the interface shear strength were investigated. Figure 9 shows a typical shear displacement—shear stress curve of GM-1/GT-1 interface (solid line).

Typical interface shear displacement—shear stress curves (GM-1/GT-1 and GCL/Mixed soil)
Effect of Moisture Content of Cover Soil
For GM-1/GT-1 interface, three conditions were tested. One used air dried Masado (w = 5 %) as cover soil (Dry); one used wet Masado (w = 17 %) (Wet-1); and another used the wet Masado but a filter sheet was placed on the top of GT-1 to prevent soil particles entering into the openings of GT-1 (Wet-2). The strength envelopes are plotted in Fig. 10. The test Wet-1 resulted in highest and Wet-2 the lowest interface friction angles. When the Masado was wet, it promoted soil particles entering the openings of GT-1 and formed soil/GM contacts and increased the value of δ. Scanning electron microscope (SEM) pictures of GT-1 specimens after the interface shear tests are shown in Fig. 11. The soil particles entered into the openings of the GT-1 can be observed from the specimen of Wet-1 test. When the interface was wet but no soil particles entering the openings of GT-1, the friction angle was reduced due to lubrication effect of water. For all three cases, the value of c a was about the same. The effect of soil particle entering the openings of GT is a function of opening sizes of a GT, and particle sizes and distribution and moisture content of the cover soil. When using coarse cover soils (gravels), Jones and Dixon [15] found that the shape of the soil particles had an effect on GM/GT interface strengths also.

Comparison of interface shear strengths for three conditions of cover soil

SEM pictures of the GT-1 specimen after interface shear tests a Dry, b Wet-1
Effect of Texture of GT
The test results of GM-1/GT-1 and GM-1/GT-2 interfaces using the wet Masado as cover soil are depicted in Fig. 12. In case of GM-1/GT-2 interface, the slit film woven layer was contact with GM-1. GM-1/GT-1 interface had a higher value of δ. There are two reasons considered for this. One is the slit film woven layer in GT-2 had smaller opening sizes, and almost no soil particles entered the interface. And another one is that the surface of the woven slit film layer in GT-2 was smoother than the surface of GT-1.

Comparison of GM-1/GT-1 and GM-1/GT-2 interface shear strengths
Effect of Stiffness of GM
In term of stiffness, the order of GMs is GM-3 > GM-1 > GM-2. The test results of GT-2 with the three types of GMs are given in Fig. 13. The tests were conducted using the wet Masado as cover soil. It can be seen that softer GM-2/GT-2 interface resulted in highest values of δ and c a. It is considered that at the contact points of GT-2 fibers and the softer GM-2, localized uneven surfaces can be formed under a confining pressure, which increased apparent surface roughness and then the interface shear strength. The mechanism may be similar as the “plowing” shear proposed by [13] for a GM/soil interface.

Effect of stiffness of GM on interface shear strength
GCL/Clayey Soil Interface Shear Strengths
Soil used was the mixed soil in Table 2. The initial water content of the mixed soil was about 28 %. Both not hydrated and hydrated GCL samples were tested. GCL samples were submerged into tap water or 1 % NaCl solution for hydration. The variations of water content of the bentonite in the GCL with elapsed time (up to 9 days) are shown in Fig. 14. The water content increased rapidly in the first day and after that the increase rate was small. At a given elapsed time, the water content of using 1 % NaCl solution was lower. This is because higher concentration of Na+ in the 1 % NaCl solution reduced the thickness of diffusive double layer [23, 24] around the bentonite particles (liquid limit reduced from 537 % for the tap water to 235 % for 1 % NaCl solution [25]), and as a result reduced the value of water content.

Water content of bentonite versus submerging time
A typical interface shear displacement—shear stress curve is shown in Fig. 10 (dashed line). In this case the peak strength was mobilized with a relative larger shear displacement and after the peak, the strength kept almost a constant.
Using GCL samples of not hydrated (the bentonite water content 12 %) and hydrated by the tap water and 1 % NaCl solution to 100 % water content (with a submerging time of about 1 month for using 1 % NaCl solution) of the bentonite, the strength envelopes are shown in Fig. 15. It can be seen that hydration of the bentonite reduced the interface friction angle significantly, but the value of adhesion was increased. There was no obvious bentonite extrusion at the surface of the GCL as observed by naked eye, but there was more bentonite entered into the openings of the carrier geotextile of the hydrated GCL samples compared with the not hydrated GCL sample. The reduction of the friction angle can be attributed to (a) limited extrusion of bentonite to the interface and (b) moisture migration from the GCL to the mixed soil. The later reason can softening the mixed soil locally which promotes interlocking between the soil and the geotextile fibers and increases apparent interface adhesion. Another point is that under the same water content (~100 %), the case using 1 % NaCl solution resulted in a lower value of adhesion than that of using the tap water (Fig. 15). The reason considered is that under the same water content condition, higher salt (higher Na+) concentration case will have thinner diffusive double layer around the bentonite particles and then more freely moving water, which causes lower shear strength of the bentonite and the water is easier to be squeezed out of the GCL and entered into the GCL/mixed soil interface.

Effect of water content of bentonite on GCL/soil interface strength
The strength parameters of the mixed soil with a water content of 28 % determined by standard direct shear tests were: friction angle ϕ = 32.2° and cohesion c = 2.3 kPa. Using these values the ratios between the interface shear strength (τ f) and the shear strength of the soil (τ fs), τ f/τ fs, are calculated and plotted in Fig. 16. The ratios are about 0.8 to 1.0. There are tendencies of τ f/τ fs reducing with the increase of water content of the bentonite and overburden pressure. It is considered due to the migration of water from the GCL (bentonite) to the mixed soil at the interface, which influenced the interface shear strength.

Ratios of GCL/soil interface shear strength and the strength of soil
Conclusions
Interface shear behavior between geosynthetics and clayey soils was investigated by large scale direct shear tests using some geosynthetics in Japanese market. The main factors investigated were stiffness of GM and water content of soils involved. Based on the test results, following conclusions can be drawn.
-
(1)
GM and clayey soil interface. A softer GM (made by PVC) resulted in a higher apparent adhesion, and higher water content of soil yielded lower interface strength. A GM/bentonite interface had a small friction angle of 3°–4° only. For all cases tested, the interface shear strength (τ f) was lower than the shear strength of the corresponding soil (τ fs), and the lowest τ f /τ fs ratio was about 0.55.
-
(2)
GM and geotextile (GT) interface. The stiffness of GM and the texture of GT had influenced the interface shear strength. The stiffer a GM, the lower the interface shear strength. A GT with a woven slit film layer, which is smoother than a randomly aligned nonwoven fiber surface, had a lower interface shear strength. The moisture content of a cover soil above the GT also had a considerable effect on the interface shear strength. Higher water content of the cover soil promoted soil particles entering the openings of the GT and increased the strength.
-
(3)
GT encased geosynthetics clay liner (GCL) and clayey soil interface. Increase the water content of the bentonite in the GCL, reduced GCL/soil interface friction angle, but increased apparent adhesion. The ratios of τ f /τ fs was about 0.8–1.0, and it reduced with the increase of the water content of the bentonite in the GCL and overburden pressure possibly due to migration of water from the GCL to the interface.
References
Koerner RM (1990) Design with geosynthetics, 2nd edn. Prentice Hall, Englewood Cliffs
Daniel DE (ed) (1993) Geotechnical practice for waste disposal. Chapman & Hall, London
Manassero M (1997) Controlled landfill design. Environmental geotechnics. Report of the ISSMFE Technical Committee TC 5 on Environmental Geotechnics, Bochum, 77–112
Japanese Ministry of Health and Welfare (JMHW) (1998) Technical standard for landfill design of municipal solid waste and industrial waste. Order No. 2. (in Japanese)
Roche D (1996) Landfill failure survey: a technical note. Eng Geol Spec Publ Geol Soc Lond 11:379–380
Pitanga HN, Gourc J-P, Vilar OM (2009) Interface shear strength of geosynthetics: Evaluation and analysis of inclined plane tests. Geotext Geomembr 27(6):435–446
Eid HT (2011) Shear strength of geosynthetic composite systems for design of landfill liner and cover slopes. Geotext Geomembr 29(3):335–344
Mitchell JK (2009) Geotechnical surprises—or are they? 1: the 2004 H. Bolton seed lecture. J Geotechnical Geoenvrionmental Eng. ASCE 135(8):998–1021
Feng S-J, Chen Y-M, Gao G-Y (2007) Analysis on translational failure of landfill along underlying liner system. Chin J Geotechnical Eng 29(1):20–25
Bacas BM, Cañizal J, Konietzky H (2015) Frictional behaviour of three critical geosynthetic interfaces. Geosynth Int 22(5):355–365
Koerner RM, Martin JP, Koerner GR (1986) Shear strength parameters between geomembranes and cohesive soils. Geotext Geomembr 4(1):21–30
Fishman KL, Pal S (1994) Further study of geomembrane/cohesive soil interface shear behavior. Geotext Geomembr 13(9):571–590
Fleming IR, Sharma JS, Jogi MB (2006) Shear strength of geomembrane–soil interface under unsaturated conditions. Geotext Geomembr 24:274–284
Bergado DT, Ramana GV, Sia HI, Varun (2006) Evaluation of interface shear strength of composite liner system and stability analysis for a landfill lining system in Thailand. Geotext Geomembr 24(6):371–393
Jones DR, Dixon N (1998) Shear strength properties of geomembrane/geotextile interfaces. Geotext Geomembr 16:45–71
Vukelic A, Szavits-Nossan A, Kvasnicka P (2008) The influence of bentonite extrusion on shear strength of GCL/geomembrane interface. Geotext Geomembr 26:82–90
Chen Y-M, Lin W-A, Zhan TLT (2010) Investigation of mechanisms of bentonite extrusion from GCL and related effects on the shear strength of GCL/GM interfaces. Geotext Geomembr 28:63–71
Basudhar APK (2010) Modeling of soil–woven geotextile interface behavior from direct shear test results. Geotext Geomembr 28(4):403–408
Khoury CN, Miller GA, Hatami K (2011) Unsaturated soil–geotextile interface behavior. Geotext Geomembr 29(1):17–28
Choudhary AK and Krishna AM (2016) Experimental investigation of interface behaviour of different types of granular soil/geosynthetics. Int J Geosynth Ground Eng, 2(1): Article 4, 11 pages
ASTM Standard D5321/D5321M-14 (2014) Standard test method for determining the strength of soil-geosynthetic and geosynthetic-geosynthetic interfaces by direct shear. ASTM International, West Conshohocken
Dadkhah R, Ghafoori M, Ajalloeian R, Lashkaripour GR (2010) The effect of scale direct shear test on the strength parameters of clayey sand in Isfahan city, Iran. J Appl Sci 10:2027–2033
Gouy G (1910) Sur la constitution de la charge electrique a la surface d’un elextrolyte. Anniue Physique (Paris) 4(9):457–468 (in French)
Chapman DL (1913) A contribution to the theory of electrocapillary. Philos Mag 25(6):475–481
Chai J-C, Sari K, Shen S-L, Cai Y-Q (2016) Predicting self-healing ratio of GCL with a damage hole. Geotext Geomembr. doi:10.1016/j.geotexmem.2016.05.010
Acknowledgments
The geosynthetics clay liner samples were provided by Hojun Co., Ltd, Japan; geomembrane samples by C.I. Kasei Co., Ltd, Japan; and geotextile samples by Maeda-Kosen Co., Ltd, Japan.
Author information
Authors and Affiliations
Corresponding author
Rights and permissions
About this article

Cite this article
Chai, JC., Saito, A. Interface Shear Strengths Between Geosynthetics and Clayey Soils. Int. J. of Geosynth. and Ground Eng. 2, 19 (2016). https://doi.org/10.1007/s40891-016-0060-8
Received:
Accepted:
Published:
DOI: https://doi.org/10.1007/s40891-016-0060-8