
Abstract
Shock waves have been used to determine material properties under high shock stresses and very-high loading rates. The objectives of the present experiments were to obtain information on the mechanical response of aluminum at shock stresses approaching and in the solid–liquid mixed phase regions, which is not routinely available with other methods. The accurate determination of compressive strength under shock compression has proven to be difficult due to the need for accurate reshock experiments from the initial shock state, with the consequence that estimates of shear strength have been limited to relatively low stresses. In this investigation, we have significantly improved the shock/reloading technique to obtain high quality data on reloading from the shocked states for initial shock stresses up to about 80 GPa. This has allowed the first self-consistent determination of the shear strength and the initial shear stress state of aluminum in the shocked state in this stress region. In addition, unloading experiments have been extended to over 140 GPa to understand how the strength of the material behaves when shocked beyond the solid–liquid mixed phase boundary. The combined wave velocity and strength data provide estimates of the onset and completion of shock-induced melting.
Introduction
The term “material strength” has been describe in many different ways. The initial yield strength represents the uniaxial stress (obtained at low to moderate strain rates using a variety of techniques such as tensile loading and Hopkinson bar) to induce a change in mechanical response from elastic to plastic deformation. For a Von-Mises solid, the yield strength is equal to twice the shear strength (Y = 2τ c ) and represents the maximum shear stress that can be supported before plastic yielding. Many of the concepts developed at low shock stresses and rates have been applied to materials that undergo high strain-rate dynamic deformation, as in uniaxial strain shock experiments [1]. Assuming uniaxial strain loading, the shear stress of an elastic–plastic material produced just after elastic yielding (produced by shock compression) is assumed to be equal to the shear strength, τ c , represented by the point “1” in Fig. 1. It has been inferred however [2–5] that the shear stress state is usually not exactly equal to the critical shear strength and is therefore not on a yield surface as shown in Fig. 1, but at an intermediate state, illustrated as state 2 in Fig. 1 (referred to as shear stress, τ H ). This deviation from the elastic–plastic model has been hypothesized based on observed quasi-elastic (QE) recompression from the shock state [2, 6] which should be strictly plastic based on the elastic–plastic model. [2] A number of investigations conducted over the past three decades have indicated this assumption to be a realistic representation of dynamic material response. To analyze the response represented by state 2 in Fig. 1, it is necessary to make several assumptions (described in “Experimental Results” section).

Depicts assumption of upper and lower yield surfaces. Actual shear stress has been inferred to lie between yield surfaces
Based on the those assumptions, during unloading from state 2, the shear stress change before yielding at −τ c is referred to as QE since experiments show it is not strictly elastic as in the elastic–plastic model. The shear stress change from state 2 to plastic yielding at the −τ c yield surface is Δτ = τ c + τ H . Reloading from state 2, the shear stress change during this reloading from τ H to the upper yield surface at +τ c will be Δτ R = τ c − τ H . The objective of the present work is to determine both the critical shear strength, τ c and the shear stress state, τ H , by performing shock loading to state 2, followed by unloading or reloading.
This is an improvement over earlier studies where high-quality reloading experiments turned out to be very difficult so that often only unloading was used to estimate material strength (Y), which implicitly assumes that τ H = τ c . It should be noted that τ H can actually be zero, in which case the shocked state is purely hydrostatic so that the unloading and reloading response would be symmetric, and the assumption that the initial state is on the yield surface would lead to factor of two errors in estimating yield strength from unloading experiments alone. The combination of the two experiments also provides a viable technique to determine the dynamic hydrostat [4, 7, 8]. In the present study we have extended the shock/reshock techniques to shock stresses of around 80 GPa, which is attained at two-stage gun symmetric impact velocities of about 6.3 km/s.
The present research also provides the first combination of unloading and reloading wave profile data obtained in 6061-T6 aluminum to states near shock-induced melting, which allows deduction of the flow strength of solid aluminum during transition to the liquid phase. The new results cover the shock stress range of about 40 GPa through the solid–liquid mixed phase regions to ~160 GPa. Three different observations reported are used to identify the change in material response related to the onset of melting, which occurs at approximately 115 GPa; these include (1) transition of the initial loading or unloading wave speed measurements which approximates the elastic longitudinal velocity at the shock stress; (2) the change in shear stress (τ c + τ H ) during unloading; and (3) estimates of Poisson’s ratio from the estimated longitudinal and bulk velocities in the shock state, all of which provide information on the melt process and support theoretical estimates of the onset of shock-induced melting.
In this study, two and three-stage light gas guns are used to investigate the strength of 6061-T6 aluminum from the initially full solid at about 40 GPa, up to and through the solid–liquid mixed phase region. Where applicable i.e., at two-stage gun impact velocities, reloading and unloading techniques were utilized to estimate the two unknowns τ c and τ H . The self-consistent method [2, 9] was used to estimate material strength. In addition, an approximation of this method provides additional information on strength variables, such as the QE strain associated with yielding at high shock stresses.
Material
Commercially available targets and impactors (used in all unloading tests) of 6061-T6 aluminum alloy, with a composition of: 94.5 wt% Al, 1.1 wt% Mg, 0.68 wt% Si, 0.6 wt% Cr, 0.49 wt% Fe, and 0.38 wt% Cu, were studied. The equation of state (EOS) parameters used for the analysis of the aluminum symmetric impact tests, were obtained from the Sesame 3700 EOS library [10]. The material properties for the aluminum and lithium fluoride (LiF) are described in Table 1 where γo is constant. The material used for the two-stage light gas gun unloading experiments was an aluminum impactor backed with a low-impedance plastic backing, polymethylpentene (TPX). The reloading experiments require a higher impedance material backing to the aluminum impactor, which was oxygen free high conductivity (OFHC) copper (titanium backing was used in one case).
The reshock configuration incorporated a novel approach using an explosively welded combination of aluminum and copper manufactured by High Energy Metals, Inc. (Sequim, WA). Explosion bonding is used for the metallurgical joining of dissimilar metals (copper and aluminum for the reloading experiments for this paper). The process uses the forces of controlled detonations to accelerate one metal plate into another at a slight angle, creating an atomic bond between the two materials usually with an interlocking surface structure. Explosive welding is considered a cold-welding process which allows metals to be joined without losing their pre-bonded properties. Though the strength of the bond will be approximately that of the aluminum, it is the impedance of the material that is of significance and not the strength of the bond. When the shock wave in the impactor arrives at the interface the higher impedance copper, it will reflect it as a reshock wave. After the welding process, the aluminum-copper plate was fabricated into six 25 mm diameter discs and the thickness of each was dimensioned according to experimental specifications. One of the discs (prior to final dimensioning) was used for material characterization with optical microscopy and SEM analysis. Figure 2 shows a mosaic of the sample used for this purpose.

Explosively bonded reloading impactor is shown in its initial condition, prior to machining, in a, b, and c. Three distinct layers are shown in b and are labeled as Layer 1, 2 and 3 where layer 1 is the 6061-T6, layer 2 would be the 6061-O and layer 3 would be the OFHC copper. Layer 2 provides indications of grain size and in c which confirms the 6061-O material
The process for making these reloading impactors was such that a 1 mm thick layer of 6061-O (annealed) was explosively bonded to the copper followed by explosively bonding the composite structure to a 19 mm thick 6061-T6. The resulting microstructure showed three distinct layers, shown in Fig. 2b, which are the 6061-T6, 6061-O and copper representing layers 1, 2, and 3 respectively. Analysis from the backscattered SEM image (Fig. 2a showing layer 1 and layer 2) of layer 1 indicates a different chemistry (Zn, Mn and Si concentrations) from layer 2, but is still consistent with 6061-T6 aluminum. The layer 2 region (zoomed) shown in lower portion of Fig. 2c has much smaller deformed grain size and is consistent with the 6061-O condition.
The bonding layer between layer 2 and layer 3 (copper) was measured to be less than 25 μm. The 25 μm thickness of the bond will make the reshock wave initially appear as an “isentropic” wave which will shock up quickly to the reshock wave due to material non-linearities. The local hardness for layers 1 and 2 were estimated to be 136 and 68 (knoop hardness test) which is consistent with aluminum of T6 and type O values respectively.
For the optimal impact condition, the impactor should be totally aluminum 6061-T6 (matching the target), approximately 1 mm thick. However, the 6061-T6 layer, shown in the upper portion of Fig. 2b, was removed by machining to obtain the desired impactor thickness. Since the intention was to have a perfectly symmetrical impact where the same materials would be used for the target and impactor, this turned out to be not possible and what was done to evaluate the explosively bonded impactor for reshock studies was to (1), realize that the aluminum impactor on the reloading test will add a very small uncertainty [12] in the analysis and (2) perform an experiment with 6061-T6 and a glued titanium backing material at the same pressure state to verify the uncertainty produced by the explosive bonding process.
Experimental Technique
Plate impact experiments were performed using two and three stage light gas guns [13–15]. Impact velocities on the two-stage gun were measured to better than 0.2 % [16] while the flyer plate velocity on the three-stage gun was determined to within ~2 % [17, 18] using the finite difference hydrodynamic code CTH [19]. The experimental configuration used for the reshock and release experiments is shown in Fig. 3. To achieve the shock stress range of interest and maintain well-defined initial planar shock loading followed by either planar unloading or planar reloading, two types of impact configurations were used. The backing material for the unloading and reloading experiments on the two-stage gun were described earlier, while the three-stage flyer allowed full release from the shocked state due to its rear free rear surface. The experimental configuration used for the experiments on the two and three stage guns are shown in Fig. 3. The two-stage gun configuration allowed shock loading release and reshock (Fig. 3a) for symmetric impact to nearly 100 GPa, while the three stage configuration (Fig. 3b) produced impact shock stresses (approximately symmetric impact with aluminum) to 160 GPa. Lithium fluoride (LiF) windows were used because (1), this window has well known mechanical and optical properties [11] and (2), it has an impedance close to that of aluminum. Because of the similarity of the impedances for LiF and aluminum, corrections necessary to estimate in situ wave profiles are negligible [3].

a Experimental configuration for unloading and reload and experiments on the two stage light gas gun, and b configuration for the three stage gun flyer plate experiments
The velocity interferometer system for any reflector [20] (VISAR) was used to measure the time-resolved particle velocity at the window-sample interface, as shown in Fig. 3 for the unload and reload experiments [2, 9]. This system provides good time resolution to address the QE recompression issue. It also provides accurate measurement of shock stress σ H , since the shock Hugoniot of LiF [11, 21] is accurately known. The particle velocity measuring systems used for all experiments were double delay interferometers with sensitivities that varied from 0.047 to 1.79 km/s. The ultra-high sensitivity of 0.047 km/s was used to completely resolve the QE velocity region and transition to bulk response. This results in a particle velocity accuracy of 0.2 % [20] depending on actual velocity. The corresponding time resolution was limited by the recording oscilloscopes to ±0.5 ns.
Experimental Results
The experimental results are summarized in Table 2. Sample thickness, and impact velocities for companion reshock and release experiments were kept as similar as possible for analysis. Symmetric impact provides determination of in situ particle velocity behind the shock front which is exactly one-half the measured impact velocity. The error represented by this assumption is small (<1 %) in the two-stage work, however the three-stage flyer velocity experimental error bars will be higher (~2 %) due to the additional uncertainty in calculating the flyer velocity [17, 18] which is based on the measured graded density impactor velocity. Additionally, for the three-stage experiments, the flyer-plate will be warm due to a small initial shock produced during initial impact of the graded density impactor; hence a Hugoniot for a warm flyer-plate is needed for the analysis. It has been shown, however, due to small temperature increases [22, 23] the density change in the aluminum three-stage flyer is less than 0.2 %, and can therefore be ignored for the initial analysis. The particle-velocity measurements based on aluminum symmetric impact experiments and the published EOS parameters [10], Hugoniot stress σ H and strain ε were determined and listed in Table 2.
The composite particle velocities at the window/target interface are plotted in Fig. 4 for the two stage and three stage gun experiments. The particle velocity profiles represent shock states from nominally 40 to 80 GPa for two-stage tests and 115 to 160 GPa for the three stage experiments. All the two stage (unload and reload) experiments indicate that the initial release or reload from the shock state exhibits an elastic response as indicated by comparison of the measured initial unloading velocity with the expected elastic longitudinal velocity at that shock stress level. Similar initial elastic behavior is observed in all the three stage release experiments except possibly for the 145 GPa experiment, but definitely not in the 160 GPa experiment (from previous work) which indicated initial bulk release. However, it should be noted that the initial elastic velocities for impact stresses near an in the solid–liquid mixed phase region indicate an increase in Poisson’s ratio, as will be discussed.

Two stage release/reshock wave profiles (a) and three stage release wave profiles (b)
This initial QE release observed in nearly all tests is consistent with previous studies on aluminum [2, 3] and is typical of other metals such as beryllium [26], copper [27], tungsten [28, 29], and even within ceramics [4, 7, 30]. In analyzing the unloading and reloading profiles to estimate strength properties, it is usually assumed that the initial release from the shocked state is also isentropic, which is a good assumption for both QE and plastic unloading and reloading waves because the stress deviators make a relatively low contribution to entropy or temperature increase [31]. The assumptions used to deduce strength properties are [2, 3, 6], (1) a yield surface exists for the material after shock loading, which is experimentally determined/detected as a transition from QE to plastic response. A related assumption is that the yield surface remains symmetric (2) the yield function Y depends on some measure of plastic strain or/and pressure, and minimal plastic work hardening during QE unloading or reloading is assumed; (3) QE reloading and unloading from the shocked state are rate-independent; and (4) the initial shear stress state produced after shock loading is assumed to be given as τ H . This is not necessarily equal to the shear strength at the shock state so that the shock-induced initial shear stress is not necessarily on the yield surface. However, the critical shear strength, τ c , is on the yield surface and may be different from τ H . It is noted that in the original elastic–plastic model [1] τ c = τ H .
Estimation of Shear Stress
For uniaxial strain shock loading, the resolved shear stress, τ, is defined as the difference between the principal stresses in the longitudinal (x) and transverse (y) directions
and after yielding occurs this will be equal to the critical shear strength τ c , (τ c = 1/2 Y), where Y is the current value of yield or flow strength at the corresponding shock stress and strain state. Following the self-consistent method [6, 9], the shear strength in the shocked state can be determined from analysis of unloading and reloading profiles. From the elastic–plastic relation [1], the relationship between shear stress, longitudinal stress and pressure for uniaxial strain loading can be written as [32].
where σ is the longitudinal stress, P is pressure, and e is engineering strain defined as 1-ρ 0 /ρ. Equation 2 allows determination of wave velocities associated with a given increment of stress or strain. From the definitions of Lagrangian unloading or reloading wave speeds, c, and Lagrangian bulk wave speed, c B , [2] a differential equation can be developed for the resolved shear stress.
which applies to the response for unloading or reloading from the shock state. In both cases the response during the QE portion of the unloading and reloading is assumed to be isentropic so that Eq. (3) applies. From the assumptions in “Experimental Results” section, the unloading and reloading experiments provide two independent integrals for applying Eq. (3). It is assumed that the Hugoniot state is described by the variables, (σ H , e H , τ H ), where τ H is the resolved shear stress at this state, as mentioned above. With this assumption, the shear stress changes from τ H during QE unloading to −τ c , which is on the lower portion of the inverse yield envelope and represents the onset of full plastic unloading. For QE reloading, the shear stress will increase from τ H to the critical strength, +τ c , on the upper yield surface (depicted in Fig. 1). These relations allow determination of the resolved shear stress, τ H , at the shocked state and the critical shear strength, τ c at the corresponding state through measurement of the Lagrangian wave velocity, c, in the QE regions for unloading and reloading. The bulk wave speed, c B , in this region is estimated by extrapolating the measured plastic (unloading and reloading) wave speeds (Fig. 5). This requires integration as a function of strain [2, 3] because the different components in the elastic–plastic relation apply to a specific strain. In practice, it is easier to work in the wave velocity versus particle velocity plane to estimate the bulk speed in the QE region because the bulk wave speed is linear over larger ranges in this plane. Integrating Eq. (3) over the two QE regions gives:

Depiction of longitudinal and bulk Lagrangian wave speed measurements used for estimating the changes in shear stress occurring during the QE unloading and reloading
When the wave velocities are accurately measured, the above equations allow accurate, (referred to as ‘exact’ in the following discussion) estimates of the change in shear stress for unloading and reloading. In some experiments, the wave velocities may not be accurately measured, but the unloading and reloading profiles still contain a specific QE unloading response, as shown in Fig. 5, that can be used to estimate shear stress. It has been previously shown [33] that a very good approximation to the integral can be obtained when the wave velocity variation is linear with particle velocity in the QE region. The resulting relations used to estimate the shear stress change for unloading and reloading is referred to as the ‘approximate-method’. The high quality of the unloading and reloading data obtained in the present experiments allows an accurate assessment of the accuracy of the approximate technique in estimating high pressure strength of aluminum. The corresponding approximate relations for unloading and reloading are given as [33].
where c 2 L (e H ) is the Lagrangian elastic longitudinal velocity at the shock state, c B is the corresponding Lagrangian elastic bulk speed at this state, Δu QE is the change in particle velocity for QE unloading or reloading, and c QE and \(\vec{C}_{QE}\) are the average wave velocities in the QE region for unloading and reloading respectively.
Previous comparisons of the approximate and exact estimates of shear strength have shown good agreement at lower peak pressures [32, 33]. In the present experiments, the comparison has been extended to 145 GPa, which is shown in Table 3. It is found that the correlation is still very good, being on average about a 1–5 % difference between the exact and approximate strength estimates, although individual variations can be as high as ±20 %.
The QE engineering strain during unloading is given by the ratio of the particle velocity change in this region, divided by the average QE wave velocity. Previous studies [32, 33] have shown that the true QE strain, which is the engineering QE strain multiplied by the ratio of final over initial density, is relatively constant with stress. For ramp loading of LiF [32] found that the true QE strain was essentially constant at a value of 0.013 at loading stresses to over 100 GPa.
Figure 5c gives the measured Lagrangian unloading and reloading wave velocities obtained on an example of unloading and reloading experiments. The initial velocity from the shocked state is assumed to be elastic, as earlier mentioned, and the transition to plastic response is apparent from the cusp at states u 1 and u R for the unloading and reloading respectively.
The bulk velocities in the elastic regions can be estimated by linear extrapolation from the lower portion of the profile, as shown by the dashed lines (from u 1) in Fig. 5a, c. The QE portion of the unloading and reloading wave profiles are used to directly determine the QE wave speed c needed for Eqs. 4 and 5. The bulk wave speed c B over after the QE response for both cases (unloading, reloading) was evaluated from the plastic part of the release wave profile, shown in Fig. 5a, c, which is assumed to represent bulk response. This approach is thought to introduce negligible errors in estimating the shear stress. Note that the presence of the plastic reload wave (from the copper backing) from the initial shock state, Fig. 5b, obscures the intersection of the QE reloading curve with the extension of the bulk wave velocity curve at the extrapolated state u 2 in Fig. 5b. However, reloading experiments conducted with different impedance backings (either copper in ALRS-4 or titanium in ALRS-2_Ti) even with different plastic reshock velocities and thus different degrees of extrapolation, have produced essentially identical shear stress estimates when the two backing materials were compared; suggesting that the extrapolation method is accurate.
Error Estimates
Errors arising in use of the self-consistent, ‘exact’ method of analysis can be estimated from the general relation that is derived from the quantities identified in Eqs. 4 and 5 such that
where c is Lagrangian wave velocity in the QE regions for unloading and reloading, c L is the Lagrangian elastic longitudinal velocity at the shock state, c B is the corresponding Lagrangian elastic bulk speed at this state, and u is the particle velocity. It is also noted that this relation (Eq. 8) is similar for the approximate method in Eqs. 6 and 7.
Statistical errors are somewhat easier to define as these arise in Lagrangian analyses primarily from uncertainties in measured wave and particle velocities. As discussed in the experimental section, the timing for making unloading/reloading wave velocity measurements relies on accurate determination of the shock velocity at the impact state. This is determined from the known EOS of aluminum and accurate impact velocities measurements (better than 0.2 %) to estimate the particle velocity (one-half the impact velocity from symmetric impact) at the shock state. The Sesame 3700 EOS for aluminum [10] was used to determine the shock velocity needed in establishing the initial unloading time for the aluminum impactor. This EOS has been well established both theoretically and experimentally so that shock velocities are known to within about 1 % for experiments with the two-stage light gas gun. Additionally, uncertainties in wave velocities (c L , c B ) also arise in timing and sample thickness, ±0.2 ns and ±0.3 μm, respectively. These errors produce an uncertainty of approximately 0.3 % in determining wave velocities. The three-stage shots, because of the 2 % uncertainty of impact velocity, the errors increase to 2.5 %.
The quantities τ c + τ H and τ c − τ H are determined from the measured wave speeds as described in Eqs. 4–7. Treating the systematic uncertainties in wave speed as independent statistical errors we determine that the uncertainty in estimating Δτ for unloading or reloading for the two stage experiments as approximately 3.5 and 25 % for the unloading three-stage experiments (τ c + τ H ). Using these values (τ c + τ H and τ c − τ H ) to estimate uncertainties in τ c and τ H gives approximately 0.03 GPa for two-stage shots. This correlates to an approximate uncertainty in flow strength (Y) of approximately 5 and 20 % for two and three stage experiments respectively.
In addition to statistical errors there are several systematic errors that have not been fully resolved. The impedance mismatch between aluminum and LiF, which is on the order of 2 % [32] has a relatively minor effect on the unloading profile because the lower impedance of LiF produces a small release wave originating from the first shock arrival which elastically unloads the sample to a state within its yield surface. A QE release wave model [34] was used in simulating [3, 35] the measured release profile (from previous work) that demonstrated that the impedance mismatch for unloading provides no apparent systematic error. However, the reloading experiments will have a larger associated error. Again, as stated above, the sample will unload within its yield surface, then elastic recompression from this perturbed state followed by the plastic wave to the upper yield surface will result for the reloading experiments. This effect will be investigated in detail in future work. This effect is minimized by proper window/sample impedance matching and designing experiments to maintain the interaction region to less than one quarter of the sample thickness. This ratio was approximately maintained in the present experiments. Other statistical errors include; (1) assuming the modulus over the QE portion on the unloading and reloading profile is linear, (2) the errors in the LiF EOS upon unloading. At this time the uncertainties noted have not been taken into account and future work will include these numerical simulations to estimate errors from these different sources.
Estimation of Shear Strength
The results of τ c + τ H and τ c − τ H for the unloading and reloading experiments respectively, are listed in Table 3. Additionally, comparisons of the ‘exact’ and ‘approximate’ method results are tabulated. The shear strength, τ c and shear stress, τ H , listed in Table 3 were determined from the measured values (τ c + τ H and τ c − τ H ) for the unloading and reloading experiments.
The measured values of τ c + τ H and τ c − τ H listed in Table 3 are plotted in Fig. 6. Also shown are lower pressure reload and unload experiments [2, 3] for 6061-T6 aluminum. Figure 6 summarizes the variation of shear stress during unloading (Fig. 6a) and reloading (Fig. 6b) with increasing shock stress.

Shear stress data for a unloading and b reloading experiments. An apparent change in τ c + τ H and τ c − τ H for unloading and reloading is shown to occur at about 40 GPa
The present data represents the first measurements of τ c + τ H (shear stress) above 40 GPa (for 6061-T6 aluminum) which shows a nearly constant value to a shock stress of approximately 115–120 GPa where a large drop in this (shear stress) quantity occurs. The shock stress level (~120 GPa) is consistent with theoretical predictions for the onset of melting in aluminum [36–38]. This correlation will be discussed later in the paper.
As mentioned earlier the results for τ c − τ H show an increase to approximately the same shear stress level (as the unloading data) of about 40 GPa, followed by essentially constant values for higher shock stresses. It should be noted that for the elastic–plastic model the Δτ for reloading should remain at zero [1]. The large increase in this quantity indicates strong departure from the basic elastic–plastic model and further suggests that the shock state is very close to being hydrostatic, even though the shear strength itself is large. This unexpected response is discussed later in the paper. It is significant that the independent measurements of Δτ for unloading and reloading show the same change in response at similar shock stresses, suggesting a fundamental change in the hardening mechanism for τ c .
As indicated earlier (listed in Table 3), the individual shear stress components, τ c and τ H , are obtained by taking the sum and differences of the Δτ’s for unloading and reloading. The resulting components are shown in Fig. 7 and arguably illustrates that the shear stress (τ H ) in the shocked state is considerably less than the shear strength (τ c ) at the same shock stress (for shock stresses above 40 GPa). As mentioned earlier these should be equal from the elastic–plastic model. Further, the transitions in the Δτ’s for unloading and reloading are preserved in the behavior of the individual shear stress components, as illustrated in Fig. 7. At the lower shock stress levels, the data suggests a deviation from the microband model [39] where the shear stress, τ H , should decrease with increasing shock stress. Up to 30–40 GPa, it is shown that the shear stress, τ H , increases. However as the shock stress increases (above 40 GPa), there is a dramatic decrease in the shear stress τ H (Fig. 7b). This behavior could indicate that there are two softening mechanisms.

The shear strength, τ c , and the initial shear stress, τ H , in the shocked state are plotted as a function of shock stress
Material Strength
In most of the previous studies, it has been usually assumed that initial shock loading produces a shear stress state equal to the critical strength at the corresponding shock stress. Studies on metals have suggested [26–28] that the initial shear stress is not equal to the critical strength, but intermediate between the critical shear strength (Fig. 1) and zero, which corresponds to a hydrostatic state of stress [2, 3, 6, 31]. This assumption was necessary because reloading experiments were not available to allow determination of the shear stress state immediately after shock loading. The current advance in experimental capabilities to launch double impactors without the separation normally observed for double impactor experiments, now allows clean reloading data for estimating both the high-pressure strength and the initial shear stress in the shock state.
In addition, for several non-metals, a state of initial hydrostatic compression, or zero shear stress, has been observed for shock loading in the intermediate stress range, even though the yield, or shear strength was found to be finite and significantly larger than the ambient value [4, 7, 8].
This conclusion was derived from the observation that the change in shear stress during unloading, τ c + τ H , was essentially equal to the change in shear stress, τ c − τ H for reloading. With the usual assumptions that a yield surface exists and that the change in shear stress is not rate-dependent, this observation implies that the initial shear stress state, τ H , is zero and consequently that the shock state is hydrostatic. Furthermore, these results emphasizes that strength studies based on unloading data alone will provide estimates of yield strength that are too low when the shock state collapses to the hydrostat. Therefore, use of unloading data alone to estimate parameters in strength models [40, 41] can result in significant error, which emphasizes the need for additional shear stress path studies, such as reloading data that can critically test the assumptions and provide additional shear stress data.
Previous unloading experiments on 6061-T6 aluminum [2] and pure aluminum [3] suggested that Δτ for unloading uniformly increased as shock stress increased to about 40 GPa and then decreased over the stress range up to about 100 GPa. However, reloading experiments were not performed for shock stresses above ~20 GPa [2, 3] so it was not possible to determine if the observed change was due to a change in the critical strength or a decrease in the initial shear stress in the shock state. The present unloading data confirms the earlier results and also show that there is a corresponding change in Δτ for reloading. Both are observed to remain fairly constant over the range of about 40–90 GPa as shown in Fig. 7.
Two principal mechanisms have been proposed to explain the differences between the two shear stress components in Fig. 7. One is a local hot spot mechanism [39] that predicts an initial loss of shear strength due to transient high local temperatures in hot spots that approach the melting point of aluminum. Another is the local stress oscillations caused by heterogeneous deformation due to variation in properties at the mesoscopic scale [6].
The present data are not sufficient to differentiate between these two models. However, some general observations can be stated about the observed shear stress effects. The fact that τ H is different from τ c in the stress range up to 40 GPa suggests either a softening mechanism as in the Swegle–Grady model or a heterogeneous deformation effect. However, the abrupt decrease in τ H near a shock stress of 40 GPa (Fig. 7b) suggests the onset of another softening mechanism or possibly the transition from a meso-scale mechanism to an internal softening mechanism at this stress level. Several possibilities could be hypothesized, including the concentration of deformational energy at imperfections such as grain boundaries at the initial high shock loading strain rates achieved at 40 GPa (possibly as high as 1011/s) [42]. However, it is noted that if a meso-scale effect alone were responsible for the observed variation in shear stresses, this should continue to be important at high shock stresses and a transition effect at 40 GPa would probably not occur. At this stage of understanding, it is not possible to develop more specific ideas about the apparent softening effects in the shock induced resolved shear stress.
In Fig. 8 the actual flow strength can be estimated up to approximately 80 GPa because the newly developed double impactors provide a high quality measurement of the shear stress change associated with reloading. This allows independent determination of the critical shear strength and the initial shear stress in the shocked state.

Strength of shocked aluminum from present and past two-stage data compared with ramp loading, Steinberg–Guinan model, and three-stage gun unloading data. Error bars are estimated from “Error Estimates” section from shock loading data and ramp loading estimates from Vogler et al. [31]. Shaded area represents range from onset of, to complete melt
Recent ramp loading experiments [31] have shown that τ c − τ H is smaller than that for shock loading (and thus closer to the response expected from the elastic–plastic model), so plotting the unloading as flow strength, Y, is a better approximation but still gives rise to errors in estimating the yield strength. For the reported ramp wave data in Fig. 8 [31] we have used reported estimates for τ c − τ H under ramp loading to correct the unloading data and estimate the actual strength. The flow strength for the three-stage experiments have also been plotted (Fig. 8). These values were estimated by using the values of shear stress (τ H ) shown in Fig. 7b as one limit for this quantity and zero as the other limit. As shown in Fig. 7b, the value τ H above approximately 40 GPa appears to remain constant at about 0.05. It is reasonable to assume that these values will not increase and will only decrease to zero as full melting is approached. Hence, the upper bound can be used to determine flow strength in Fig. 8 which should be accurate to about 0.16 GPa. Additional reloading experiments are planned in this region to verify this assumption. The Steinberg–Guinan [43] model is commonly used for shock wave loading since it provides a suitable description of strain hardening, pressure, and temperature dependence that has been determined from experiments. The model can reproduce experimental data to shock stresses of about 90 GPa. However, the model was developed on unloading data so there are significant differences between the model and the experiments performed by unloading and reloading. Based on the model’s parameters, the resulting curve is plotted in Fig. 8 as a solid line. Huang and Asay provided an additional three-parameter function (applied to the Steinberg model) for a plastic strain hardening term [3] to simulate higher stress experiments and the ensuing curve is shown as a dashed line in Fig. 8.
The data also shows that the unloading velocity (Fig. 9) becomes essentially equal to the measured bulk velocity at shock stresses of approximately 160 GPa, implying this to be the boundary between solid–liquid and complete liquid. These transitions are essentially consistent with the transition in yield strength and the theoretical expectations of incipient melt at 120–125 GPa [36–38, 44] and complete melting at 150–155 GPa [36–38] to within expected uncertainties.

Variation in longitudinal and bulk velocities with shock stress. Current work defines the change in unloading velocity from the onset of melting, into the mixed-phase, and further into the liquid phase as the initial unloading velocity becomes equal to the assumed bulk. Closed symbols represent longitudinal velocities. Closed symbols represent bulk velocities
It is noted that the association of initial unloading wave speeds with the onset of melting in aluminum is different than that for copper. Hayes et al. [45] found that the change from elastic longitudinal wave velocity to bulk velocity during initial unloading corresponded with the onset of melting, rather than the completion of melting, as for aluminum. They ascribed the effect to the release of local elastic energy stored at defects (such as grain boundaries) in the copper sample, which results in premature melting. It would be expected that shock-induced melting would be similar for these two (aluminum and copper) face centered cubic (fcc) metals, yet there is significant difference in behavior which is not presently understood. Additional data are needed to resolve the apparent difference in melting behavior for aluminum and copper.
Discussion
The present research represents a comprehensive study of the dynamic behavior of aluminum over the shock stress regime of 30–160 GPa. This investigation allows us to probe the dynamic shear stress states of the material in the shocked state. Many of the existing models of high pressure strength are based on unloading profiles data only [40, 41]. It is the reshock and release configuration of experiments used in this study that allows us to estimate the complex nature of the material response. It is obvious that the actual dynamic material response is a lot more complex than simple elastic plastic behavior. It is anticipated that these studies will motivate the development of new material models which encompasses many of the new physical processes identified in this investigation. A major objective of the present research is to provide data on the strength of materials at high pressure to develop better strength models and to test existing models. However, as shown in Figs. 6 and 7, estimates of strength based on unloading data alone can under-estimate the strength by up to a factor of two (with respect to some existing strength models [40, 41] ).
The error is based on the value of τ H . In the traditional elastic–plastic model [1] the shock state in the plastic region is assumed to be on the upper yield surface, so that τ H = τ c therefore the change in shear stress during unloading is equal to the flow strength. At lower shock stresses in aluminum [2, 3, 6] this is a reasonable approximation and the resulting error in estimating strength from unloading alone is about 30 %. However, for shock stresses above about 40 GPa, the reloading experiments illustrate that the change in Δτ is nearly equal to that for unloading seen in Fig. 6. As shown in Fig. 7b, the resulting τ H is on the order of 0.05 GPa over the shock stress range of 40–90 GPa, which implies that the shock stress is nearly equal to the hydrostatic pressure. Because of this small value the change in shear stress estimated from unloading experiments is only about half of the flow strength, as illustrated by the difference between the original Steinberg model [41, 43] for the strength of aluminum and the present data shown in Fig. 8. Also shown is a modification of the original model developed from unloading and reloading data on aluminum to about 20 GPa and extrapolated to higher stresses [3]. The modified model fits shock data reasonably well to shock stresses of about 40 GPa. As mentioned earlier, the modified model changes the strain hardening part of the Steinberg model without affecting the pressure and temperature dependence.
As illustrated in Fig. 8, the original reported Steinberg model under predicts significantly the strength of aluminum in the high pressure range. The large variation between the model and experimental data for aluminum suggests the possibility that similar discrepancies may exist for other materials. Presently, the only direct way to examine this issue is to perform reloading experiments, similar to the present work on aluminum. The use of reloading experiments has been previously limited by the inability to produce a clean reloading from the shock state because of slight separation of the double impactor during launching. The present experiments have demonstrated that this problem can be eliminated through use of explosively bonded double impactors, which should make these reloading experiments more routine. However, it is emphasized that further work is needed to fully qualify a suite of double impactors for reloading experiments to ensure that the explosive welding process does not adversely affect the measured data.
Another issue illustrated in Figs. 6, 7 and 8 is the abrupt change in hardening behavior for aluminum beginning at a shock stress of about 40 GPa. For stresses below this, hardening can be described qualitatively by a pressure dependence of shear modulus which describes the data well, whereas above this stress, the data indicate essentially no further increase in strength to the onset of melting near 120 GPa where the strength is observed to decrease rapidly to zero near 150 GPa. At present, it is not clear why the transition in hardening behavior at 40 GPa occurs. One possibility is the production of localized hot spots, as previously proposed by Swegle and Grady to explain apparent softening of strength in aluminum, followed by recovery after initial shock compression. They found that this effect is highly rate dependent. It is noted from the fourth power law for strain proposed by Swegle and Grady that if this relation continues to hold for stresses from about 10 GPa to the present levels, that the rise time of the shock is on the order of 1 fs, with an associated strain rate of about 1011/s. It is not presently clear what deformation mechanisms could operate at these rates to explain the change in hardening behavior at 40 GPa. Furthermore, the increasing proximity of the onset of melting above 40 GPa could produce an increased number of hot spots that could prevent additional hardening. Additional study is needed to understand this behavior and to develop an accurate strength model for extreme shock stresses and strain rates.
Summary
A series of experiments was performed to determine the complex strength behavior of aluminum in the shocked state from 30 to 160 GPa. As reported in this paper and [2–4, 7, 8] both shock/reshock and shock/release experiments are necessary to fully understand the shear stress state and the shear strength of a material in the shocked state. A novel technique utilized explosive welding techniques to form bimetallic copper/aluminum impactors for use in reshock experiments. The results of this study can be summarized as follows:
-
1.
A new bonding technique was developed which uses bimetallic samples as impactors for reshock experiments extending the previous reshock experiments conducted in aluminum from ~20 GPa to over 80 GPa. It is currently limited by the maximum velocity that can be achieved on the two-stage light gas gun.
-
2.
Three-stage light-gas guns have been used to extend shock/unload studies utilizing symmetric impact configurations to probe aluminum over the shock stress regime from 80 to 160 GPa at impact velocities approaching 10 km/s.
-
3.
The experiments have allowed us to define (a) the stress/pressure dependent yield surface shear strength of the material, τ c , up to 80 GPa and (b) the shear stress state τ H of aluminum up to 80 GPa.
-
4.
Upon unloading, τ c + τ H increases up to 40 GPa and is found to be relatively constant over the stress regime of 40–120 GPa. Beyond 120 GPa there is a rapid and monatomic decrease of τ H + τ c to 160 GPa and at which it becomes zero.
-
5.
Upon reloading τ H − τ c increases up 40 GPa and remains relatively constant up to 80 GPa. Currently there are no measurements of τ H − τ c at shock stresses over 80 GPa.
-
6.
The shear strength after shock loading, τ c , increases up to 40 GPa and remains relatively constant from 40 to 80 GPa.
-
7.
The shear stress (τ H ) of the material appears to reach a maximum at around 25–40 GPa and appears to decrease to about 0.05 GPa at approximately 40 GPa. This suggests that the shock Hugoniot collapses to a dynamic hydrostat.
-
8.
The rapid strength decrease over the stress regime of 120 to 160 GPa is a clear indication of the onset of melt at around 120 GPa and melt completion at 160 GPa.
-
9.
The Eulerian wave speed measurements also corroborate the onset of melt from 120 to 160 GPa. There is a rapid decrease in the longitudinal (elastic) wave velocities starting from 120 GPa and transitioning totally to bulk wave velocity at 160 GPa.
-
10.
The stress dependent melt behavior observed in wave profiles for shock stresses from 120 to 160 GPa is consistent with time-dependent nonequilibrium melt behavior.
-
11.
This work is believed to be the first ‘in-situ’ type measurements to estimate both wave velocities and strength properties of aluminum during shock loading that describe material behavior from the solid to the onset of melt to the liquid phase. The wave profile analysis provides information on the transition as well as information on Poisson’s ratio (υ). As seen in Fig. 10, υ, remains at the initial value of approximately 0.33 for shock stress states in the solid phase to over 60 GPa, then it increases to 0.39 at the onset of melt (~120 GPa) and continues toward 0.5 until melt is complete (~160 GPa).
Fig. 10 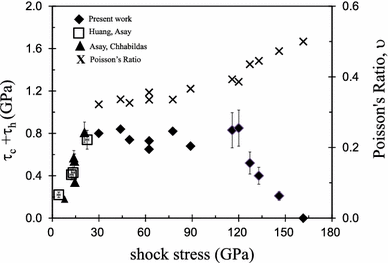
τ c + τ H is shown with shock stress and calculated values for Poisson’s ratio. Error bars of 3.5 and 25 % represent the error approximation for the change in shear stress for unloading wave profiles for the two and three stage gun experiments, respectively
-
12.
Finally, these results emphasize that yield strength studies based on unloading data alone will provide estimates of yield strength that are too low, by up to a factor of two for shock stresses exceeding 40 GPa in aluminum. Therefore, use of unloading data alone to estimate parameters in strength models [40, 41] can result in significant error, which emphasizes the need for additional stress path studies, such as reloading data that can critically test the assumptions and provide additional data on yield response at high shock stresses.

References
Fowles GR (1961) Shock wave compression of hardened and annealed 2024 aluminum. J Appl Phys 32(8):1475–1487
Asay JR, Chhabildas LC (1981) Determination of the shear strength of shock compressed 6061-t6 aluminum. In: Meyers MA, LE Murr (eds) Shock waves and high-strain-rate phenomena in metals: concepts and applications. Plenum, New York, pp 417–431
Huang H, Asay JR (2005) Compressive strength measurements in aluminum for shock compression over the stress range of 4–22 GPa. J Appl Phys 98:033524
Reinhart WD, Chhabildas LC (2003) Strength properties of coors ad995 alumina in the shocked state. Int J Impact Eng 29:601–619
Vogler TJ, Chhabildas LC (2006) Strength behavior of materials at high pressures. Int J Impact Eng 33:812–825
Lipkin J, Asay JR (1977) Reshock and release of shock-compressed 6061-t6 aluminum. J Appl Phys 48:182–189
Vogler TJ, Reinhart WD, Chhabildas LC, Dandekar DP (2006) Hugoniot and strength behavior of silicon carbide. J Appl Phys 99(023512–023511):023512–023515
Vogler TJ, Reinhart WD, Chhabildas LC (2004) Dynamic behavior of boron carbide. J Appl Phys 95(8):4173–4183
Asay JR, Lipkin J (1978) A self-consistent technique for estimating the dynamic yield strength of a shock-loaded material. J Appl Phys 49(7):4242–4247. doi:10.1063/1.325340
Kerley GI (1987) Theoretical equation of state for aluminum. Int J Impact Eng 5:441–449
Wise JL, Chhabildas LC (1986) Laser interferometer measurements of refractive index in shock-compressed materials. In: Gupta YM (ed) Shock waves in condensed matter, Spokane, WA, 1985. Plenum Press, New York, pp 441–454
Asay JR, Chhabildas LC, Kerley GI, Trucano TG (1986) High pressure strength of shocked aluminum. In: Shock Waves in Condensed Matter. Springer, New York
Asay JR, Chhabildas LC, Barker LM (1985) Projectile and impactor designs for plate-impact experiments. Sandia National Laboratories Report
Chhabildas LC, Barker LM, Asay JR, Trucano TG, Kerley GI, Dunn JE (1992) Launch capabilities to over 10 km/s. In: Schmidt SC, Tasker DG, Forbes JW, Dick RD (eds) Shock compression of condensed matter, Williamsburg, 1991. North-Holland, Amsterdam, pp 1025–1031
Chhabildas LC, Dunn JE, Reinhart WD, Miller JM (1993) An impact technique to accelerate flier plates to velocities over 12 km/s. Int J Impact Eng 14:121–132
Thornhill TF, Reinhart WD, Konrad CH (2000) Chhabildas LC Accurate velocity measurements of the two-stage light-gas gun projectile (available upon request to author). In: Reinhart WD (ed) 51st Aeroballistics Range Association, Madrid. Sandia National Labs, Albuquerque
Blackburn DR, Vogler TJ, Chhabildas LC (2003) Hvl cth: a simple tool that simulates the hyper-velocity launch of a flyer plate. Sandia National Laboratories Report, Albuquerque
Carroll DK, Chhabildas LC, Reinhart WD, Winfree NA, Kerley GI (2002) Computational characterization of three‐stage gun flier plate launch. In: Furnish MD, Thadhani NN, Horie Y (eds) Shock compression of condensed matter, Atlanta, Georgia, 2001. AIP, New York, pp 307–310. http://dx.doi.org/10.1063/1.1483541
Mcglaun JM, Thompson SL (1990) Cth: a three-dimensional shock wave physics code. Int J Impact Eng 10:351–360
Barker LM, Hollenbach RE (1972) Laser interferometer for measuring high velocities of any reflecting surface. J Appl Phys V43(11):4669–4675
Carter WJ (1973) Hugoniot equation of state of some alkali halides. High Temp High Press 5:313–318
Knudson MD, Lemke RW, Hayes DB, Hall CA, Deeney C, Asay JR (2003) Near-absolute hugoniot measurements in aluminum to 500 GPa using a magnetically accelerated flyer plate technique. J Appl Phys 94(7):4420–4431. doi:10.1063/1.1604967
Reinhart WD, Chhabildas LC, Carroll DE, Bergstresser TK, Thornhill TF, Winfree NA (2001) Equation of state measurements of materials using a three-stage gun to impact velocities of 11 km/s. Int J Impact Eng 26:625–637. doi:10.1016/s0734-743x(01)00124-5
Huang H (2010) Private communication (2010 through j. R. Asay). Original analysis of this unloading profile obtained at washington state university indicated a delta tau of 1.02 gps. Reanalysis of the data with the technique reported here resulted in a value of 0.80 gpa. The difference is due to a slight non-linearity in unloading wave velocity with strain which was not accounted for in the earlier analysis but is accounted for in the present analysis
Furnish MD, Chhabildas LC, Reinhart WD (1998) Time resolved particle velocity measurements at impact velocities of 10 km/s. Int J Impact Eng 23:261–270
Chhabildas LC, Wise JL, Asay JR (1982) Reshock and release behavior of beryllium. In: Nellis WJ, Seaman L, Graham RA (eds) Shock Waves of Condensed Matter, Menlo Park, 1981. AIP, New York, pp 422–426
Chhabildas LC, Asay JR (1982) Time resolved wave profile measurements in copper to megabar pressures. In: Bachman J, Tegner (ed). 8th AIRAPT Conference, Institute of Physical Chemistry, University of Uppsala, Sweden, Uppsala, Sweden, Arkitektkopia, pp 183–189, 17–22 Aug 1981
Chhabildas LC, Asay JR, Barker LM (1988) Shear strength of tungsten under shock- and quasi-isentropic loading to 250 GPa. Sandia National Laboratories Report
Asay JR, Chhabildas LC, Dandekar DP (1980) Shear strength of shock-loaded polycrystalline tungsten. J Appl Phys 51(9):4774–4783
Reinhart WD, Chhabildas LC, Vogler TJ (2006) Investigating phase transitions and strength in single-crystal sapphire using shock–reshock loading techniques. Int J Impact Eng 33:655–669. doi:10.1016/j.ijimpeng.2006.09.083
Vogler TJ, Ao T, Asay JR (2009) High-pressure strength of aluminum under quasi-isentropic loading. Int J Plast 25(4):671–694. doi:10.1016/j.ijplas.2008.12.003
Ao T, Knudson MD, Asay JR, Davis JP (2009) Strength of lithium fluoride under shockless compression to 114 GPa. J Appl Phys 106:103507. doi:10.1063/1.3259387
Asay JR, Ao T, Davis JP, Hall CA, Vogler TJ, Gray GT (2008) Effect of initial properties on the flow strength of aluminum during quasi-isentropic compression. J Appl Phys 103:083514
Johnson JN, Hixson RS, Gray GT, Morris CE (1992) Quasielastic release in shock-compressed solids. J Appl Phys 72(2):429–441
Gupta YM (1976) Cops wave propagation code. SRI International
Alfe D, Vocadlo L, Price GD, Gillan MJ (2004) Melting curve of materials: theory versus experiments. J Phys 16:973–982
Chisolm ED, Crockett SD, Wallace DC (2003) Test of a theoretical equation of state for elemental solids and liquids. Phys Rev B 68(10):104103
Moriarty JA, Young DA, Ross M (1984) Theoretical study of the aluminum melting curve to very high pressure. Phys Lett B 30(2):578–588
Swegle JW, Grady DE (1986) Calculation of thermal trapping in shear bands. In: Murr LE, Staudhammer KP, Meyers MA (eds) Metallurgical applications of shock-wave and high-strain-rate phenomena. Marcel Dekker, Inc., New York, Basel
Steinberg DJ, Lund CM (1989) A constitutive model for strain rates from 10−4 to 106 s−1. J Appl Phys 65(4):1528–1533
Steinberg DJ, Cochran SG, Guinan MW (1980) A constitutive model for metals applicable at high-strain rate. J Appl Phys 51(3):1498–1504
Grady DE (2010) Structured shock waves and the fourth-power law. J Appl Phys 107:013506. doi:10.1063/1.3269720
Steinberg DJ (1996) Equation of state and strength properties of selected materials. Lawrence Livermore National Laboratory, San Francisco
Ross M, Yang LH, Boehler R (2004) Melting of aluminum, molybdenum, and the light actinides. Phys Rev B 70(184112):184111–184118
Hayes DB, Hixson RS, McQueen RG (2000) High pressure elastic properties, solid–liquid phase boundary and liquid equation of state from release wave measurements in shock-loaded copper. In: Furnish MD, Chhabildas LC, Hixson RS (eds) Shock compression of condensed matter, Snowbird, Utah, June 1999. AIP, New York, pp 483–488
Acknowledgments
Sandia is a multi-program laboratory managed and operated by Sandia Corporation, a wholly owned subsidiary of Lockheed Martin Company, for the United States Department of Energy’s National Nuclear Security Administration under Contract DE-AC04-94AL85000. The authors gratefully acknowledge the vital assistance and effort of the dedicated staff of Sandia National Laboratories Shock Thermodynamic Applied Research (STAR) Facility with their effort for gun operations and target fabrication: T. F. Thornhill, J.R. Martinez, R. A. Palomino, and H. A. Anderson.
Author information
Authors and Affiliations
Corresponding author
Rights and permissions
Open Access This article is distributed under the terms of the Creative Commons Attribution 4.0 International License (http://creativecommons.org/licenses/by/4.0/), which permits unrestricted use, distribution, and reproduction in any medium, provided you give appropriate credit to the original author(s) and the source, provide a link to the Creative Commons license, and indicate if changes were made.
About this article

Cite this article
Reinhart, W.D., Asay, J.R., Alexander, C.S. et al. Flow Strength of 6061-T6 Aluminum in the Solid, Mixed Phase, Liquid Regions. J. dynamic behavior mater. 1, 275–289 (2015). https://doi.org/10.1007/s40870-015-0030-6
Received:
Accepted:
Published:
Issue Date:
DOI: https://doi.org/10.1007/s40870-015-0030-6