Abstract
The Pourbaix diagrams also known as the E-pH diagrams were constructed for hardfacing alloys based on three chromium carbides: Cr7C3, Cr23C6 and Cr3C2 at 298 K (25 °C). Using the thermodynamic data available for the main species at 298 K (25 °C), Pourbaix diagrams for the chromium carbides are constructed at a concentration of 10−6 M of aqueous species. It was found that the diagrams are able to explain the results of experimental work performed on chromium carbides in NaOH. It was found that the stability of carbides is described only by the immune region of the Pourbaix diagram for carbides. Although passive region has been included in the study, it was unclear from the literature if there was a passive film or how protective it was.
1 Introduction
Weld hardfacing alloys containing chromium carbides are of great interest in mining applications where abrasion resistance is of significance. The selection of hardfacing alloys is described in AS2576 [1]. The standard is probably the most advanced standard in the world as it describes not only the composition and hardness but also the microstructures in order to meet the requirements of service. The hardfacing materials described in the standards are based on carbides of different metals. Amongst these, carbides of chromium which indicate Group 2 alloys in the standards are for abrasion resistance. The matrix in which the carbides are precipitated can be either austenite or martensite. Three chromium carbides which have very significant abrasion resistance are Cr7C3, Cr23C6 and Cr3C2 [2].
Although carbides are selected on the basis of only their hardness [1], their corrosion properties are often not considered. In spite of this, hardfacing alloys are used in the alumina industry, the pH of the mining solution is about 14 [3, 4] and in sugarcane crushing the pH is about 3 [5]. Other than this, these alloys are also used in cement, oil and gas drilling, dredging, etc., industries which all operate under corrosive environments. In addition to the above, carbides of chromium have been considered for coating on body implants [6]. Tungsten carbides were considered for use in fuel cell catalysis [7]. Much work has been performed on the kinetics aspects of the various carbides; however, there is very little information on the corrosion thermodynamic behaviour of these materials.
Pourbaix diagrams are useful in predicting the spontaneous direction of electrochemical reactions, identifying the corrosion products and predicting the changes in environment in terms of potential and pH that result in high or low corrosive attack [8]. The present work provides Pourbaix diagrams for chromium carbides that can be used to predict the range of use of these alloys and target electrochemical experiments to areas of interest. It is expected that such analysis will provide guidance for applications and development of hardfacing alloys. The final goal, as future work, is to be able to design hardfacing alloys containing carbides, and other compounds, of different materials by using the Pourbaix diagrams. The authors believe that this would result in more efficient development of hardfacing alloys.
2 Thermodynamic Calculations
The present work provides the details of thermodynamic calculations for the construction of Pourbaix diagrams for chromium carbides, Cr7C3, Cr23C6 and Cr3C2 at 298 K (25 °C). All Pourbaix diagrams were calculated using a concentration of 10−6 M for all the aqueous species. For the dilute solution, the corrosion rate will be higher as the material would be in active state by the absence of passive film [9]. Concentrations of aqueous solutions do affect potentials, and the potentials of various regions are increased with the increase in concentrations of aqueous solutions [10].
In order to plot the Pourbaix diagrams for chromium carbides at room temperature 298 K (25 °C), thermodynamic calculations were carried out with the help of available thermodynamic data of the chromium carbide species. The standard thermodynamic data of Gibbs free energy change ΔG 0 for the chromium carbide species are obtained from various publications [11–15] and are listed in Table 1 for 298 K (25 °C). The method of constructing Pourbaix diagrams is described in a number of publications [11, 12, 16], and these methods are followed in this work. There are several considerations for developing Pourbaix diagram, and these are described below.
2.1 Balancing the Reactions of Two Selected Species
The method of balancing the chemical reactions depending on the chemical species selected is described in this section. The thermodynamic calculations are made for the reduction reactions to construct Pourbaix diagrams using the method described in the literature [11, 12, 16]. Balancing a reaction consists of the following four steps which are constructed under chemical equilibrium: (1) the number of all atoms is balanced without considering the oxygen or charge, (2) the oxygen atoms are then added through water (H2O) on the appropriate side of the chemical equation, (3) the hydrogen ions (H+) are added on the appropriate side to balance the number of hydrogen atoms in the chemical equation and finally, (4) the charges are balanced by adding electrons to the appropriate side. The above four steps are illustrated in the following example of balancing the species chromium oxide Cr2O3 and Cr7C3 [16] in the chemical reduction reaction of chromium carbide in contact with water.
-
Step (1): 3.5Cr2O3 + 3C ⇄ Cr7C3 (Balancing the atoms).
-
Step (2): 3.5Cr2O3 + 3C ⇄ Cr7C3 + 10.5H2O (Balancing the oxygen atoms).
-
Step (3): 3.5Cr2O3 + 3C + 21H+ ⇄ Cr7C3 + 10.5H2O (Balancing the hydrogen ions).
-
Step (4): 3.5Cr2O3 + 3C + 21H+ + 21e− ⇄ Cr7C3 + 10.5H2O (Balancing the charge).
All other equilibrium reduction reactions of the species given in Table 1 are also balanced following these steps. The reactions above and E-pH-dependent reactions (7)–(9) in Table 2 show that carbon is formed during the reaction between carbide and water. Although this is a thermodynamic possibility [17], carbon has been found to be produced at high temperatures or tribological conditions [18, 19]. However, when carbides are in water, carbon dioxide has been found to be generated [7, 20]. It is possible that formation of carbon may be an intermediate step for carbon dioxide generation. However, Andrews et al. [21] had proposed that the formation of carbon can occur when silicon carbide (SiC) reacts with water. The presence of carbon was also detected using Raman spectroscopy [22]. Silicon atoms were found to dissolve in solution leaving carbon on the surface. More work is needed to understand the behaviour of carbides in corrosive conditions for hardfacing applications.
The equilibrium reduction reactions considered here are classified into three categories of reactions: potential (E) dependent, E-pH dependent and pH dependent as described in [23]. The thermodynamic calculations for these three different reactions are calculated at the temperature 298 K (25 °C), and these are described below.
2.2 Thermodynamic Calculations for 298 K (25 °C)
The calculations for the above three types of reactions are briefly described below.
2.2.1 E-pH-Dependent Reactions
The following general E-pH-dependent reaction is used in the thermodynamic calculations for 298 K (25 °C).
where a, m, b and c are the number of moles, respectively, of the species A, H+, B and H2O in the reaction and n is the number of electrons transfer in the electrochemical reaction. In these E-pH-dependent reactions, both electron acceptance and hydrogen ions are involved between the two species A and B [23].
The electric potential E (V) required for the E-pH-dependent reactions [Eq. (1)] using the Nernst equation used by Beverskog and Puigdomenech [11]:
where E o is the standard potential in volt, \({\text{pH}} = - \log \left[ {\left( {{\text{H}}^{ + } } \right)} \right]\), R is the molar gas constant (8.314 J K−1 mol−1), T is the temperature in Kelvin, m is the number of moles in H+, n is the number of electrons involved in the reaction, F is the Faraday’s constant (96,485.33 C mol−1), and C(A) and C(B) represent the concentration of the species A and B involved in the E-pH-dependent reactions.
For calculating the potential E using Eq. (2), the standard potential E ° is obtained from the Gibbs free energy change ΔG0 of the reaction as [24]:
where ΔG 0 is calculated as in [25]:
In this manner, the E-pH-dependent reactions are calculated from Eq. (2) to construct the Pourbaix diagrams for chromium carbides at 298 K (25 °C) and these are listed in Table 2. The reactions are dependent on both potential (E) and pH and give a sloping straight line in a Pourbaix diagram.
2.2.2 For E-Dependent Reactions
The following general E-dependent reaction is used in the thermodynamic calculations for 298 K (25 °C).
In the above reaction, the electron acceptance takes place between two species A and B without involving hydrogen ions [23].
The electric potential E (volt) required for the E-dependent reactions [Eq. (4)] using the Nernst equation is given by [11]:
The standard potential E o is calculated from Eq. (3) and used in the above Nernst equation. This reaction depends on potential (E) which forms a horizontal line in the Pourbaix diagram. Thus, the E-dependent reactions are calculated from Eq. (6) to construct the Pourbaix diagrams for chromium carbides at 298 K (25 °C) and these are listed in Table 2.
2.2.3 For pH-Dependent Reactions
The following general pH-dependent reaction is taken to explain the thermodynamic calculations for 298 K (25 °C).
In the above pH-dependent reaction, the hydrogen ions are involved between two species B and A without transfer of any electrons [23].
The pH-dependent reaction is obtained from the equilibrium constant K related to the Gibbs free energy as [25].
By using K = \(\frac{{\left[ {C\left( A \right)} \right]^{a} [H^{ + } ]^{m} }}{{\left[ {C\left( B \right)} \right]^{b} }}\) and \({\text{pH}} = - \log \left[ {\left( {H^{ + } } \right)} \right]\), we get:
The above reaction takes place at any particular pH and hence forms a vertical line in the Pourbaix diagram. Thus, the pH-dependent reactions calculated from Eq. (9) to construct the Pourbaix diagrams for chromium carbides at 298 K (25 °C) are listed in Table 2.
3 Results and Discussion
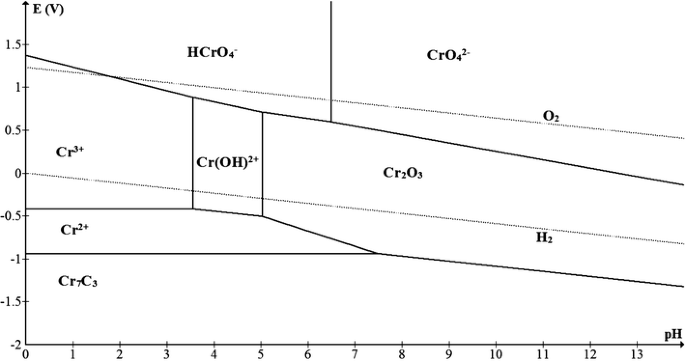
The procedures described above were used to construct the Pourbaix diagrams for chromium carbides at temperatures 298 K (25 °C) for a concentration of 10−6M for all the aqueous species Figs. 1, 2 and 3. For all E-pH-dependent reactions, the values E calculated from Eq. (2) at temperature 298 K (25 °C) are given in Table 2. For E-dependent reactions, the temperature-dependent Eq. (6) calculated at temperature 298 K (25 °C) is given in Table 2. Likewise, for all pH-dependent reactions, the values of pH calculated from Eq. (9) are given in Table 2 at 298 K (25 °C). Using the E-pH equations given in column 3 of Tables 2, the Pourbaix diagrams are constructed.
Figures 1, 2 and 3 show the immune regions, i.e. where no corrosion can occur, for Cr7C3, Cr23C6 and Cr3C2. The passive region consists of Cr2O3. The corrosion regions are formed from the ionic species Cr2+, Cr3+, Cr(OH)2+, HCrO4 − and CrO4 2−. The Pourbaix diagrams for chromium carbides at room temperature from the Figs. 1, 2 and 3 reveal that the Cr3C2 has the largest immune region followed by Cr7C3 and Cr23C6. There are no data yet in the literature yet to prove this prediction. The stability of immune regions for all the three carbides Cr7C3, Cr23C6 and Cr3C2 is higher in low pH and reduced significantly at higher pH level. The types and morphology of carbides depend on the rate of solidification and chemical composition [26]. The type of carbides also depends on the \(\frac{\text{Cr}}{\text{C}}\) ratio, and this ratio also determines the wear and corrosion resistance. The Sabet et al. [2] reported that by increasing \(\frac{\text{Cr}}{\text{C}} = 6\), the carbide volume fraction of Cr7C3 formed and the corrosion resistance for the hardfacing alloys also improved. Thus, the above literature confirmed that Cr7C3 shows better corrosion resistance compare to Cr23C6.
3.1 Significance of Pourbaix Diagrams to Hardfacing Alloys
Pourbaix diagrams for metals consist of three regions. They are regions where corrosion cannot occur, regions where corrosion may occur and regions where corrosion may not occur [27]. Most engineering metals when applied in structures and components are in the passive region. In the case of carbides, immune region is the region where carbides are thermodynamically stable and corrosion cannot occur. It was not clear what a passive region meant for carbides where corrosion may not occur. This is not well covered in the literature and hence this discussion. This is an important consideration as chromium carbides are compounds and it is not clear how passive layers will form in the same way as in stainless steels. In a solid solution, the elements that make up the solid solutions are considered to behave independent of each other [27]. Hence, they can form passive regions and be successful in engineering applications. However, in the case of intermetallic compounds such as carbides if they have to passivate or corrode, the chromium carbide will need to dissociate so an oxide film may form assuming this film provides passivity. Even if passive films could form, the dissociation of chromium carbides may render the alloy unsuitable for wear resistant applications.
Passive films on chromium carbides have been found, but they were found to be very thin in comparison with the matrix. The passive region formed over the carbides was found to be iron dominated [28]. It was found that the silicon carbide exposed in acid solution forms silicon oxide [21, 22]. It was unclear if the film afforded any protection. It is unlikely the passivated surface may actually provide any wear resistance. The investigation by Tylczak et al. [29] observed that the absence of passivity in carbides led to more active potential than matrix. Thus, galvanic cell formed can cause dissolution of the chromium carbide by protecting the matrix. The study conducted by Srisuwan [30] showed that increase in Cr23C6 chromium carbides can reduce the formation of passive film chromium oxide (Cr2O3). In the anodic polarization, studies conducted by Tran [31] and Vargas et al. [32] showed that in alkaline solution, consisting of NaOH, the carbides corroded before the matrix corroded. Tran and Vargas showed that carbides were the first to corrode followed by pitting in matrix at higher anodic potentials and this behaviour followed the trend in the Pourbaix diagrams. Hence, the usefulness of carbides is limited as long as the carbides are held in immune region of potentials.
In general, hardfacing alloys based on chromium carbides have only limited stabilities as the immune region is very small. The only way to improve stability of the chromium carbides is to increase the size of the immune region. This could be attempted by adding elements that form carbides that have better stabilities than chromium carbides. Investigations are under way in the laboratory to study the behaviour of chromium carbide weld deposits through corrosion experiments. Additions of elements such as titanium (Ti), niobium (Nb) and tungsten (W) are being done to improve the corrosion behaviour of hardfacing alloys. The outcome is expected that the results of this paper will provide a better understanding of the application of hardfacing alloys and designing better corrosion resistant hardfacing alloys.
4 Conclusions
The Pourbaix diagrams were constructed for chromium carbides at 298 K (25 °C). It was postulated that the usefulness of hardfacing alloys is mainly in the immune region of the Pourbaix diagrams. The concept of passivity is not well understood for chromium carbides. At room temperature, chromium carbides such as Cr3C2 have the largest immune region followed by Cr7C3 and Cr23C6. The stability of chromium carbides’, Cr7C3, Cr23C6 and Cr3C2, immune regions increases significantly at low pH and reduces at higher pH level.
On behalf of all authors, the Varmaa Marimuthu states that there is no conflict of interest.
References
AS/NZS (2005) AS/NZS 2576:2005, welding consumables for build-up and wear resistance. Australian Standards, Sydney, Australia
Sabet H, Mirdamadi S, Kheirandish S, Masoud G (2013) Effect of volume fraction of (Cr, Fe)7C3 carbides on corrosion resistant of the Fe–Cr–C hardfacing alloys. Assoc Metal Eng Serb 19(2):107–114
Birss VI, Waudo W (1989) The initial stages of lead oxidation in pH 9–14 aqueous solutions. Can J Chem Eng 67:1098–1104
Brace X, Matijević E (1977) Coprecipitation of Silica with Aluminum hydroxide. Colloid Polym Sci 255:153–160
Buchanan V, Shipway P, McCartney D (2007) Microstructure and abrasive wear behaviour of shielded metal arc welding hardfacings used in the sugarcane industry. Wear 263(1):99–110
Kuhn LT (2005) Introduction to biomedical engineering, 2nd edn. Academic Press, Boston
Weidman MC, Esposito DV, Hsu IJ, Chen JG (2010) Electrochemical stability of tungsten and tungsten monocarbide (WC) over wide pH and potential ranges. J Electrochem Soc 157(12):F179–F188
Fontana MG (2005) Corrosion engineering. McGraw-Hill Education, New York
Salasi M, Stachowiak G, Stachowiak G (2011) Three-body tribocorrosion of high-chromium cast irons in neutral and alkaline environments. Wear 271(9):1385–1396
Piron DL (2004) Solved problems in electrochemistry for universities and industry. National Library of Canada, Canada
Hai-Xia Y, Hong-Bin X, Yi Z, Shi-Li Z, Gao YY (2009) Potential-pH diagrams of Cr–H2O system at elevated temperatures. Trans Nonferrous Met Soc China 20:26–31
Beverskog B, Puigdomenech I (1997) Revised pourbaix diagrams for chromium at 25–300 °C. Corros Sci 39(1):43–57
Rock PA (1983) Chemical thermodynamics. University Science Books, Mill Valley
Pankratz L (1995) Thermodynamic properties of carbides, nitrides, and other selected substances. Bulletin 696, US Department of Interior, Bureau of Mines pp 223–225
Chase MW (1998) NIST-JANAF thermochemical tables. J Phys Chem Ref Data 9:1–1951
DoITPoMS (2014) The nernst equation and Pourbaix diagrams. http://www.doitpoms.ac.uk/tlplib/pourbaix/printall.php. Accessed 26 Apr 2016
Hogstrom J, Andersson M, Jansson U, Bjorefors F, Nyholm L (2014) On the evaluation of corrosion resistances of amorphous chromium–carbon thin-films. Electrochim Acta 122:224–233
Jacobson NS, Gogotsi YG, Yoshimura M (1995) Thermodynamic and experimental study of carbon formation on carbides under hydrothermal conditions. J Mater Chem 5(4):595–601
Kitaoka S, Tsuji T, Katoh T, Yamaguchi Y, Kashiwagi K (1994) Tribological characteristics of SiC ceramics in high-temperature and high-pressure water. J Am Ceram Soc 77(7):1851–1856
Voorhies JD (1972) Electrochemical and chemical corrosion of tungsten carbide (WC). J Electrochem Soc 119(2):219–222
Andrews A, Herrmann M, Sephton M, Machio C, Michaelis A (2007) Electrochemical corrosion of solid and liquid phase sintered silicon carbide in acidic and alkaline environments. J Euro Ceram Soc 27(5):2127–2135
Andrews A (2006) Electrochemical corrosion measurement of solid state sintered silicon carbide (SSiC) and liquid phase sintered silicon carbide (LPSSiC) ceramic materials. MSc Dissertation. University of the Witwatersrand South Africa, pp 49–64
Muñoz-Portero MJ, García-Antón J, Guiñón JL, Pérez-Herranz V (2009) Pourbaix diagrams for chromium in concentrated aqueous lithium bromide solutions at 25 °C. Corros Sci 51(4):807–819
Chivot J, Mendoza L, Mansour C, Pauporté T, Cassir M (2008) New insight in the behaviour of Co–H2O system at 25–150 °C, based on revised Pourbaix diagrams. Corros Sci 50(1):62–69
Mahan BH (1963) Elementary chemical thermodynamics. Benjamin, New York
Wiengmoon A (2011) Carbides in high chromium cast irons. Naresuan Univ Eng J 6(1):64
McCafferty E (2010) Introduction to corrosion science. Springer, USA
Salasi M, Stachowiak G, Stachowiak G, Kilburn M (2013) NanoSIMS investigation of passive oxide films on high-Cr cast iron. Corros Sci 67:298–303
Tylczak J, Friedersdorf F (1997) Selected removal of chromium carbides during wear-corrosion testing. In: Proceedings of materials solution on wear of engineering materials, pp 177–184
Srisuwan N (2010) Investigation of chromium carbide precipitation and corrosion behavior on stainless steel AISI 304 for welding process development. In: RMUTP international conference on Thailand
Tran NV (2015) Corrosion behaviour of hardfacing alloys used in the mining industry. Thesis—the degree of Bachelor of Engineering. Charles Darwin University. Darwin
Vargas M, Kannoorpatti K, Murthy V (2014) Studies on the corrosion behaviour of wear resistant hardfacing alloys. In: ACA annual conference on corrosion and prevention, Darwin
Author information
Authors and Affiliations
Corresponding author
Rights and permissions
About this article
Cite this article
Marimuthu, V., Dulac, I. & Kannoorpatti, K. Significance of Pourbaix Diagrams to Study the Corrosion Behaviour of Hardfacing Alloys Based on Chromium Carbides at 298 K (25 °C). J Bio Tribo Corros 2, 17 (2016). https://doi.org/10.1007/s40735-016-0047-y
Received:
Revised:
Accepted:
Published:
DOI: https://doi.org/10.1007/s40735-016-0047-y


