
Abstract
Tidal energy, of all marine renewables energy, possesses higher persistency and predictability over long-time scales. Moreover, the higher density of water than air also results in greater power output from a tidal turbine than a wind turbine with similar dimensions. Due to the aggressive marine environment, there are barriers in the development of tidal power generation technology. In particular, with regard to increased rotor diameter, the selection of material presents significant challenges to be addressed including the tribological environment, such as solid particle erosion, cavitation erosion, the effect of high thrust loading on the turbine blade tips and the synergy between sea water conditions and such tribological phenomena. This research focuses on producing and testing a variety of composite materials with different fibres and reinforcement layouts to evaluate two main tribological issues in tidal environments: matrix cutting and reinforcement fracture. A slurry pot test rig was used to measure the effects of different impact angles and particles sizes at constant tip speeds.
1 Introduction
Globally, 330,000 TWh electricity is produced annually by offshore energy resources [1]. New and renewable energy sources and related technologies are essential components of the path towards sustainable development. Although renewable sources represent the fastest growing energy source in the world, they still have to overcome many technical and financial barriers to achieve their full potential in the market [2].
There are various relative advantages of tidal energy, for example, persistency and predictability over long-time scales due to the well-documented behaviour of the tides, making tidal energy a favourable choice. The higher density of water and contra-rotating blade configuration are other advantages in greater power output from a tidal turbine compared with a wind turbine of similar dimensions in comparable fluid flow velocities [3]. For the growth of tidal energy, there are still technical challenges and financial barriers to overcome. There is still no agreement on the optimum design, materials selection in tidal energy technologies. Hence, the use of more reliable and cheaper materials can contribute in cost reduction of electric power generation by this source. This is possibly due to the general lack of understanding of performance of materials in such environments, which requires a material with remarkable longevity under such conditions.
The mechanical properties, corrosion resistance, and generally cost effectiveness of fibre reinforced composite materials make them an attractive choice for this purpose. However, due to the nature of the tides, identifying a reliable composite material for such environments, especially with an increased rotor diameter, raises more issues to be addressed; including the tribological challenges such as sediment erosion, cavitation erosion, and their possible synergistic effects on the tidal turbine blades [4]. This research focuses on testing and identifying materials with a better tribological performance in marine tidal environments. This includes producing a variety of composite materials with different fibres and reinforcement configuration to evaluate two main tribological issues of composite materials in tidal environments: matrix cutting and reinforcement fracture using a slurry pot test rig [5]. At this stage of the research, commercially available materials have been tested by a modified test rig to (partially) replicate the tidal environment conditions.
In this study, a G10 epoxy glass laminate composite has been tested for its erosion resistance during sub-sea conditions. The synergistic effects and erosive wear mechanisms have been studied on the basis of mass loss, SEM micrographs of the surfaces, EDX analysis and related research work found in the literature using wear mechanisms map techniques [27–30]. Further work will be to compare with tribological performance of different types of composite materials and coatings to evaluate the optimum material for the range of environmental conditions encountered in service.
2 Experimental
2.1 Materials
The testing material was G10 epoxy glass laminate composite, manufactured by National Electrical Manufacture Association (NEMA). This material is widely used in electrical equipment of aerospace, medical diagnostic and underwater conditions. This thermosetting industrial composite consists of continuous filament glass cloth and epoxy as the resin binder. The general characteristic of this material is the high strength, low moisture absorption and excellent chemical resistance in dry and humid conditions. The physical properties of this material are listed in Table 1.
Figure 1 shows the SEM micrograph of the G10 epoxy glass laminate surface before the test. The faded brighter areas can be trapped micro-bubbles under the glossy surface or the residual dust during finishing the side surfaces of the rectangular shape samples. It should be noted that as the samples were purchased from a commercial supplier, some tiny dents and superficial scratches can exist on the test surfaces due to packing and transportation. Extra care was taken to use the samples for the tests with a surface finish close to perfect.

SEM micrograph of a unexposed surface
2.2 Sample Preparation
The G10 samples were tested as tidal turbine blades. The sizes of the samples were 60 mm in length, 25 mm in breadth and 6 mm in thickness. The sides of the rectangular specimens were polished using 1200 grit SiC papers to ensure a high quality surface finish. Then the samples were carefully cleaned by methanol wipes to remove the dust or any debris. After ensuring the dryness of the samples, the initial weights of the samples were measured three times to avoid reading errors.
2.3 Test Slurry
The tests were conducted in three testing environments: (a) NaCl solution, (b) silica sand in water slurry and (c) silica sand in NaCl solution. The sand was supplied by Mineral Marketing, UK. The sand particles were sieved twice in the lab to ensure the size of the particles. The chemical composition of the sand used is mentioned in Table 2. The specific gravity of the sand was 2.65, and bulk density of the particles was 1.56 g cm−3. It should be noted that this concentration defines the density of the slurry where higher concentration provides higher density and requires more energy for the suspension. Higher concentrations also cause the distribution of the particles to become uneven [6]. Therefore, a concentration similar to the seabed environment was selected and remained constant throughout the duration of each test.
2.4 Test Apparatus
The modified slurry pot test rig was used for this experimental work. The rig consists of a test chamber and two motors one at the top and the other at the bottom of the test chamber. The upper motor functioned as a miniature tidal turbine rotor with blades and the bottom one worked as a stirrer of slurry. Figure 2 is an image of the test rig in a stationary mode and Fig. 3 illustrates the test chamber showing the inserted test samples and the direction of the slurry movement. This test configuration is useful to investigate the erosion resistance of different materials in rapidly and inexpensively.

Slurry pot test rig

Test chamber
The test blade samples were inserted in different angled slots on a sample holder which acted as the hub of the turbine rotor. The angles of attack range was 0–90° with 15° increment. The four baffle bars are installed in the test chamber. The role of these baffles is to prevent unwanted swirling of the flow due to the rotation of the samples, to maintain axial flow and to minimise centrifuging effect of the fluid inside the test chamber. The bottom blades stir the solution and provide the longitudinal flow and a good mixing of the slurry [7]. Both motors rotate in opposite directions to avoid random motion of the particles, turbulence of the flow and error in the calculation of the impingement velocity [6]. The bottom four blades (stirrers) are pitched at 45° which is the optimal degree to provide good particle mixing in the axial flow in the test chamber as shown in Fig. 3 [8]. The speed of the motors was kept constant and the experimental configuration of the test rig is shown in Fig. 2.
2.5 Test Conditions and Parameters
-
a.
Test temperature: tests were carried out in ambient conditions at room temperature.
-
b.
Impingement angles: 0°, 15°, 30°, 45°, 60°, 75° and 90°.
-
c.
Slurries: NaCl only in water, sand only in water and sand + NaCl in water.
-
d.
Salinity (wt%): 3.5.
-
e.
Sand concentration (wt%): 3.
-
f.
Test duration: 2 h.
-
g.
Sand particles average size (µm): fine sand (200 ± 50) and medium sand (375 ± 125).
-
h.
Washed and graded sand of sub angular to rounded grain.
-
i.
Linear tip speed (m s−1): 3.
2.6 Test Methodology
In order to measure the effects of the angles of attack on marine tidal turbine blades, the samples were tested at seven different angles in various slurries. The samples were weighed before and after the tests carried out using an analytical balance with an accuracy of 0.01 mg to the nearest 0.0001 g. The orientation of the angles of the test specimens was considered as the angles of impingement of the solid particles to the test specimens [8]. As recommended by Tsai et al. [9], lower rotational speed of the specimens was employed to avoid the presence of vortices, which may affect the test results from a slurry pot tester. This was empirically tested using a high speed camera and large polymer particles. At a tip speed of 3 m s−1, the flow of solution was completely following the directions that are shown in Fig. 2. This tip speed was constantly probed and the motor power was adjusted accordingly to provide a constant velocity for all the combinations of slurry and angle of attack. Moreover, the trajectory of the particles was confirmed using the high speed camera, which was following the flow direction of the solution.
In this type of test configuration, uniform distribution of the sand particles is very important which is controlled by the speed of the stirrer (bottom motor). Although it may be thought that the higher speed of the stirrer can provide a better suspension, this may cause a turbulent flow and the presence of vortices [6]. Therefore, the speed of the stirrer was optimised for the full suspension of the particles and kept constant for the whole series of the experiments. The optimised speed of the stirrer was 309 rpm which was equal to 11 Hz of the bottom motor output. The test chamber was completely filled with the solutions to eliminate the presence of bubbles from the residual air in the chamber, and to avoid their disturbance. The solutions that contained sand were replaced every half an hour to minimise the attrition of the sand particles. The attrition of the sand particles after half an hour test run was found to be 2.59 wt% on average.
The duration for each test was 2 h in accordance with those reported in the literature, in order to keep the comparability of the results consistent. After completing each test, the samples were dried and kept under a gentle heat for 15 min. The mass change measurements were carried out the day after the tests to minimise the errors from water absorption by keeping the specimens at room temperature.
3 Results
3.1 Mass Variation
Figure 4a shows that from the tests in NaCl solution, specimens have gained mass (negative mass loss) for the range of angles of attack. On the other hand, for sand size (200 ± 50 μm) in water, and NaCl water solution slurries, there is mass loss of the specimens for almost all of the combination of slurries and angles of attack. The mass loss is prominent for the tests carried out with sand size (200 ± 50 μm) + NaCl solution slurries. Figure 4b shows the results of tests carried out with sand size (375 ± 125 μm) in the same slurries that of Fig. 4a. A similar trend of mass loss is found for sand size (375 ± 125 μm) in water slurries and sand size (375 ± 125 μm) + NaCl water slurries.

Mass change as a function of impact angle: a NaCl water, sand size (200 ± 50 μm) in water, and in NaCl water slurry and b NaCl water, sand size (375 ± 125 μm) in water slurry and sand size (375 ± 125 μm) in NaCl water slurry
As shown in Fig. 4, as compared with sand size (200 ± 50 μm) in water slurry, a greater mass loss of the specimens is found for sand size (375 ± 125 μm) in water slurry. Moreover, the mass loss due to erosion has increased with the increase in size of sand particles. The presence of the salt in slurries is affecting erosion behaviour of specimens. Higher mass gain occurs in the salt solution and comparatively higher mass loss occurs for all slurries in the lower impact angles up to 30°.
3.2 SEM Micrographs of Targeted Surfaces in Different Slurries
Figures 5 and 6a–d show the SEM micrograph of the specimen tested in distilled water and salty solution at angle of attack 60°, respectively. Figure 5 shows that there is no chemical interaction of distilled water with the specimen. In contrast, the NaCl solution interacted with the targeted surface in a different way. Figure 6 shows the pores have retained NaCl crystals which seems to be dried on the surface. At a higher magnification, it can be seen that any defects on the surface can increase the amount of the accumulated salt on the surface (Fig. 6a, b, e, f). As the glass cloth fibres were woven in 0° and 90° directions, the top layer of the glass fibres in one direction was closer to the surface and caused some imperfection on the surface. The presence of NaCl in water interacting with the composite surface appeared to have de-bonded the matrix and reinforcement, which results in an exposure of the reinforcement fibres along with particles of extruded material on the surface (Fig. 6c, d).

Sample surface after a test in distilled water at 60° angle of attack

Sample surface after a test in NaCl solution at 60° angle of attack a site 1, b site 2, c site 3, d site 4, e EDX analysis of site of (a) and EDX analysis of site of (b)
Figure 9 shows the eroded surface of the specimen for test carried out in sand size (375 ± 125 μm) in water slurry at angle of attack 15°, where erosive wear is evident by the cutting action of solid particles. In the sand size (375 ± 125 μm) and NaCl water solution, the erosion mechanisms are different from those observed for the sand in water only slurry (Fig. 10). At lower magnification, Fig. 10a shows the cutting action of the targeted surface, where impingement of the solid particles and blistering occurs due to diffusion of NaCl water into the specimen surface. In the higher magnification images, the typical effects of the slurry erosion on the exposed surface, i.e. cutting of matrix lead to pits formation and exposure of reinforcement fibres (Fig. 10b), pits and platelet formation (Fig. 10c) [10] and propagation of pits due to matrix cutting (Fig. 10d) can be seen.
For sand in water only slurry, at impact angle of 45°, matrix cutting and impact wear by solid particles occurred (Fig. 11). For the sand + NaCl solution at this impingement angle, more interaction of salt and sand with targeted surface can be seen (Fig. 12). At this angle, the enhanced damage of the exposed surface in the sand + NaCl slurry occurred by a range of erosion mechanisms. Figure 12a–c show the erosive wear and due to impact and matrix cutting by abrasive particles, which led to pits formations, surface damages, cracks initiations, exposure of reinforcement fibres, formation of fibres fragments, etc. Figure 12d shows that the targeted surface has been swollen due to salt, and reinforcement fracture is occurring due to impingement of erodent in the slurry.
Similar to the other angles of attack in sand and water slurry, no interaction of the slurry with targeted surface can be seen at 60° and impact wear is more prominent (Fig. 13), but for sand size (375 ± 125 μm) in the NaCl water slurry at 60° angle of attack, the targeted surface shows de-bonding of matrix and reinforcement fibre, exposure and fracture reinforcement fibre, pit formation, and formation of platelet and flakes (Fig. 14). A similar interaction of the NaCl solution with the specimen surface is evident in Fig. 6.
Due to the glassy nature of the G10 epoxy glass laminate surface, the platelet formation in the composite materials may be observed as flaking. It also can be seen that in the areas where the fibres are closer to the surface, the susceptibility to erosion is increased as the fibres are exposed. In real devices, this may present some issues due to the simultaneous presence of structural loads on the blades which may result in the damage of the reinforcement [4].
4 Discussion
In the marine environment, the wear of the tidal turbine blades occurs by the impingement of solid particles and by cavitation erosion. In this work, erosion in seawater sand slurries is limited to seawater synergistic effects and erosion due to the solid particles impingement. Although cavitation can be another cause of erosion, it was not taken into account at this stage as the experimental conditions (the blade tip speed and the environment pressure were not suitable for reaching a vapour pressure range and the formation of bubbles which lead to cavitation, for the sea water is above 2 kPa [2, 11]). The velocity difference from the root to the tip of the blades is beyond the scope of this paper. In this experimental work, the erodent particles were assumed to be stationery and tip speed was considered to be the velocity of impingement [12].
Figure 4 shows that specimens have gained mass for the tests carried out in NaCl solution, which is prominent at angle of attack up to 45°. Despite the fact that the G10 epoxy glass laminate is recognised for good adhesion between its components and low porosity, the NaCl solution enters into the material by a diffusion process and through pores in the matrix and can increase the mass gain following exposure. The retained salt solution can be seen on SEM micrograph of the tested surface exposed to NaCl only solution (Fig. 6a–c). Mass gain is an important factor that characterises the performance change of material in the whole degradation process. The degradation process includes physical as well as chemical process. It can be envisaged that initially the moisture penetrates rapidly into the void content in the matrix and fibre–matrix interface. This facilitates the interaction of the solution with the composite material, causing de-bonding of the composite matrix and reinforcement fibre, thus reducing the adhesion between resin and reinforcement, and ultimately exposing the reinforcement fibres (Fig. 6c).
On the other hand, the material is extracted from the specimens into the NaCl solution and sand in salt solution slurry as a result of de-bonding at the fibre–matrix interface, which would cause the mass loss of the specimens. Hence the mass change of the specimens would be the net effect of the both i.e. total mass gained minus mass is extracted. Moreover, a similar behaviour of mass gain and chemical interaction was found when the tests were carried out in sand + salt slurry (Figs. 10a, 12b, 14a). These observations are in agreement with the research work found in the literature [13–16]. No chemical interaction between slurry and composite can be seen when the tests were carried out in distilled water with and without particles (Figs. 5, 9, 11, 13).
For the sand only and sand + NaCl water solutions, mass loss occurred for the both sand size (200 ± 50 μm) and sand size (375 ± 125 μm). As shown in Fig. 4, the mass loss has increased with an increase in particles size. This is in good agreement with research work found in literature as the rate of erosion increases with the increase of particles size, hardness and angularity; however, in higher solid particle concentrations, this increase may not predominate as the kinetic energy of the particles is dissipated partly due to the particle–particle collisions, due to the blanketing effect and to the decrease in particle rotation [9, 17].
Furthermore, the results in Fig. 4 show that the erosion rates are higher at the lower impact angles. This is a behaviour that is normally observed for so-called “ductile erosion” patterns. From the literature, the erosion rate of ductile metals typically peaks at a particle impingement angle 30–50° due to a localised plastic strain which leads to the failure of the deformed material (results which are observed for the impact with angular particles). For brittle materials, a peak in the erosion is normally observed at 90° angle of attack, and wear occurs in a form of cracking and chipping of the surface on the micro-scale [18]. Hutchings [19] has suggested that the material loss is observed when a critical fracture strain is reached. It is also stated that the formation and fracture of platelets control the erosion rate [11, 20]. The peaks of the erosion rate in the current work are observed at different angles of attack up to 60° which does not completely describe ductile material behaviour. Moreover, the fluctuation in erosive wear peaks can be attributed to the different slurries, angles of attack, particles characteristics and material as composites behave differently than metals (Fig. 4) [21].
4.1 Synergistic Effects
High-performance filaments, such as carbon fibre and glass fibre, are frequently used as the reinforcement of composites. Degradation of composites is unavoidable in marine applications, as it may be corroded after long-term service in a seawater environment. It is believed that one of the obstacles preventing the extensive use of composites is the lack of long-term durability and performance data when serving in this environment. Consequently, it is necessary to understand how the materials behave during long-term applications [22]. In fact, it is observed that seawater can adversely affect mechanical properties of the matrix and fibre–matrix interface integrity.
When composites are exposed to seawater, they absorb the water molecules through diffusion process. This process is typically slow and is largely affected by the equivalent diffusion coefficient of the composite material, which strongly depends on the type of reinforcing fibre (glass vs. carbon), type of resin (epoxy vs. vinyl ester), type of sizing, lay-ups implemented and manufacturing process. The moisture absorption in polymeric composites leads to deleterious effects associated with de-bonding at fibre–matrix interface and chemical reaction (corrosion), resulting in deterioration in long-term durability and degradation of mechanical properties [13–16, 23, 24].
Similarly the degradation of mechanical properties, when the tests were carried out in NaCl only solution and sand + NaCl solution, the erosive wear resistance of the G10 epoxy glass laminate was also affected in shape of enhanced mass loss, blistering of the laminate, swelling of attacked surface, de-bonding at fibre–matrix interface, and damage of reinforcement and matrix due to fractures, cracks (Figs. 6, 10, 12, 14). Interesting observations can be seen in Fig. 4b for the tests carried out at 60°, where the highest mass loss and erosive wear occurred by cutting process and impact of erodent (Fig. 13), for sand size (375 ± 125 μm) only solution. Contrary to this, the lowest mass loss can be seen for sand size (375 ± 125 μm) + NaCl solution. The intensity of damage of the attacked surface is evidence of synergistic effects of NaCl + sand size (375 ± 125 μm) slurry for this impingement angle, SEM micrograph (Fig. 14). Moreover, at 60° angle of attack, this composite behaves like a semi-brittle material in sand size (375 ± 125 μm) in water slurry (Figs. 13, 15b), while it behaves as semi-ductile material in sand size (375 ± 125 μm) + NaCl solution (Figs. 14, 15b). There is more interaction of the salt solution with this composite at 60° angle of attack (Figs. 6c, 14a). The chemical interaction and transition in composite physical properties are evident of synergistic effects of the salt in slurry (Figs. 5, 14).
Referring to Figs. 4, 6, 10, 12, 14, the trend of mass gain and presence of NaCl on the targeted surfaces of the specimens in the salt in water and sand + NaCl slurry, the pure erosion due to erodent in sand + salt solution can be calculated by adding the mass gain during salt only solution tests to the mass loss of the specimens for respective tests in NaCl + sand solution. Figure 15a, b show that the presence of salt in sand + NaCl slurries has significantly increased the amount of erosive wear. The upwards shifting of pure erosion curves (increase in mass loss) in Fig. 15, and the enhanced degradation of the target surface (Fig. 14) emphasises the deleterious effects of salt solution on the tribological performance of this materials, and the importance of synergistic effects of the NaCl solution and sand.
4.2 Erosion Mechanism Map
The theory of erosion as advanced by Bitter is based on the assumption that, for very elastic material no impact wear occurs, and the highest erosion wear occurs at an angle of attack < 10°; for brittle material erosive wear peaks at 90°. Typical engineering (ductile) materials show intermediate behaviour, and the peak of erosive wear occurs about 30° angle of attack [25]. Zahavi and Schmitt [10] characterised the behaviour of composite materials under solid particles erosion to take place in three stages: (a) local removal of the resin material and exposure of the fibres, (b) breakage of the fibres and formation of cracks perpendicular to the fibres, and (c) further damage due to the degradation of the interfaces between the fibres and the resin. According to Bitter’s erosion theory, which is based on the assumption that for an angle of attack <10°, erosion occurs due to chip formation at micro-scale, as a result of cutting action of erodent. For a 90° angle impact wear occurs, where during a 10–90° angle, both mechanisms contribute to the erosive wear [26].
In view of the tests results, a slurry erosion wear mechanistic map has been developed. Wear mechanistic maps [27–30] can be useful tools to identify various wear mechanisms encountered over the range of tests parameters. This may be helpful in the selection of materials, designing of tidal turbine blades, and defining operational limits. Such maps link the observed experimental wear mechanisms to the actual operational conditions. Figure 16 shows the slurry erosion wear mechanisms map of G10 epoxy glass laminate. The erosion mechanism transition boundaries are approximate and identify wear mechanisms in five regimes which can be described as:
- Regime I:
-
For these combinations of slurries and angles of attack, severe erosive wear occurs due to enhanced mass loss of the specimens (Fig. 4). There is some suggestion that according to the literature [10, 20, 31, 32], composite materials with high reinforcement volume fractions are expected to behave like brittle materials. However, Fig. 15 shows that this composite seems to be exhibiting semi-ductile erosive behaviour in this regime. It is evident from SEM micrographs (Figs. 7, 8, 9, 10, 11, 12) that the wear mechanisms in this region are cutting of the matrix, pit formation, cracking and swelling of matrix material. These figures show that once the outer layer of the surface is cracked, the pits propagate towards the adjacent damage; the material loss rate is accelerated by the cutting action.
Fig. 7 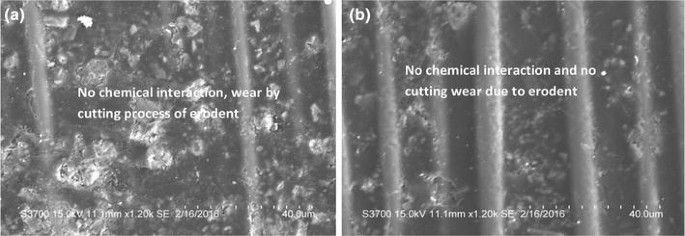
Sample surface after a test in sand size (200 ± 50 μm) in water slurry, a at 15° angle of attack and b at 45° angle of attack
Fig. 8 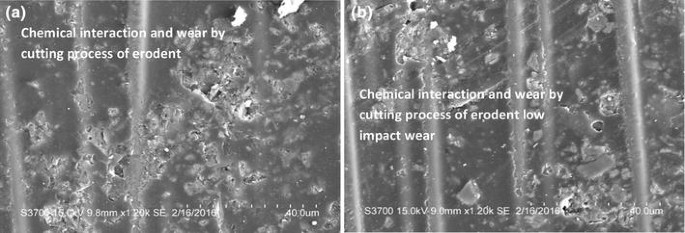
Sample surface following exposure of sand size (200 ± 50 μm) in the NaCl water slurry, a at 15° angle of attack and b at 45° angle of attack
Fig. 9 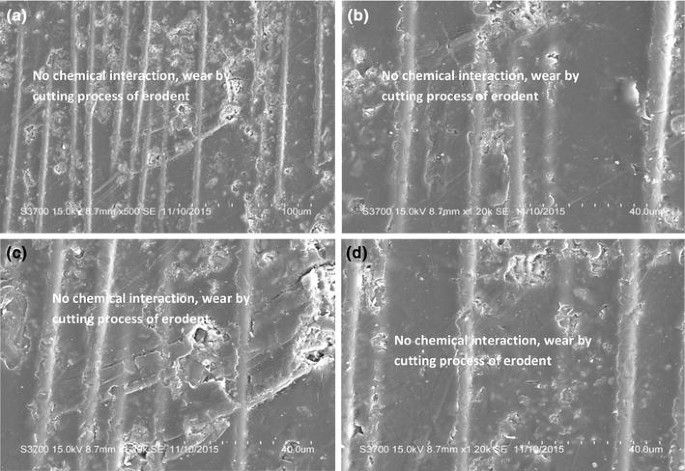
Sample surface after a test in sand size (375 ± 125 μm) in water only at 15° angle of attack a site 1, b site 2, c site 3 and d site 4
Fig. 10 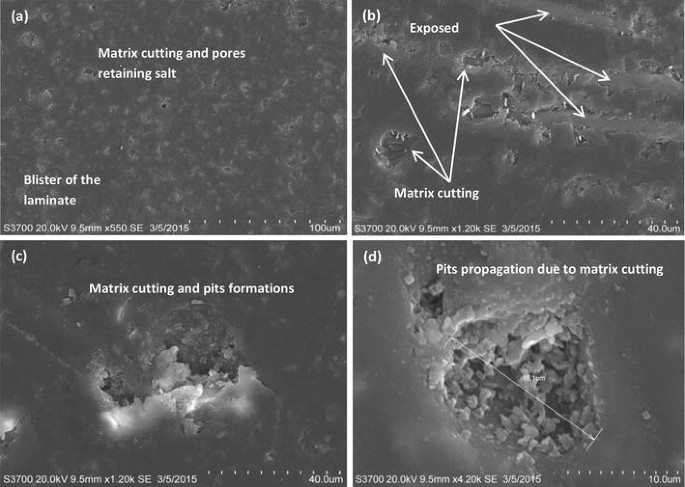
Sample surface after a test in sand size (375 ± 125 μm) + NaCl solution at 15° angle of attack a site 1, b site 2, c site 3 and d site 4
Fig. 11 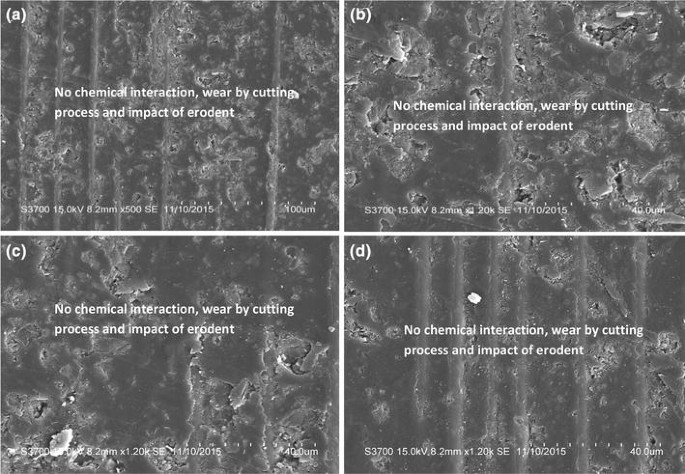
Sample surface after a test in sand size (375 ± 125 μm) in water at 45° angle of attack a site 1, b site 2, c site 3 and d site 4
Fig. 12 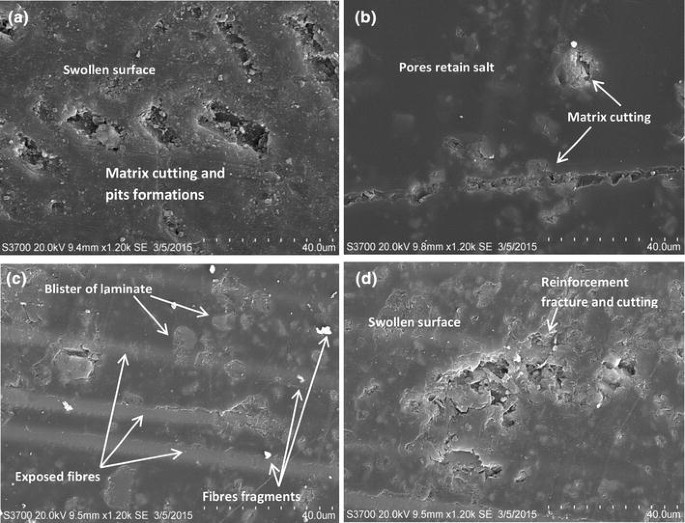
Sample surface after a test in sand size (375 ± 125 μm) + NaCl solution at 45° angle of attack a site 1, b site 2, c site 3 and d site 4
- Regime II:
-
This area shows the erosive wear due to the smaller particles. The wear rate is lower for these combinations of slurry and angle of attack. The composite behaves like a ductile material and the wear occurred due to micro-cutting action of the erodent (Figs. 13, 14).
Fig. 13 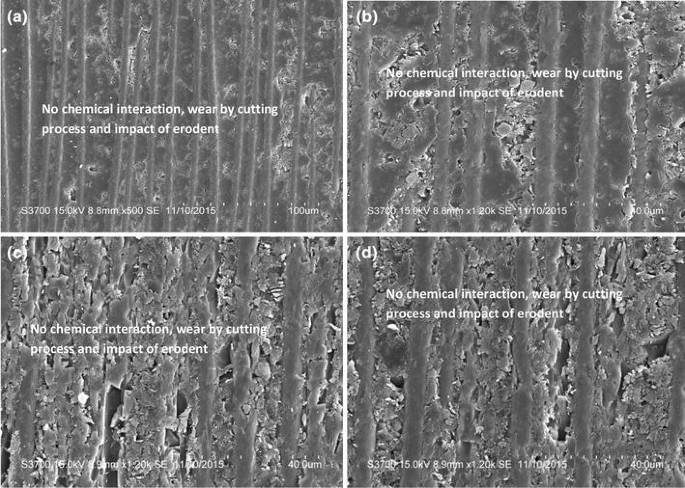
Sample surface after a test in sand size (375 ± 125 μm) in water at 60° angle of attack a site 1, b site 2, c site 3 and d site 4
Fig. 14 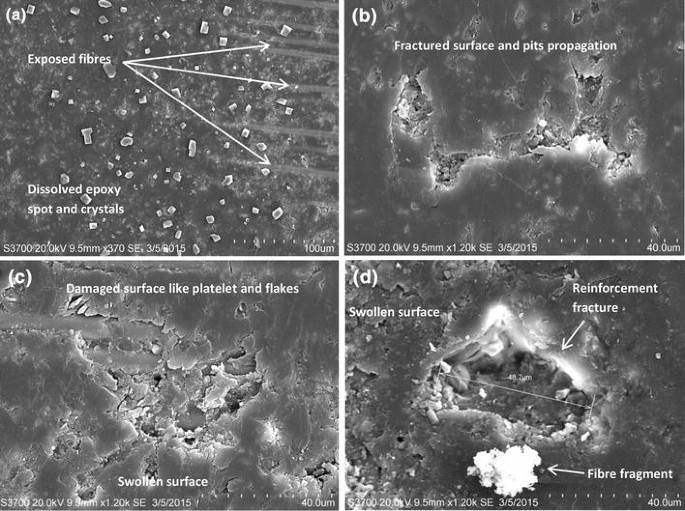
Sample surface following exposure to sand size (375 ± 125 μm) + NaCl solution at 60° angle of attack a site 1, b site 2, c site 3 and d site 4
- Regime III:
-
This region of the mechanistic map is related to the highest surface damage due to the impact of erodent and synergistic effects of salt in the solution. There is a lower mass loss (Figs. 4, 15), due to softening of the reinforcement resulting from sand + NaCl slurry synergy as mentioned above under Sect. 4.1. Erosive wear by impact of erodent dominates. Impact damage can cause a reduction in strength of the composite as much as 40 % [33]. Voids and pores between layers can also pose serious problems to the integrity of the polymer matrix composite (PMC) [34]. Due to the synergy of sand + NaCl slurry, different types of erosion mechanisms are identified i.e. de-bonding at fibre–matrix interface and exposed reinforcement fibres, pit formation, fibre fracture, platelet and flake formation, delamination and swelling of surface (Fig. 14). These erosive wear mechanisms are in agreement with those found in literature [10, 18, 26, 35] (Fig. 16).
Fig. 15 
Synergistic effects, a due to sand size (200 ± 50 μm) + NaCl slurry and b due to sand size (375 ± 125 μm) + NaCl slurry
Fig. 16 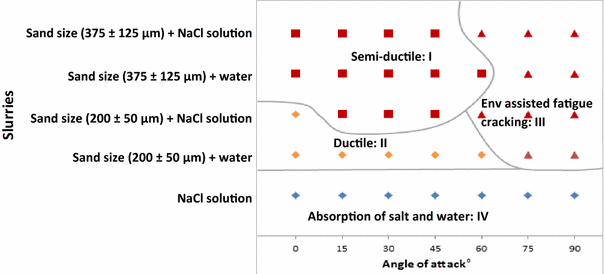
Erosion mechanism map
- Regime IV:
-
This area shows the effects of NaCl solution only on this composite material. The NaCl solution is absorbed and there is mass gain of the specimens. The NaCl interacts with the resin resulting in de-bonding at fibre–matrix interface and exposure of reinforcement fibres (Figs. 4, 6).


In view of these experimental observations together with research in the literature regarding erosive wear of similar composite materials in marine environment, the use of the G10 epoxy glass laminate in these environments presents some materials issues. As a sustainable technology, the marine renewable energy (MRE) sector must ensure that repair operations are minimized. Ideally MRE devices require no intervention for repair and maintenance over the complete device life cycle [16]. Therefore, using surface coating or gel coats for such materials can enhance the quality of performance and the life span of such materials. Further work will involve assessing the performance of different coatings based on gel, silicone, rubber or hybrid formulations, in addition to variation of reinforcement architecture and volume fraction, in order to optimise the composite for use in marine environments involving tidal turbines.
5 Conclusions
-
1.
GFRP (for tidal turbine applications) exposed to an NaCl aqueous solution has shown enhancement of the erosion rate compared with exposure to distilled water.
-
2.
The presence of salt in the solution enhances the erosive wear.
-
3.
Erosion mass loss tends to be higher at lower impact angles indicative of semi-ductile erosion behaviour. However, changes in the mechanisms were observed at higher impact angles.
-
4.
Erosion mechanistic maps have been generated to identify transitions in erosion modes as a function of the aqueous slurry environments. Such maps have potential applications to tidal turbines.
References
IEA-RETD (2011) Offshore renewable energy: accelerating the deployment of offshore wind, tidal, and wave technologies. Routledge, London, p 328
http://www.smartgrids.eu/documents/New-ERA-for-Electricity-in-Europe.pdf
Grogan DM, Leen SB, Kennedy CR, Ó Brádaigh CM (2013) Design of composite tidal turbine blades. Renew Energy 57:151–162
Goundar JN, Ahmed MR (2013) Design of a horizontal axis tidal current turbine. Appl Energy 111:161–174
Blau P, Divakar R (1992) Wear testing of advanced materials. American Society for Testing and Materials, Philadelphia, p 170
Gadhikar AA, Sharma A, Goel DB, Sharma CP (2011) Fabrication and testing of slurry pot erosion tester. Trans Indian Inst Met 64(4–5):493–500
Abouel-Kasem A, Abd-elrhman YM, Emara KM, Ahmed SM (2010) design and performance of slurry erosion tester. J Tribol 132(2):021601
Desale GR, Gandhi BK, Jain SC (2005) Improvement in the design of a pot tester to simulate erosion wear due to solid–liquid mixture. Wear 259(1–6):196–202
Tsai W, Humphrey JAC, Cornet I, Levy AV (1981) Experimental measurement of accelerated erosion in a slurry pot tester. Wear 68(3):289–303
Zahavi J, Schmitt GF (1981) Solid particle erosion of reinforced composite materials. Wear 71(2):179–190
Amarendra HJ, Chaudhari GP, Nath SK (2012) Synergy of cavitation and slurry erosion in the slurry pot tester. Wear 290–291:25–31
Wong KK, Clark HM (1993) A model of particle velocities and trajectories in a slurry pot erosion tester. Wear 160(1):95–104
Huang G (2009) Behaviors of glass fiber/unsaturated polyester composites under seawater environment. Mater Des 30:1337–1340
Mille D, Mandell JF, Samborsky DD, Hernandez-Sanchez BA, Todd Griffith D (2012) Performance of composite materials subjected to salt water environments, 2012 AIAA SDM Wind Energy Session
Wei B, Cao H, Song S (2011) Degradation of basalt and glass fibre/epoxy resin composites in seawater. Corros Sci 53:426–431
Davies P, Rajapakse YDS (2014) Durability of composite in marine environment, vol 208. Springer, Dordrecht
Lindgren M, Perolainen J (2014) Slurry pot investigation of the influence of erodent characteristics on the erosion resistance of austenitic and duplex stainless steel grades. Wear 319(1–2):38–48
Levy AV (1995) Solid particle erosion and erosion–corrosion of materials. ASM International, Novelty, p 220
Hutchings IM (1991) Abrasive and erosive wear of metal-matrix composites. In: Proceedings of the 2nd European conference on advanced materials and processes, Euromat ‘91, 1991-7-22 to 1991-7-24
Tilly GP, Sage W (1970) The interaction of particle and material behaviour in erosion processes. Wear 16(6):447–465
Jana BD, Stack MM (2011) A note on threshold velocity criteria for modelling the solid particle erosion of WC/Co MMCs. Wear 270(7–8):439–445
Shan Y, Liao K (2011) Environmetal fatigue of unidirectional glass–carbon fibre reinforced hybrid composite. Compos Part B 32:355–363
Kootsookos A, Mouritz AP (2004) Seawater durability of glass– and carbon–polymer composites. Compos Sci Technol 64(10–11):1503–1511
Siriruk A, Penumadu D, Weitsman YJ (2009) Effect of sea environment on interfacial delamination behavior of polymeric sandwich structures. Compos Sci Technol 69(6):821–828
Bitter JG (1963) A study of erosion phenomena. Wear 6:169–190
Mens JWM, de Gee AWJ (1986) Erosion in seawater slurries. Tribol Int 19(2):59–64
Ashby MF, Lim SC (1990) Wear-mechanism maps, Scripta Metallurgica et Materialia 24(5):805–810
Rasool G, Mridha S, Stack MM (2015) Mapping wear mechanisms for TiC/Ti composite coatings. J Wear 328–329:498–508
Hayes A, Sharifi S, Stack MM (2015) Micro-abrasion-corrosion maps of 316L stainless steel in artificial saliva. J Bio Tribo Corros. doi:10.1007/s40735-015-0015-y
Sadiq K, Stack M, Black RA (2015) Wear mapping of CoCrMo alloy in simulated bio-tribocorrosion conditions of a hip prosthesis bearing in calf serum solution. Mater Sci Eng C Mater Biol Appl 49:452–462
Pool KV, Dharan CKH, Finnie I (1986) Erosive wear of composite materials. Wear 107(1):1–12
Roy M, Vishwanathan B, Sundararajan G (1994) The solid particle erosion of polymer matrix composites. Wear 171(1–2):149–161
New structural materials technologies: opportunities for the use of advanced ceramics and composites. DIANE Publishing
Advance material by design, Chapter 3, polymer matrix composite. DIANE Publishing
Rajahram SS, Harvey TJ, Wood RJK (2011) Electrochemical investigation of erosion–corrosion using a slurry pot erosion tester. Tribol Int 44(3):232–240
Acknowledgments
The authors would like to acknowledge the support of the EPSRC Supergen Grand Challenges Grant No. EP/K013319/1, “Reducing the Costs of Marine Renewables via Advanced Structural Materials (ReC-ASM)” and thank The Advanced Materials Group in Newcastle University for providing the test samples.
Author information
Authors and Affiliations
Corresponding author
Appendix
Rights and permissions
Open Access This article is distributed under the terms of the Creative Commons Attribution 4.0 International License (http://creativecommons.org/licenses/by/4.0/), which permits unrestricted use, distribution, and reproduction in any medium, provided you give appropriate credit to the original author(s) and the source, provide a link to the Creative Commons license, and indicate if changes were made.
About this article

Cite this article
Rasool, G., Sharifi, S., Johnstone, C. et al. Mapping Synergy of Erosion Mechanisms of Tidal Turbine Composite Materials in Sea Water Conditions. J Bio Tribo Corros 2, 13 (2016). https://doi.org/10.1007/s40735-016-0040-5
Received:
Revised:
Accepted:
Published:
DOI: https://doi.org/10.1007/s40735-016-0040-5