
Abstract
Designing and constructing pedagogical tests that contain items (i.e. questions) which measure various types of skills for different levels of students equitably is a challenging task. Teachers and item writers alike need to ensure that the quality of assessment materials is consistent, if student evaluations are to be objective and effective. Assessment quality and validity are therefore heavily reliant on the quality of the items included in the test. Moreover, the notion of difficulty is an essential factor that can determine the overall quality of the items and the resulting tests.Thus, item difficulty prediction is extremely important in any pedagogical learning environment. Although difficulty is traditionally estimated either by experts or through pre-testing, such methods are criticised for being costly, time-consuming, subjective and difficult to scale, and consequently, the use of automatic approaches as proxies for these traditional methods is gaining more and more traction. In this paper, we provide a comprehensive and systematic review of methods for the priori prediction of question difficulty. The aims of this review are to: 1) provide an overview of the research community regarding the publication landscape; 2) explore the use of automatic, text-based prediction models; 3) summarise influential difficulty features; and 4) examine the performance of the prediction models. Supervised machine learning prediction models were found to be mostly used to overcome the limitations of traditional item calibration methods. Moreover, linguistic features were found to play a major role in the determination of item difficulty levels, and several syntactic and semantic features were explored by researchers in this area to explain the difficulty of pedagogical assessments. Based on these findings, a number of challenges to the item difficulty prediction community are posed, including the need for a publicly available repository of standardised data-sets and further investigation into alternative feature elicitation and prediction models.
Introduction
The pedagogical assessment of students is a fundamental component of any educational or learning environment. Assessments should reflect the teaching objectives and measure the student’s level of knowledge or skill against some defined level of attainment required for them to pass a course. Thus, designing and constructing tests that contain items (i.e. questions)Footnote 1 which measure the various types of skills of different levels of students in an equitable way is a challenging task. Teachers and item writers alike must ensure the consistent quality of assessment materials and maintain fairness if they are to provide an objective and effective evaluation of the assessed students. As the quality and validity of an assessment are heavily reliant on the quality of its items, significant effort and resources have been devoted to item analysis tasks over recent years.
The notion of difficulty is an essential factor that can determine the overall quality of items and tests. In particular, item difficulty estimation—also referred to as “item calibration”—refers to the estimation of the skill or knowledge level needed by students to answer an item or question (Franzen, 2011). Item difficulty predictive modelling is therefore an interdisciplinary field that encompasses psychometrics, educational psychology, linguistics and more recently, artificial intelligence (AI). The former of these three fields provides well-established theoretical frameworks of cognitive processes involved in assessments, which can then be represented, characterised and evaluated using a variety of powerful data-driven computational models available in AI. Automating the process of item calibration is crucial if it is to become more objective and scalable; essential qualities when being included in traditional paper-based testing instruments and intelligent learning environments such as Computerised Adaptive Testing (CAT), Intelligent Tutoring Systems (ITSs) and Automatic Question Generators (AQG). In adaptive testing, the a priori estimation of difficulty should be determined in order to present test-takers with questions that are designed to evaluate the student at the appropriate knowledge level with respect to difficulty, in a process known as item sequencing (i.e. the process of tailoring the order of questions according to the student’s knowledge level). Difficulty estimation can also help to understand the current knowledge level of students, which can be used to build and tailor the appropriate student modeling components in ITSs. Furthermore, difficulty prediction models can be used to evaluate automatically generated questions, which are typically constructed in massive numbers, to: 1) detect non-functional questions (i.e. questions of an inappropriate level of difficulty, such as being either too easy or too difficult); 2) eliminate implausible distractors; or 3) generate difficulty-aware questions (Gao et al., 2018; Yeung et al., 2019). With regard to paper-based examinations, the development of an innovative means to predict difficulty can facilitate objective, cost-effective item calibration for item writers and standardised test organisations alike.
Traditional methods for obtaining an a priori estimation of difficulty have primarily relied on two methods (Choi & Moon, 2020; Rust & Golombok, 2014): i) pre-testing; and ii) the use of experts’ judgement. However, such approaches are frequently criticised in the literature for being costly, time-consuming, subjective and difficult to scale (Benedetto et al., 2020b; Hsu et al., 2018; Loukina et al., 2016). More recently, a variety of alternative methods have been considered as a means to overcome these limitations, including data-driven approaches that rely on the generation of a symbolic or sub-symbolic predictive model. Thus, there has been a clear distinction between earlier studies that utilised human-based methods based on experts’ perceptions of difficulty or educational taxonomy (i.e. expert-driven) approaches, and the emergence of a more recent trend corresponding to the use of machine-driven approaches, where statistical and data-driven models have been employed in an attempt to automate the process of difficulty estimation. In this paper, we introduce a classification that distinguishes and characterises these two approaches to item difficulty prediction, as illustrated in Fig. 1.

A taxonomic decomposition of item difficulty prediction approaches
Essentially, expert-driven approaches are those that are based on establishing an expert consensus that exploits their domain knowledge and experience and uncovers meaningful information from the data (Ling et al., 2008). These approaches are qualitative in nature and mostly rely on pre-defined features of difficulty found in educational taxonomies, or difficulty perceptions of educational experts. This contrasts with automatic techniques for extracting new information from the data (i.e. machine-driven approaches) which focus on quantifying the concept of difficulty by employing statistical or data-driven prediction models to enhance scalability and minimise human intervention. Although these methods might not necessarily reflect an objective reality, automatic difficulty prediction frameworks provide a mechanism by which an estimation will be consistent, as a result of exploiting an algorithmic process. This is especially true when compared to heuristic approaches (such as experts’ judgments) which have been proven to be highly inconsistent as a means of item calibration (Conejo et al., 2014; Pérez et al., 2012).
As a further attempt to minimise the effect of external sources of difficulty that can increase subjectivity, we focus on difficulty sources that are intrinsic to the questions (i.e. text-based). In other words, we do not consider models that base their estimation on external factors such as the learners’ level of knowledge or their performance. Despite being undeniably important factors that can affect difficulty, providing objective criteria to measure such sources is very challenging. The fundamental rationale behind this study is therefore to explore the use of automatic methods that perform a priori question difficulty estimation of textual questions, and in particular, to understand the potential of differentArtificial Intelligence methods (i.e. Machine Learning and Natural Language Processing (NLP)) to model the task of item difficulty prediction at a linguistic level.
To understand both the opportunities and challenges for research into item difficulty prediction, a systematic and comprehensive overview has been conducted that investigates how different automatic approaches have been implemented, as well as characterising their individual merits and weaknesses. The findings of this review should accommodate future advances in an emerging field that is still developing rapidly. The characterisation of this interdisciplinary research area should also provide researchers in this, and other related areas, with a comprehensive reference of a variety of automatic difficulty prediction approaches that can be used to inform decisions about current knowledge gaps, limitations and concerns, as well as to suggest directions for future research. Indeed, the interdisciplinarity of the subject brings together a variety of methods and techniques that are employed from different fields to address a common task from different perspectives. Furthermore, synthesising the different approaches employed in the studies surveyed here should help enhance the quality and comparability of future research by highlighting both the commonalities and differences between these studies.
The primary aim of this review is therefore to provide a comprehensive overview of the current automatic predictive models of item difficulty, through the investigation of the ways that certain item features can affect their inherent difficulty level, as well as exploring the ways in which computational models are currently used to predict difficulty in an automated manner. Thus, the systematic review addresses the following objectives:
-
1.
Provide an overview of the field of automatic approaches to text-based item difficulty prediction with regard to the following statistics:
-
Rate of publication ("Publication Trends" section)
-
Publication venues ("Publication Trends" section)
-
-
2.
Characterise the automatic approaches currently applied to question difficulty prediction, by addressing the following questions:
-
What tasks are involved in the difficulty prediction models? ("Key Tasks for Predicting Item Difficulty" section)
-
What are the most common data-driven approaches? ("Key Tasks for Predicting Item Difficulty" section)
-
What are the most investigated domains? ("Domains and Item Types" section)
-
What are the most investigated item types? ("Domains and Item Types" section)
-
-
3.
Summarise different types of features that were found to influence question difficulty:
-
What are the most common features used? ("Linguistic Difficulty Features" section)
-
What type of features are typically extracted from items? ("Linguistic Difficulty Features" section)
-
-
4.
Examine the performance of automatic difficulty prediction models:
-
What are the types of evaluation methods? ("Evaluation Approaches for Item Difficulty Prediction" section)
-
What types of metrics, measurements are considered? ("Evaluation Metrics" section)
-
-
5.
Identify the challenges involved in developing a comparative study:
-
What are the sources of data-sets being used? ("Evaluation Approaches for Item Difficulty Prediction" section)
-
How do difficulty prediction models perform? ("Comparative Performance of Prediction Models" section)
-
The systematic review methodology adopted by this study is presented in the "Review Methodology / Protocol" section, and the findings, structured using the set of objectives listed above are then presented in the "Findings from the Systematic Review" section. A reflection based on these findings appears in the "Discussion and Future Challenges" section, where we discuss challenges and opportunities for future work, and we frame our systematic review in the context of studies that also discussed recent approaches to question difficulty estimation from text. Finally, we draw conclusions in the "Conclusion" section.
Review Methodology / Protocol
For this study, a review protocol was developed, based on the guidelines given by Keele (2007), which details the methods that were used to conduct the review. Such a protocol is essential as it reduces subjectivity and bias within the study, as well as facilitating reproducibility. Therefore, our protocol consists of a sequence of stages starting with the development of the review protocol itself, and ending with the reporting of the final outcomes. These stages are characterised in more detail as follows:
-
Search Strategy:
The search process was conducted manually using the following publication archives: IEEE,Footnote 2 ACM Digital Library,Footnote 3 ScienceDirect,Footnote 4 Springer,Footnote 5 and Elsevier.Footnote 6 Furthermore, general-purpose and academic-focused search engines such as Google Search and Google Scholar were also included to identify relevant publications. These archives and search engines were used to identify the first collection of relevant papers (start set). Then, additional publications were included in the search by performing backward and forward snowballingFootnote 7 (Wohlin, 2014); where the reference list of, and the citation to, each paper inthe start set were examined. The citations to the paper being examined are studied using the ‘cited by’ option in Google Scholar. This recursive process was performed for each paper in the start set and the subsequently identified papers.
-
Search Queries:
The field of question difficulty estimation is an interdisciplinary one. Relevant fields such as educational assessment, psychology and computer science all use different, yet synonymous terms to address the same task. Therefore, in order to identify keywords that reflect the most common terminologies mentioned in the previous literature, different combinations of search terms were assembled. The aim here is to maximise the identification of all of the relevant publications, and to address the properties of each database in terms of the available types of operators. As a result, the following combinations of keywords and operators were used: Item difficulty prediction, Item difficulty estimation, Item difficulty modelling, Difficulty modelling, (item OR question) AND difficulty AND (estimation OR prediction OR modelling)
-
Study Selection:
Three phases were followed as part of the study selection process in this review (Fig. 2): Identification, Screening and Eligibility. During the identification stage, 148 papers were identified through screening of the above-mentioned publication archives. Further publications were identified using other sources such as general Google search (4 papers), Google Scholar (22 papers), and snowballing (16 papers). Finally, an additional 13 papers were included based on the suggestions of the anonymous reviewers of this paper. The bibliographic information and abstracts of each publication were initially held in a reference manager. The titles and abstracts were then fully screened to exclude clearly ineligible publications. The screening process excluded a total of 73 papers were excluded on the basis of relevance with respect to the titles (n=44) and abstracts (n=29). For example, during this phase, we excluded papers that performed difficulty prediction of questions in question-answering communities. If any uncertainty was encountered during this phase, inclusivity was prioritised by including the publications for further eligibility assessment. It is only then that the full text of the remaining publications was systematically examined, leaving a total of 55 unique studies for the review itself. An extensive list of inclusion and exclusion criteria (listed below) was utilised to conduct the screening and eligibility phases of this process.
Fig. 2 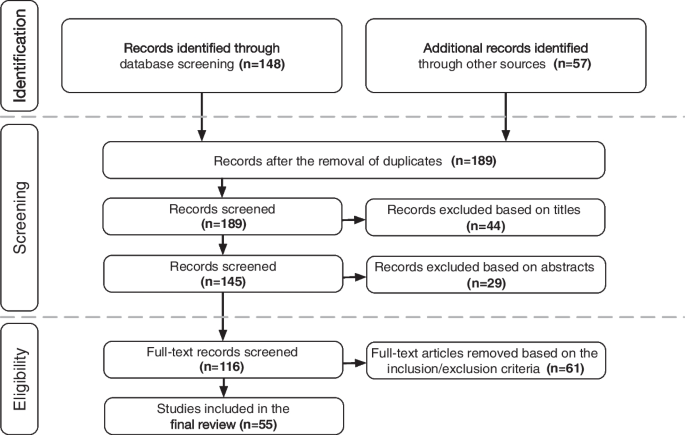
The study selection process
-
Inclusion/exclusion criteria:
All of the publications that were included in the study focus on automatic approaches for difficulty prediction, without imposing any constraints on the publication year, publication type, domain or item type. However, a small number of publications have been excluded where they violate one or more of the following criteria:
-
The publication is not written in English.
-
The full text of the publication is not available.
-
The proposed difficulty model is not evaluated.
-
We exclude publications that predict difficulty based on approaches that are heuristic or that utilise educational taxonomies.
-
The difficulty prediction framework does not employ machine learning or NLP approaches. The rationale here is to focus on the application of AI techniques for the task of difficulty prediction.
-
The publication estimates difficulty after administrating the test. We only focus on methods which offer a priori prediction of difficulty in order to overcome the limitations of traditional prediction methods.
-
The items are not textual (i.e. they contain images, graphs or formulas). We exclude these types of items as they require different analytical techniques compared to those used for textual items.
-
The publication does not address assessment items. For example, we exclude studies that predict the difficulty of questions in question-answering communities such as Stack Overflow,Footnote 8 as this type of question differs completely from assessment questions with respect to their purpose and structure.
-
The difficulty features are not intrinsically extracted from items. By this, we mean that we only focus on difficulty features that are derived from items’ structure, hence, we exclude features which are based on students’ performance (e.g. response time) or, for example, wearable sensors.
-
The publication focuses on item classification based on features other than difficulty. For example, we exclude publications that classify items based on question type.
-
-
Quality Assessment:
The quality assessment process was conducted after reading the full text and filling in a pre-defined data extraction form for each study. A simple scoring technique was used to evaluate the reporting quality, rigour and credibility of the selected studies. All papers were evaluated against a set of 8 quality criteria that were adapted from the quality assessment checklist suggested in Keele (2007). Table 1 describes the quality criteria applied, and the resultsof the quality assessment process are presented in Table 2. Three responses are used for scoring the criteria: yes, no and partially. The last response is used when the criterion is not fully met. Furthermore, a paper is scored ineligible if it received more than 4 “no” responses.
Table 1 Quality assessment criteria Table 2 Quality assessment of publications included in the study using Table 1 criteria (Yes/No/Partially) In what follows, we elaborate on the scoring process that we adhered to when deciding if a paper satisfied a certain criterion.
-
Q1: The first criterion requires the presence of an explicit statement that describes the aims, objectives or research questions of the study.
-
Q2: For a study to score ‘yes’ in this criterion, we check if the authors include important contextual aspects that help the reader to understand the purpose behind developing the difficulty model, for example, the type of assessment that was considered (formative or summative), or the learning environment of which the model was designed for (traditional classroom or an eLearning platform). Another aspect of being more articulate is being explicit about the investigated domain and the type of questions targeted in the study.
-
Q3: This question establishes whether the research questions were answered and explicitly stated in the findings.
-
Q4: Here, we consider the description of the overall approach (i.e. plan) that was followed in the study by the authors to answer the research questions.
-
Q5: In this criterion, we consider the methods and procedures that were used to collect and analyse the data. For instance, we check if the characteristics of the participants are reported in terms of their number, selection process and the reportingof their demographic data.
-
Q6: For a study to score ‘yes’ in this criterion, it must describe the techniques and processes that were used to clean, transform and model the collected data.
-
Q7: This question requires that the evaluation metrics used to measure difficulty and validate the efficiency of the proposed approach are described, defined or presented as mathematical formulas.
-
Q8: Is there a clear statement of findings that relate to the aims of the study? When a study provides a sufficient and comprehensive description of the findings of the study, it receives a score of ‘yes’ in this criterion, otherwise a score of ‘no’ is given.
-
-
Data Extraction:
A specific form was designed for the data extraction process which was primarily directed by the objectives of this review. The form included: title, year of publication, feature extraction methods, prediction method, domain, item type, number of items, data source, evaluation type, number of participants, observed difficulty measurement, difficulty features, results, publication type, publication venue and quality score. Table 12 in the Appendix summarises the most important data extracted from each of the selected studies.

Findings from the Systematic Review
The following sections present the analysis and synthesis of the findings from the studies surveyed. We structure our discussion around the questions proposed in the "Introduction" section.
Publication Trends
In this section, we provide an overview of the wider research community of question difficulty prediction with regard to publication trends, popular venues and active research groups. These aspects are crucial in understanding how the research area has evolved throughout the years, supported by technological advancements in NLP and other relevant tools.
Regarding the provenance of the different publications, conference proceedings were found to be the most common publication venue for the papers considered in this study (with a total of 28 conference papers, or 53% of the publications in the study), with journals being the next significant venue (16 journal papers, or 30%). Other types of publication venues included workshop papers, technical reports and papers archived in pre-print repositories such as the arXivFootnote 9 open access repository. The most popular publication venues identified in this review are technically (as opposed to pedagogically) oriented due to the fact that the scope of the review specifically focuses on data-driven approaches for item difficulty prediction. More than 70% of the venues published research on technical topics such as Artificial Intelligence (AAAI, IJCAI, ICTAI, AI Review, etc.) and Knowledge Engineering (Journal of Web Semantics, Semantic Web Journal, Journal of Knowledge Engineering, CIKM, KCAP, etc.), or in Computational Linguistics and Information Retrieval (COLING, CICLing, SIGIR, etc.) with several other venues being at the intersection of Pedagogical Research and Technology (IJAIED, AIED, LAK, etc.).
This finding further emphasises the interdisciplinarity of research into question difficulty prediction, in that it is a discipline that combines technical, pedagogical, psychological and linguistic perspectives. This interdisciplinarity is also apparent when examining the provenance of different authors working in this field (i.e. with respect to the departments that authors are affiliated with). We found that the majority of researchers (64%) were affiliated with computer science departments; whereas19% of researchers were affiliated with pedagogically oriented departments such as the departments of education and educational psychology. The remaining authors were positioned in language departments such as linguistics and computational linguistics(17%), as listed in Table 3. A number of research groups (n = 8) have contributed to publishing almost half of the publications (n = 23).
The reason for this could be due to the fact that the field of automatic difficulty prediction is still relatively new, and as such, there is a small number of highly active groups that are responsible for a significant number of the studies.
There have been broadly two waves of research activity (Fig. 3), with the first emerging in the mid-1990s, whereby the use of artificial neural networks appeared in some studies. These techniques -at that time- represented a novel approach for exploring non-linear relationships between item parameters and difficulty. Previous research had tothis point only employed statistical approaches, which explains the relationships in a linear manner (Boldt, 1998; Boldt & Freedle, 1996; Fei et al., 2003; Perkins et al., 1995).

Chronology of the publications across the last 25 years
The second wave of studies started in 2010 as researchers began to explore different data-driven approaches to this problem, such as the use of rule-based expert systems, support vector machines (SVM) and Naïve Bayesian models (Beinborn et al., 2015; Hutzler et al., 2014; Perikos et al., 2011). There was a steep increase in publications between 2013 and 2014 that then plateaued and was broadly stable until near the end of the decade, where there was a slight rise (in particular, during 2017, 2019 and 2020), indicating the growing relevance of the field in the research community. This observed increase could be attributed to the fact that other closely relevant research communities (which incorporate an item difficulty model as a component) were also thriving during these years. One such community was the Automatic Question Generation (AQG) field which was primarily interested in utilising AI approaches to automatically generate questions. According to the most recent review, the number of publications in the field of AQG peaked during the years 2014 to 2018 (Kurdi et al., 2021). In AQG, difficulty prediction is considered an essential evaluation metric to validate the quality and functionality of the generated items. In Faizan and Lohmann (2018); Gao et al. (2018); Khodeir et al. (2018); Seyler et al. (2017), various difficulty estimation frameworks were proposed to generate questions of desirable difficulty levels. Moreover, the possible influence of other related research areas such as Computerised Adaptive Testing (CAT) and Intelligent Tutoring Systems (ITSs) cannot be ruled out. These research areas also attempt to improve adaptivity and personalisation of their systems by incorporating a difficulty estimation model as a crucial component to adapt exercises to the students’ skill/ knowledge level. For example, a bank of difficulty-labelled items was generated in Settles et al. (2020) to be used with a CAT system to ensure that the questions were administered to students in a personalised manner. In contrast, a number of difficulty estimation frameworks were proposed to be implemented within ITSs (Hutzler et al., 2014; Khodeir et al., 2018; Perikos et al., 2016).
Key Tasks for Predicting Item Difficulty
There are four key architectural components that difficulty prediction models usually have in common which represent the following four fundamental tasks: 1) Ground truth labelling, 2) pre-processing, 3) feature extraction and 4) prediction. These components are discussed in more detail in the following sub-sections.
Ground Truth Labelling
The first step in any question difficulty prediction process is to label the ground truth difficulty for each question. Ground truth labels are typically obtained using one of two possible approaches: 1) psychometric testing theories, or 2) manual labeling (see Table 4).
The first approach refers to the use of common psychometric theories; namely Classical Test Theory (CTT) (Hambleton & Jones, 1993) and Item Response Theory (IRT) (Baker & Kim, 2017) to calculate the difficulty score statistically. The proportion correct statistic (CTT) and the Rasch model (IRT) were utilised in 34% and 26% of the studies respectively. These theories enable item writers to predict the test’s outcome by analysing specific parameters related to the items, and the performance of students taking the tests (due to the difficulty of the item itself or the academic ability of the students). In order to define difficulty using psychometric theories, an appropriate dataset consisting of a number of questions with their corresponding student performance results must first be obtained. In this type of labelling, difficulty is defined as a continuous value within a pre-defined range. In the case of CTT, difficulty was calculated using the p-value,Footnote 10 which represents difficulty as a value in the range [0;1]. However, continuous values in various ranges (depending on the study design) were produced using IRT.
In the second approach, domain experts were asked to rate items using a categorical scale representing different difficulty levels based on their experience. Therefore, the difficulty format is presented as discrete values representing the various difficulty levels. Of the papers considered, 34% favoured the use of experts’ opinions to calculate the observed difficulty scores. Despite the possible subjectivity of this approach, it is still considered a good indicator of item quality in general, and in particular, item difficulty.
Other approaches for observed difficulty measurement include psychometric models such as Delta (a model based on CTT) or the use of automatic labeling where question-answering systems are used to label answered questions as “easy and unanswered onesas “difficult. One paper (Felice & Buttery, 2019) used a well-known language standard (i.e. CEFR levels) to indicate ground truth difficulty.
Pre-processing
Various surface-level features have been examined to explore how different syntactic structures of questions affect difficulty. Standard NLP techniques were used to perform basic textual analysis to i) pre-process item text or ii) extract syntactic/lexical features.
The text pre-processing step is therefore fundamental in most NLP-related tasks, and corresponds to the transformation of raw textual data into smaller, more defined components by removing the unnecessary textual elements such as punctuation and adverbs. Item text pre-processing typically includes the use of common NLP techniques such as stemming, lowercasing, stopword removal, chunking, Part of Speech (POS) tagging and lemmatisation (Beinborn et al., 2014; C. Lin et al., 2015; Sano, 2015; Susanti et al., 2017; Xue et al., 2020). Additionally, NLP parsers were used to extract syntactic/lexical features of questions by analysing their constituent words/sentences. For example, the Stanford NLP Parser (Manning et al., 2014) was used by the work of Yaneva et al. (2019) to extract syntactic features such as the count of negation, noun phrases and the average length of sentences and noun phrases, etc., which proved to be amongst the most effective predictors of difficulty.
Feature Extraction
The feature extraction methods that were utilised in the papers featured within this study can be categorised according to the level of understanding required to extract the textual features. There was a crucial distinction between syntactic and semantic levels of understanding. The syntactic level of understanding focuses on surface-level features of the input, such as word count or word length. The extraction of this type of superficial features is fairly simple, as it only requires the use of deterministic tools such as readability and complexity measures or traditional language models such as basic NLP parsers. In contrast, the semantic level is characterised by a deeper level of understanding, and focuses on the semantic representation of the input. State-of-the-art neural language models were used to compute features for this level. In the following subsections, we will discuss the various feature extraction methods that were employed in the studies examined, based onthe level of understating that they target. Table 5 summarises the most common feature extraction methods found in the literature.
Syntax-level Feature Extraction
When investigating sources of difficulty in textual questions, textual complexity plays an important role. The basic intuition here is that more textually complex questions require students to have more advanced language proficiency skills in order to read, understand and answer questions correctly. Determining the linguistic complexity of the question’s string is an intuitive difficulty measure that was utilised in a number of studies and is considered one of the basic tasks in NLP (Benedetto et al., 2020a, 2020b; Susanti et al., 2017; Yaneva et al., 2019). For this purpose, readability measures were commonly used to produce descriptive statistics that quantify how difficult a text (in our case, a question) is to read. The Flesch Reading Ease (Flesch, 1948) and the Flesch-Kincaid readability score (Kincaid et al., 1975) are two sophisticated readability measures that measure surface lexical features such as word length and sentence length; for example, if used within the context of a question, a high score in the Flesch Reading Ease test would indicate that the question is easier to read than one with a low score. Thus, the underlying intuition here is that a question’s readability level correlates with its level of difficulty. Benedetto et al. (2020a) used these readability indexes (in combination with other features) to measure text complexity of questions by counting features such as the number of words and average word length. However, on their own, the readability measures did not perform as well as other linguistic features such as TF-IDF. This result was consistent with the findings reported in Yaneva et al. (2019) which stated that the Flesch readability measures were rather weak predictors of itemdifficulty, demonstrating that easy and difficult questions cannot be distinguished through surface readability metrics. Likewise, Susanti et al. (2017) explored the use of readability indexes to measure the readability of reading passages of English language vocabulary questions, with the aim of examining its relationship with question difficulty. It was found that reading passage difficulty had the least influence on question difficulty.
For the same purpose of measuring the textual complexity of questions, some authors utilised corpus analysis software as a feature extraction method. These software were mainly used by linguists to find certain patterns in text. For example, the WordSmith software package (Scott, 2008) was used in the work by Pandarova et al. (2019) to measure the complexity of reading passages in reading comprehension questions by extracting features such as word length or the number of sentences/ clauses found in a question. A text complexity prediction system named TextEvaluator (Sheehan et al., 2013) was used in the work by Loukina et al. (2016) to generate multiple textual complexity features (e.g. the frequency of academicwords and the frequency of concessive and adversative conjuncts). This fully automated system generates features based on vocabulary lists and various NLP techniques such as tagging and automated parsing.
Term-frequency-inverse document frequency (TF-IDF) is a numerical measure that is commonly used in text mining and information retrieval to count the occurrences of certain words or n-grams to demonstrate how important that word is to a document in a corpus (Salton & McGill, 1986). It was mainly used in the context of item difficulty estimation to extract linguistic features; more specifically, to examine the relationship between difficulty and the important words that appear in the question. In the work by Benedetto et al. (2020b), TF-IDF was used to produce arrays of features from the input text (i.e. question and distractors) which were then used as an input for a regression module that was developed to estimate the difficulty of newly generated multiple choice questions (MCQs). Their model was able to predict difficulty with accuracy (RMSE = 0.807). The authors used the same measure in a following study, in combination with other measures, and were able to improve the accuracy of their model (RMSE = 0.753). In a separate study, Lin et al. (2015) investigated how TF-IDF could be used with RDF graphs (linked data), in contrast to simply being used with textual data. Their proposed hybrid measure called TF-IDF (DL), was used within the feature engineering process to initially transform named graphs into vectors, and subsequently measure the semantic similarity between these vectors using text-based cosine similarity measures. This feature was later used to control the difficulty of questions generated from RDF resources.
Given the simplicity of computing surface-level features, some studies (Hoshino & Nakagawa, 2010; Yaneva et al., 2019, 2020) have utilised publicly available basic NLP parsers to compute simple features (e.g. average sentence lengthand negation count), such as the Stanford NLP parser (Manning et al., 2014).
Semantic-level Feature Extraction
The semantic similarity of different textual elements found within questions (e.g. the stem, distractors, reading passage, etc.) was amongst the most investigated features in the difficulty estimation literature. This level of understanding goes beyond syntactic or lexical features and requires the extraction of semantic representations of the input. Within the field of NLP, semantic similarity is the process of measuring the relationship between texts or documents using a defined metric. To achieve this, textual items must be expressed numerically by transforming them into feature vectors that encode the meaning of words in a way that groups together words that are similar in meaning within the vector space, in a process known as word embedding. Alternatively, structured semantic models such as ontologies can be employed to measure semantic similarity between concepts that are present in the text of the question. In this subsection, we discuss the most common feature extraction methods that were used to extract semantic features. These include ontology-based similarity measures, neural language models (e.g. LSTM), and two types of word embedding: traditional (i.e. static) word embedding and contextualised word embedding. The different types of semantic-based difficulty features used by the studies in this review are discussed further in the “Semantic-based Features” section.
Rich semantic data models such as ontologies have been used to represent and support the extraction of semantic features. Ontologies have been frequently used in a number of recent studies because they provide an effective mechanism for explicitly representing a certain domain of knowledge in the form of concepts, which are connected through semantic relations (i.e. predicates). Therefore, textual mining of ontological components (i.e. concepts, predicates and instances) can help identify semantic sources of difficulty. The work of Alsubait et al. (2013) illustrates how to extract semantic features from ontologies. A similarity-based theory for controlling the difficulty of ontology-based auto-generated MCQs where concept similarity was used to select question distractors. According to their theory, distractors which contain concepts that are semantically similar tothe concept of the key increase the difficulty of MCQs. To illustrate this intuition, for distractors to be semantically similar to the key in an MCQ: 1) they should not have a sub-class relationship with the concept of the stem; and 2) their similarity to the key should exceed a certain threshold.
Recent studies have started to recognise the importance of context in the task of question difficulty prediction (as is the case with most NLP tasks). Thus, in the very recent literature, studies started to focus on context-aware embeddings suchas word2vec, ELMo and BERT. These techniques were utilised as an attempt to overcome the limitations of previous context-agnostic feature extraction models.
Textual analysis of reading comprehension questions was performed by Huang et al. (2017) through the use of word embeddings that were trained on a large-scale corpus using word2vec (Mikolov et al., 2013a, b). This process was carried out to allow the proposed difficulty prediction model to learn the textual features of a question from a semantic perspective. Similarly, word2vec was used by Hsu et al. (2018) to transform textual elements of the question into semantic vectors. The cosine similarity metric was then utilised to calculate the semantic similarity between the text of item elements; such that the semantic similarity was expressed through the distance between the vector representations of words. Word2vec-trained word embeddings were also used by Yaneva et al. (2019) to predict the difficulty of MCQs in high-stakes medical exams, in addition to other linguistic and psycholinguistic features. They demonstrated that word embeddings had the highest predictive power when conducting an ablation study to understand the contribution of each set of features.
Long short-term memory (LSTM) is a deep learning model commonly used in NLP. It is one of the neural language models that utilises the context of the question to improve the accuracy of prediction. It was used by Cheng et al. (2019) as a part of anend-to-end neural network to extract the question semantic structure. Bidirectional LSTM (BiLSTM) was employed by Bi et al. (2021); Qiu et al. (2019) and Gao et al. (2018) to encode the question text into a contextualised representation. For example, a difficulty prediction model for MCQs in medical exams was proposed in Qiu et al. (2019) that leveraged BiLSTM to compute the semantic representations for all question components (stem, options and medical text). After that, two types of difficulties were encoded using two different modules: a confusion difficulty module and a recall difficulty module. The final prediction was thus generated based on the aggregation of these two types of difficulties. The model was then compared to a number of end-to-end difficulty prediction models including SVM + TF-IDF, TACNN (Huang et al., 2017) after applying some changes, and two variants of the same model. It was found that the proposed model significantly outperformed all baselines with all metrics. However, LSTM or BiLSTM are not the best neural language models to capture the true meaning of words based on their context. This is mainly because they learn right-to-left and left-to-right contexts separately. Furthermore, this sequential computation of LSTM significantly increases the time needed for the neural net to learn.
The more recent literature (since 2019) has started experimenting with state-of-the-art contextualised word embedding techniques such as ELMo (Embeddings from Language Model) (Peters et al., 2017) and BERT (Bidirectional Encoder Representations fromTransformers) (Devlin et al., 2018). Unlike traditional word embedding techniques (e.g. word2vec and GLoVe), pre-trained contextual models deal with different prospects of words based on their usage in context. In this sense, they also address some of the limitations of LSTM. The context of the words is captured faster and more accurately since the learning process is conducted from both directions simultaneously. The success of these context-sensitive encoders for many NLP tasks has brought a great deal of interest in how these models can perform on the task of difficulty estimation.
In Xue et al. (2020), a transfer learning-based model using ELMo was proposed with an additional encoding layer based on Bi-LSTM to produce embeddings from the question textual elements (stem and options). The model was pre-trained on the task of response time prediction, to improve the accuracy of difficulty level predictions. It was found that transfer learning was in fact effective and item stem represented the most useful source of difficulty (RMSE = 23.32). In Yaneva et al. (2019, 2020), the authors model three types of difficulty features: 1) embeddings; 2) linguistic features (e.g. lexical and syntactic features); and 3) information retrieval features. They experiment with two types of embeddings, word2vecand ELMo, pre-trained on a task-specific corpus (MEDLINE abstracts).Footnote 11 The linguistic features were extracted using the Stanford NLP parser and readability measures. The combination of all featuresreported the best results (RMSE = 22.45 compared to ZeroR 23.65). As a result of an ablation study that was carried out to examine the effect of each set of features, they found that embeddings (word2ved and ELMo) and linguistic features were the strongest predictors of difficulty with comparable performance.
Other recent papers have started to apply transformer-based models to compute embeddings of the questions’ textual components. The first attempt to use BERT was in the work by Yeung et al. (2019) where the language models’ bi-directional contextual representation was utilised to generate distractors of controlled difficulty. The generation was based on the similarity of the context of the carrier sentence to distractors in a gap-filling MCQ. This was achieved by initially masking the target word (i.e. answer) in each carrier sentence, and then selecting the candidate words that were most highly ranked by BERT for the masked word according to their relative ranking in BERT. This allowed them to measure the semantic similarity of the context ofthe carrier sentence to the generated distractors. The authors compared their model to word embeddings trained by Skipgram (Mikolov et al., 2013a, b) by calculating cosine similarity between the distractor candidates and the answer. The results show that BERT outperforms the semantic similarity baseline in terms of correlation with human judgment.
A multi-task BERT (MTBERT) was used for the task of question difficulty prediction in Zhou & Tao (2020). The pre-trained BERT model was further pre-trained on an additional corpus, to then be fine-tuned for predicting the difficulty of programming problems. The proposed model achieved an accuracy of 67% over two neural network baselines; namely, basic BERT and BiLSTM. Additional pre-training for the transformers was also carried out in Benedetto et al. (2021) while using BERT and DistilBERT to predict the difficulty of MCQs. A dataset covering the same topics that were assessed by the questions was used for additional task-specific training. The transformers were evaluated against two existing models that leveraged TF-IDF (Benedetto et al., 2020b) and ELMo, and were found to produce better performance. In Loginova et al. (2021), the authors explored the possibility of modelling difficulty prediction of MCQs by using the uncertainty of question-answering models as a measure of difficulty. In other words, it was argued that machine-perceived difficulty correlates with human-perceived difficulty. For QA, they experimented with three transformers; namely, BERT, DistilBERT and XLNet, to produce raw softmax scores that were then converted into a unique value, which was subsequently used to represent the difficulty score for the question. This model was evaluated against three ELMo-based baselines targeting different similarity-based features (question and the passage, the answer and distractors and the answer and the passage). It was found that their model performed as well as other baselines, except for the comprehension questions, which were reported to be best predicted by the ELMo-based model.
Prediction
In spite of their diversity, all of the studies we considered had addressed the task of question difficulty estimation as a supervised problem, whereby a dataset containing questions labelled with difficulty levels (i.e. ground truth) was used to train a model to predict the difficulty level of new questions. A smaller number of studies (n = 10) did not necessarily use machine learning to train a prediction model, but rather employed NLP techniques to automatically extract the difficulty features, prior to performing a correlation analysis to compare them to the real (i.e. ground truth) difficulty labels. The overwhelming dominance of supervised learning techniques is likely due to the characteristics of the task itself. First, the majority of studiesconsidered the problem of question difficulty prediction as a multi-class classification task whereby the question can be classified as easy or difficult (i.e. binary classification) or easy, moderate, or difficult (i.e. multi-classification). This problem can be intuitively modeled using supervised learning methods where the categories are pre-defined, and the model is designed to capture them. Second, given the sensitive nature of the type of datasets required in this field (educational questions), the lack of availability of a large training data set hinders the application of unsupervised feature learning methods. Although the use of large training data sets is beneficial for any ML-based framework, supervised learning techniques tend to not require as large a data set as those required by unsupervised learning approaches. Furthermore, due to the inherent subjectivity of difficulty (in that it is often affected by previous knowledge or individual differences), there is high trust and general acceptance in the educational community of the difficulty scores produced by educational experts or calculated based on students’ performance (see “Evaluation Approaches for Item Difficulty Prediction” section). Supervised learning methods allow us to include the human perspective during the feature engineering process which results in models that are better aligned with humans’ perceptions of difficulty.
Input
The main type of input used by the different studies we examined were strings representing the question’s text. Different studies utilised different components of the question as input, depending on the objective of the study. For example, studies that examined the difficulty of MCQs typically extracted the features from the stem, answer, and distractors (Alsubait et al., 2016). The reading passage was typically added in reading comprehension MCQs as an additional source of difficulty (Huang et al., 2017). To process the question text efficiently, most studies transformed the question textual components into a feature vector using an automatic feature extraction method. Only four studies conducted a manual coding of features as the sole feature extraction method (Aryadoust, 2013; Perkins et al., 1995). The choice of manual feature extraction in older studies could be attributed to the simplicity of NLP techniques at the time.
In addition to the question’s textual components, some studies have used other types of textual input such as word lists (Yaneva et al., 2020). For example, Susanti et al. (2017) used JACET8000; a word list containing 8000 words labeled with difficulty levels for Japanese students learning English as a second language. Non-textual inputs were also employed in some studies (n = 7). For example, structured input such as ontologies and knowledge graphs were used as additional input for thepurpose of capturing semantic-level features from the questions (Faizan & Lohmann, 2018; Kurdi et al., 2021; Vinu & Kumar, 2020).
Output
The output of the difficulty models was either a continuous or categorical value depending on the way the task was modeled (i.e. regression or classification). The majority of studies produced continuous difficulty values (67%). The choice ofthe output format was also affected by the way ground truth difficulty was calculated. In models which produced difficulty scores (i.e. continuous values), ground truth labels were calculated using psychometric models such as IRT. Meanwhile, the categorical output was typically produced to be compared to difficulty labels obtained by asking educational experts to rate the difficulty level of questions. The cardinality of the difficulty classifications (categories) typically ranged between 2 (easy/difficult) to 5 (very easy, easy, medium, difficult, very difficult).
Learning Algorithms
Among the different machine learning methods, neural networks were the most commonly used type of supervised learning algorithm used for difficulty estimation (45%). Various types of neural networks were utilised depending on the paper’s objectives, such as Convolutional Neural Networks (CNN), Attention-based Neural Networks or Fully Connected Neural Networks (FCNN). In these studies, difficulty was equally modeled as a regression and a classification task. Neural network-based approaches were applied to various domains such as language, computer science and medicine. They were some of the first data-driven methods used in the item difficulty prediction literature. Perkins et al. (1995) utiliseda three-layer backpropagation ANN to predict the difficulty of reading comprehension items taken from a TOEFL test. The aim was to explore an unconventional approach that could outperform existing statistical approaches. Neural networks were praised for providing the means to explore non-linear relationships between variables, compared to statistical methods which assume a linear one. Moreover, the capabilities of neural networks to self-learn and adapt with minimal error rates are amongst the most frequently cited motivations for utilising neural networks for item prediction in the literature (Aryadoust, 2013; Perkins et al., 1995).
Older studies that leveraged a neural network architecture typically employed surface-level measures to automatically extract features or relied on manual feature extraction. For example, in the works of Aryadoust (2013) and Perkins et al. (1995), the manual feature extraction of syntactic features was performed. The result of this manual coding was then used to train a neural network model to predict the difficulty based on syntactic features such as word count and question type. Though these studies are somewhat outdated in several respects, their comparative perspective is still very informative for understanding the gradual growth of this research community. In contrast, recent neural network-based approaches (since 2017) have started using neural language models such as word embedding for the feature extraction component of the model. For instance, a pre-trained BERT was used in Zhou and Tao (2020) to predict the difficulty of programming problems. BERT was additionally trained on a task-specific corpus to compute word vectors from the programming problems which were then fed into an attention-based neural network classifier. A CNN was employed by Huang et al. (2017) to predict the difficulty of 30,000 reading comprehension MCQs collected from a standard English test. The question elements (i.e. the stem, options and the reading passage) were analysed for each question. Sentence representations werethen extracted from the item components using a CNN-based architecture. Finally, the difficulty level was determined by aggregating the semantic representation of all items’ components. This approach accurately predicted the difficulty of reading comprehension questions, outperforming that of the domain experts.
Other popular ML methods were Random Forest (RF) and Support Vector Machine (SVM) (14% and 17% respectively), as illustrated in Fig. 4. What is interesting is that all the studies that selected RF as a prediction model conducted an algorithm selection experiment to choose the algorithm that performs better on the question difficulty prediction task. It was consistently found across these studies that the RF regressor outperformed other ML algorithms such as Linear regression, SVM, Gaussian processes, fully connected neural networks and Decision Trees (Benedetto et al., 2020a; Xu et al., 2022; Yaneva et al., 2020).

Most common prediction models (as a percentage of publications studied)
In Yaneva et al. (2019, 2020), a Random Forest regressor was used to predict the difficulty of MCQs in high-stakes medical tests based on syntactic and semantic features. The syntax-level features were produced using the Stanford NLP parser in combination with readability measures. Meanwhile, the semantic-level features (word embedding) were captured using word2vec and ELMo. When compared to students’ performance, the proposed approach outperformed the baselines (ZeroR and simplified variants of the same model) with RMSE (22.45).
Similarly, SVM models were also trained using syntactic and semantic features. Beinborn et al. (2014, 2015) trained an SVM model to predict the difficulty of c-tests and cloze-tests (also sometimes referred to as gap-fillexercises) using syntactic features produced using a text classification toolkit (DKPro Core). Meanwhile, word embeddings trained using word2vec was few into an SVM classifier in Hsu et al. (2018) to predict the difficulty of MCQs in the social studies domain.
Statistics-based learning using regression was used in seven studies. The majority of these utilised simple feature extraction approaches, where the focus was specifically on features such as word/sentence length, word count, clause type or paragraph length (Pandarova et al., 2019; Settles et al., 2020; Trace et al., 2017).
Domains and Item Types
The majority of papers on difficulty prediction are domain-specific (as illustrated in Table 6). Language learning was found to be the most frequently investigated domain (55%), followed by Computer Science (15%) and Medicine (11%). Domain-independent (i.e. generic) studies accounted for 19% of publications. Other domains were in the minority, including mathematics and social studies. With regard to the different types of item formats that were investigated, Multiple Choice Questions (MCQs) were the most common. They constitute an important form of assessment questions that require the learner to select a correct answer (i.e. key) from a set of false options (i.e. distractors). Other question types such as gap-filling items and factual items were also common (Table 7). Furthermore, domain-specific questions that could not be categorised into the previous item types (e.g. programming problems) were studied.
Language Assessment
The popularity of the language learning and medical domains could be explained in part by: 1) the existence of several Standardised Test organisations that offer international and national language proficiency tests (e.g. TOEFL or IELTS); and 2) medical licensing examinations which require a massive number of frequently updated items. Difficulty estimation is considered a fundamental process in these types of tests as it ensures fairness and the comparability of ‘high-stakes’ formal examinations, which are used to inform important decisions with respect to certification and employment.
Given the nature of language assessment, in that the language proficiency of learners is typically evaluated, syntactic features were frequently examined in studies that focused on language learning questions. Earlier studies (i.e. since 2013) have mainly investigated how syntax-level linguistic features such as word or sentence length could affect question difficulty. For this purpose, publicly available textual analysis tools such as readability measures and corpus analysis software were employed. It was not until 2017 that researchers started to exploit the questions’ textual elements at the semantic level for question difficulty prediction in the language domain. Sophisticated language models such as word embeddings and Transformers have started to be applied for learning semantic features (Bi et al., 2021; Gao et al., 2018; He et al., 2021; Huang et al., 2017; Lin et al., 2019; Loginova et al., 2021; Susanti et al., 2020, 2017; Yeung et al., 2019).
As a result of the popularity of the language domain, various types of items have been examined, including reading comprehension (RC), cloze tests, c-tests and grammar questions (Table 8). The most investigated item type in language assessment were reading comprehension items in the form of: i) MCQs (Bi et al., 2021; Boldt & Freedle, 1996; He et al., 2021; Hutzler et al., 2014; Lin et al., 2019; Loginova et al., 2021; Perkins et al., 1995; Sano, 2015; Vinu & Kumar, 2017), ii) fill-in-the-gap (Choi & Moon, 2020) or iii) factual questions (Gao et al., 2018). Early examples of research considering the difficulty of reading comprehension questions include Boldt and Freedle (1996), Boldt (1998) and Perkins et al. (1995). The interest in investigating this type of question was consistent over the last decade until very recently (Bi et al., 2021; He et al., 2021; Loginova et al., 2021). Considering the unique structure of RC questions, multiple components of the question were typically studied, including the reading passage, the stem, and distractors (in the case of MCQs). Different language models were used to extract linguistic features of RC questions both on the syntactic and semantic levels. Earlier studies employed manual coding practices and corpus analysis tools to extract features (Boldt & Freedle, 1996; Hutzler et al., 2014; Perkins et al., 1995; Sano, 2015), while later studies benefitted from advancements in the NLP field and leveraged advanced methods such as neural language models (Bi et al., 2021; He et al., 2021; Huang et al., 2017; LLin et al., 2019; Loginova et al., 2021).
Cloze- and c-tests also received considerable attention in studies that focused on predicting the difficulty of questions in the language domain. These are two widely used types of reduced redundancy testing for language assessment. Both question formats result in a gap-filling question with different characteristics: full words are deleted from text in cloze tests; while only the second half of the word is deleted in c-tests. Difficulty prediction of this type of question targets the textual passage, the gap or both as sources of difficulty. In Hou et al. (2019), the complexity of the passage of cloze questions is examined based on two features: 1) mean token length; and 2) mean sentence length. A linear regression model was used to predict the difficulty based on these features, and the resulting analysis found a positive correlation between the predicted difficulty and students’ performance. The work of Beinborn et al. (2014, 2015) used a text classification toolkit to examine the difficulty of cloze and c-tests at both the passage and gap levels. A set of 70 linguistic features including the reading complexity of the passage and the difficulty of the target word were used to train an SVM model. A positive correlationwas reported between the ground truth difficulty and the predicted difficulty. None of the studies that examined cloze or c-tests employed advanced neural language models for the feature extraction of the proposed difficulty prediction model.
Other aspects of language assessment, such as grammar, vocabulary and listening comprehension, were also investigated using various questions formats such as closest in meaning (CIM) vocabulary and gap-filling grammar questions (Yeung et al., 2019). Simple and complex feature extraction methods were used in a series of studies by the same research group to predict the difficulty of CIM questions (Susanti et al., 2016, 2020, 2017). In the first two studies, the authors used readability measures and cosine similarity to extract the features for the CIM questions. However, in their latest paper (Susanti et al., 2020), they employed word embeddings (using GloVe) instead of cosine similarity to measure the similarity between the correct answer and distractors. They found that the GloVe-based word embeddings yielded a more accurate prediction of difficulty compared to other similarity measures.
Medicine
In contrast to the language domain, papers that investigated the domain of Medicine did not consider the difficulty of the language of the question, but rather focused on measuring the difficulty of the question’s domain-related content. For example, Kurdi et al. (2021) used the relation strength between medical concepts (e.g. symptoms or medical history) to measure the difficulty of medical case-based questions. Furthermore, Qiu et al. (2019) studied the effect of the level of similarity between questions and related medical documents on difficulty. The most popular question format in the domain of medicine was MCQs. This interest in MCQs is driven by the ability to explore different sources of difficulty, through the analysis of the relationship between item elements such as item stem, distractors and correct response. Indeed, various studies found a positive correlation between difficulty and the semantic similarity between: i) distractors (Alsubait et al., 2016); ii) the stem and distractors (Hsu et al., 2018; Settles et al., 2020); and iii) the stem and the correct answer (Susanti et al., 2017). Furthermore, MCQs are easier and faster to grade, which in turn can help provide students with prompt feedback. In studies that investigated medical questions, syntactic features were typically disregarded, and instead they mostly focused on extracting semantic level features using state-of-the-art language models such as word2vec, ELMo, LSTM or BiLSTM.
Computer Science
Programming problems represented the most studied question type in the domain of Computer Science. Given the unique structure of these questions, sources of difficulty were also unique and could only be applied to this type of questions. In Grivokostopoulou et al. (2015, 2017), search algorithm exercises were investigated for possible sources of difficulty. Exercise-specific features such as the number of nodes, the average children that the node has, the depth of thetree and the solution length were examined. The proposed model’s predictions were compared to those produced by experts and showed an average accuracy of 85%.
In a recent study, a difficulty prediction model for SQL problems was proposed (SQL-DP) (Xu et al., 2022). Both the problem stem and answer were used as sources of difficulty. In a similar way to many other difficulty prediction models, the stem textsemantic features were obtained using word2vec. For the answer, the authors used TBCNN (Mou et al., 2016), a framework that parses code into an Abstract Syntax Tree (AST) to capture the tree structure information of the code. These features were then used as input to a Random Forests model, and used to predict the difficulty of new SQL problems. It was found that SQL-DP consistently outperformed other similar frameworks.
Domain-independent Studies
Domain-independent studies accounted for the second largest number of studies (almost 19% of publications in this area). In contrast to many of the domain-specific studies, the main rationale for domain-generic studies was to explore the possibility ofproducing a generalisable difficulty prediction framework that could be applied to other domains. What is interesting about the approaches utilised in domain-independent studies is that almost all papers developed difficulty estimation models based on ontological features. Indeed, eight out of nine domain-independent studies proposed to control difficulty using semantic features that were extracted using ontologies or knowledge bases (e.g. Wikidata). Furthermore, these papers only estimated the difficulty of automatically generated questions, suggesting that semantic models such as the use of ontologies and knowledge bases can provide an effective means to model generic difficulty frameworks, that can be generalised across various domains. One limitation of these approaches is that the questions investigated are governed by the way they were generated (i.e. ontology-based question generation), and thus they were only used to estimate the difficulty of automatically generated questions from ontologies. This raises the question of whether these types of features can be also applied to human-authored questions, something worthy of further exploration. For example, future studies could use semantic annotation techniques such as entity linking or named entity recognition to link the concepts in human-authored questions to their counterparts in a knowledge base in order to apply semantic difficulty features.
Evaluation Approaches for Item Difficulty Prediction
Data Sources
As this systematic review focuses on the use of data-driven approaches for item difficulty prediction, each study therefore utilises one or more data-sets in building (or training) the predictive model of item difficulty, and evaluating the efficacy of the model itself. Such data-sets therefore should be labelled with students’ performance, either for use in the model generation, or to compare with the model output.
However, when examining the literature on item difficulty prediction, there was a dearth of publicly available data-sets of items that were labelled with such difficulty scores. This could explain why the evaluation of predictive models in this area is dominated by private data-sets (which are not available for use by other studies). Only 6 of the 55 featured studies have utilised a publicly available dataset. Meanwhile, the majority of studies (90%) used private datasets that were obtained using one or more of the following sources:
-
Collected from standardised tests;
-
Automatically generated;
-
Collected from relevant textbooks;
-
Collected from an online learning platform/ website;
-
Created by experts;
-
Collected from a university- or school-level course.
Figure 5 illustrates the different categories of data sources used in the context of item difficulty estimation.

Most common data sources (as a percentage of publications studied)
Almost 27% of papers use items that are collected from known standardised tests, where the examination participants’ real performance results are also collected. This allows researchers to obtain a large number of test results from the performance of real participants; for example, Hsu et al. (2018) collected their data from a national standardised entrance examination labelled with the performance of 270,000 participants that took the exam. Interestingly, those studies that collected data from such tests also focus on the medical and language domains. This correlation supports our previous observation regarding the dominance of these domains in the literature under investigation ("Domains and Item Types" section).
The abundance of publications in the field of Automatic Question Generation (AQG) in the last few years may have also contributed to the rise in the number of publications in the area of automatic difficulty prediction research. This justification explains the fact that the second most used type of data is automatically generated items (about 27%). As opposed to traditional human-authored items, this new type of item has a number of differences that are related to its complexity level and the type of features investigated. They are normally less complicated than human-authored questions in terms of their structure and cognitive level. However, the majority of automatically generated questions have a simple structure that only addresses the first level of Bloom’s taxonomy; i.e. recall (Leo et al., 2019). With regards to difficulty features, the semantic similarity between the item components has frequently been investigated; moreover, such questions are governed by the way they were generated. For example, items that were generated from domain ontologies usually explore features which are driven from ontologies such as the strength of relation between predicates or the level of closeness of instances. Despite the ability of automatic generators to generate massive numbers of items, studies utilising these sources employed relatively small data-sets with an average of only 159 items.
In 16% of the studies considered, the questions were collected from online learning platforms or domain-related websites. For example, 1657 programming problems were collected from LeetCodeFootnote 12 and were labelled with the number of submitted solutions and the passing rate of the problem.
Domain-specific textbooks and preparation books were also used as data sources (14%). This type of data source was used in the language domain due to the availability of various preparation books which contain items that were used to train students on how to pass language proficiency tests. The remaining data sources included items that were hand-crafted by domain experts to address the specific objectives of the study (9%) and items collected from school- or university-level assessments (7%).
Focusing on studies that employed publicly available data-sets (n = 6), question corpora from the fields of machine reading comprehension and question answering (QA) systems were used to estimate the difficulty of reading comprehension questions (Bi et al., 2021; Gao et al., 2018; Loginova et al., 2021). The Stanford Question Answering Dataset (SQuAD) (Rajpurkar et al., 2016) contains 150 K questions in the form of paragraph-answer pairs extracted from Wikipedia articles. It was used by Bi et al. (2021) and Gao et al. (2018) for training and evaluating their difficulty prediction frameworks on the task of calibrating reading comprehension questions. Loginova et al. (2021) used the RACE dataset (Lai et al., 2017) which consists of 25,000 passages in English from school reading comprehension exams associated with 4 MCQs for each passage. Compared to SQuAD, this dataset requires advance reasoning skills to answer the questions. Given that the questions contained in these benchmarks are not annotated with difficulty labels, various techniques were used to label the questions with difficulty levels including crowdsourcing, employing QA systems to answer the questions or asking experts to manually annotate the questions after sampling a smaller subset. HotpotQA (Yang et al., 2018), which is another QA benchmark, was the only dataset that was manually annotated with complexity levels.
Evaluation Methods
When evaluating the performance of the difficulty prediction model, comparisons are typically made with respect to a baseline of the observed difficulty obtained from one or more of the following sources: 1) details of the students’ real performance; 2) difficulty labels provided by domain experts; or 3) a comparison with some other baseline (Table 9). The two most frequently applied evaluation method in the studies surveyed is through students performance and expert reviews (52% and 34% of studies for each method respectively). The first method is carried out by making a comparison with student performance by either utilising real or mock examination performance. This approach has been lauded for providing additional empirical evidence of difficulty as questions are typically validated through real-life or experimental testing environments with real student cohorts. However, it does require more time and effort than other approaches to administer the items to an appropriate sample of students and later calculate the observed difficulty scores using traditional measures such as IRT. Also, considerable effort is required to maintain ethical considerations with respect to such studies that include human participants. The average number of student participants in the studies reviewed here was around 719 students per study. Interestingly, those studies which collected data from standardised tests typically employed a larger student population than those that used other data sources, although this is arguably due to the fact that such tests constantly attract massive numbers of examinees.
The other commonly applied method is that of presenting items to a group of domain experts and obtaining their judgment on each item’s difficulty based on their experience. Of all of the publications considered, 34% compared their systems’ predictions with experts’ judgments. On average, three experts were recruited per paper, and each expert would typically be a subject teacher or item writer. These experts would be responsible for judging the difficulty of the items, based on the pre-defined features which might include syntactic, semantic or cognitive features. However, most studies did not provide the criteria by which experts rate the difficulty level. Despite the possible bias of this approach, it is nonetheless the primary evaluation method used by education institutions to validate and filter items besides pre-testing (Huang et al., 2017). Therefore, expert judgment is still considered an important indicator of difficulty level, despite the fact that several studies raised questions regarding the consistency and reliability of such baselines resulting from an approach which favours human intuition (Conejo et al., 2014; Thorndike, 1982; Wauters et al., 2012).
The third common evaluation method compared the proposed model to one or multiple baselines (14% of the studies reviewed here). This evaluation approach was always employed in combination with one of the two previously discussed evaluation methods. Three types of baselines were found to be used for performance comparison: 1) comparison with an existing difficulty prediction model; 2) comparison with another feature extraction technique; or 3) comparison with one or more variants of the same model.
Out of the 55 studies surveyed, only 8 papers compared their proposed model to an existing one (Benedetto et al., 2021, 2020a, 2020b; Qiu et al., 2019; Xu et al., 2022). This was mostly carried out using a different dataset and after making some modifications to the previous model. However, only 3 of these studies conducted a direct comparison with another model that had previously been published by the same group; for example, the model proposed in Benedetto et al. (2020a) was compared to a previous difficulty prediction model that had been developed by the same research group (Benedetto et al., 2020b). The researchers also attempted to compare their model to other existing models, however, since they were evaluated on private datasets, a complete comparison was not possible. Other models could not be appropriately compared due to the absence of publicly available code and the fact that they were implemented on private data-sets. For example, when the model of Xue et al. (2020) was re-implemented on a different dataset for the purpose of comparing it to their proposed model, the authors found that the best performing input configuration was different than the one stated in the original paper (Benedetto et al., 2021). This indicates that the absence of a common benchmark for question difficulty prediction hinders meaningful comparisons.
In some papers (n = 5), one or more variants of their proposed model were introduced and used for performance comparisons. Other variants were developed to either examine a different set of features or a smaller sub-set of the proposed features. For example, Lin et al. (2015) compared four baselines measuring the same feature of semantic similarity between distractors, as opposed to Yeung et al. (2019) who compared the performance of two baselines based on different features: semantic similarity between distractors and similarity between carrier sentence and distractors.
Sometimes, the purpose of the comparison was to evaluate two different feature extraction methods when performing the same difficulty prediction task. For example, the BERT-based model that was proposed in Loginova et al. (2021) was compared to 3 models based on ELMo. Similarly, in Yeung et al. (2019) BERT’s ability to identify plausible distractors for gap-filling MCQs was evaluated against the performance of other similarity measures. In another paper (Qiu et al., 2019), one of the baselines that were used to evaluate the performance of a neural network containing Bi-LSTM was a TF-IDF/SVM model.
Linguistic Difficulty Features
The relationship between difficulty and linguistic variables has been extensively studied in the literature, and whilst such features can generally be subdivided into syntactic and semantic features, most of the work to date has primarily focused on syntactic features (Boldt & Freedle, 1996; Hoshino & Nakagawa, 2010; Perikos et al., 2011; Perkins et al., 1995).
However, since 2015 there has been a growing interest in the correlation of different semantic factors and item difficulty, with several studies emerging that have started to examine semantic factors by exploring semantic relevance and semantic similarity between a question’s elements (Hsu et al., 2018; Lin et al., 2015; Qiu et al., 2019; Vinu et al., 2016). A third category of features has also been investigated that explores the effect of cognitive aspects of language on difficulty, through the use of psycholinguistic variables. The following subsections explore these different types of features, starting with psycholinguistic features, before discussing in turn syntactic and semantic features.
Psycholinguistic Features
A small number of studies have examined the use of psycholinguistic variables by studying the effect that different cognitive aspects of language have on difficulty (Hutzler et al., 2014; Pandarova et al., 2019; Perkins et al., 1995; Yaneva et al., 2019). These features attempt to capture the ways in which language is processed cognitively by the brain. For example, some questions require students to assess the logic of the author; these items require an analysis of the content, structure, style of language or the inference of the author’s purposes. Furthermore, some items explicitly include the correct answer, while others implicitly refer to the answer and require more skills by students to understand it. Such features focus on analysing cognitive requirements to measure different levels of skills. In Yaneva et al. (2019), the authors drew psycholinguistic features from the MRC psycholinguistic database (Coltheart, 1981) which contains a total of 98,538 words that are labelled with cognitive measures such as imageability (a measure to capture the ease with which words’ mental imagesare constructed), familiarity of the word and age of acquisition (referring to the age at which a word is typically learned). However, since this type of cognitive skill is difficult to quantify, the feature extraction process was conducted manually by domain experts in most of these studies. Nonetheless, it represents a possible source of intrinsic, construct-related difficultywhich can be extracted directly from the item text.
Syntax-based Features
Structure-level, or syntax-based features refer to the linguistic components that govern the textual structure of a question. This level of language typically incorporates syntactic, lexical and grammatical components. Thus, the motivation behind analysing this type of feature is primarily to determine underlying characteristics which indicate the level of textual complexity and readability of questions. This source of difficulty can be estimated either by considering word- or sentence-level measures (such that words or sentences can themselves be used as units of measurement). Table 10 lists the most common structure-level features observed in the publications examined.
There are two basic measures that have predominantly been utilised in recent years for item difficulty prediction: question length and question complexity. Measuring the question length refers to the process of counting characters, words, or sentences to determine the effect of the length of the item text on difficulty. Meanwhile, the question complexity measure focuses on the structural components of questions with regard to their effect on difficulty. Both measures were frequently examined in the literature by using various linguistic variables.
Question length has typically been measured using two approaches: that of counting the number of characters in a word (i.e. word length) (Beinborn et al., 2014, 2015; Benedetto et al., 2020a; Choi & Moon, 2020) and that of counting the number of words in a sentence (i.e. sentence length) (Beinborn et al., 2014, 2015; Yaneva et al., 2019). These two features can target different components of a question (stem, distractors and/or correct answer). As it is believed that long words/sentences are more difficult to understand than shorter ones, utilising measures to count the number of characters in a word or words in a sentence was observed to be very common in the literature examined (n = 28). Whenmeasuring word count (i.e. item length), the number of all words (tokens) in the stem are counted, including repeats. In some cases, only content words (words with lexical meaning) were taken into account. This can be achieved by using Part of Speech (PoS) tagging, which represents another common feature, to separate content words from function words (i.e. words that only represent syntactic relations).
Question complexity was measured using different textual features. One such feature was concerned with counting the frequency of specific words. When measuring word count (i.e. question length), the number of all words (tokens) are counted, including repetitions, whereas word frequency focuses on only counting the appearance of distinct (i.e. unique) words. Word frequency can target special word types such as verbs, nouns, negation, named entities (Aryadoust, 2013; Choi & Moon, 2020), and/or domain-specific concepts (Grivokostopoulou et al., 2014; Perikos et al., 2011). For example, Loukina et al. (2016) found that the lexical frequency of the words was the best predictor of difficulty, whereas Sano (2015) found that the part-of-speech (POS) count in the stem and the key was the best predictor of difficulty.
Some studies further examined the frequency of complex types of words which tend to require advanced cognitive skills, such as academic, complex, and common (or uncommon) words (Beinborn et al., 2014; Choi & Moon, 2020; Loukina et al., 2016). For example, word frequency was used to examine the relationship between word familiarity and difficulty (Beinborn et al., 2014; Pandarova et al., 2019). The underlying assumption was that questions with more familiar or popular words are easier to answer.This is also the case for the sentence-level analysis which utilised measures to count the number of sentences or special types of sentences (e.g. type of clause) to assess the complexity level of the question (Benedetto et al., 2020a; Choi & Moon, 2020; Yaneva et al., 2019).
However, in some domains, it was observed that it was more reasonable to count the number of domain-specific concepts that appear in the stem; for example, the number of programming and mathematical concepts were measured when predicting difficulty of programming and mathematics questions (Grivokostopoulou et al., 2017; Khodeir et al., 2018). Other studies have incorporated POS tagging to count the number of appearances of each POS element (e.g. verbs, nouns and pronouns) in order to explore features such as verb variation, which can increase text complexity. Question complexity was also measured using readability measures (e.g. Flesch Reading Ease and Flesch Kincaid Grade Level) which measure the complexity of the vocabulary and syntax of the question’s textual content (Benedetto et al., 2020a; Susanti et al., 2017; Yaneva et al., 2019).
Semantic-based Features
Semantic-based features focus on the relationship between difficulty and semantic properties of an item or its components. Little attention was paid to the use of such features within earlier publications on item difficulty prediction; however, more recent studies (i.e. those published from 2013) have started to recognise the importance of a deeper level of analysis to examine sources of difficulty at the semantic level. Semantic similarity is the predominant feature that was investigated in the literature (see Table 11), whether considering similarity between words or between item components. The latter includes the semantic relationship between item stem and distractors, distractors and correct response and or between distractors.
In contrast to the use of syntax-related features, the use of semantic-related features has focused on the similarity of words based on their meaning (“Feature Extraction” section). The intuition behind this is that highly semantically related components increase the cognitive load on examinees when choosing the correct answer, hence, increasing difficulty level. For example, in gap-filling items, the semantic relatedness between the gap and the surrounding context (i.e. the relative difference in meaning between the sentence context and the phrase that is omitted) proved to be an influential factor on difficulty (Beinborn et al., 2015). One of the most common approaches to determining the semantic similarity between words is by considering the distance between two-word vectors using word embedding. This process starts by constructing a semantic space where each word in the item is represented as a vector (Hsu et al., 2018). Finally, distances between vectors are calculated to obtain the semantic similarity score.
Rich semantic models such as ontologies and knowledge bases were employed in some studies to extract linguistic features on the semantic level. Given that semantic models define the semantic relationship of domain knowledge in a formal, structured and machine-processable format, they represented an effective tool to extract semantic features from the items’ components. Semantic components such as concepts, predicates and individuals were used to propose various semantic similarity measures (Alsubait et al., 2013; Leo et al., 2019; Seyler et al., 2017). In a series of studies, Vinu and Kumar (2020) explored various ontological measures to extract semantic features (Vinu & Kumar, 2015, 2017). For example, they studied entity (i.e. concept) popularity as a determining factor of difficulty based on the intuition that questions that contain popular entities are easy to answer. Given an ontology, this metric is measured by the number of object properties which are linked to it from other individuals. Another factor they propose to measure is how specific a question is. This is captured by utilising the concept and role hierarchy of the domain ontology to examine the depth of a certain concept (given that deeper concepts in the hierarchy result in questions of greater difficulty). Similarly, Faizan and Lohmann (2018) and Seyler et al. (2017) propose similar features; however, they utilise a knowledge base to extract the features.
Evaluation Metrics
The overall goal of developing prediction models is to be able to reflect the ground-truth labels with a high degree of accuracy, given a set of input features extracted from the item. Therefore, evaluation metrics are considered a fundamental step that assesses the overall model performance. Furthermore, having a general consensus on the type of evaluation metrics used for assessing a certain machine learning task can facilitate direct performance comparisons across different studies. As depicted in Fig. 6, the prediction models were often evaluated using RMSE, accuracy, precision, recall, F1 and Pearson’s correlation. In studies that modeled the difficulty prediction task as a regression problem, RMSE and Pearson Correlation Coefficient were the most common evaluation metrics (used in 26% and 22% of studies respectively). Meanwhile, accuracy was used in approximately 26% of classification-based studies. Accuracy is an intuitive evaluation metric that simply refers to the proportion of correctly predicted values; however, it is only an appropriate metric when we have an equal number of samples in each class, as simply predicting all values as the majority class label can result in optimistic, but misleading accuracy results. In this case, precision and recall can be used to measure the correctly predicted values for the positive and negative classes. Therefore, 17% of papers have reported using the F1 score (which is calculated by combining the recall and precision values) to provide a more precise performance measure of the classification model.

Most common evaluation metrics (as a percentage of publications studied)
Comparative Performance of Prediction Models
Any attempt to systematically compare the different prediction models in the literature is a highly challenging task due to several factors. As highlighted in the discussion above, there is a diversity of approaches, methods, techniques and testing theories used in each step of the difficulty modeling process. This heterogeneity of measurements and metrics hinders any attempt to aggregate results into a comparable form across multiple studies. For example, different psychometric models (e.g. IRT and CCT) have been used to calculate the same score (i.e. observed difficulty). Furthermore, the experts’ ratings of difficulty can vary significantly between different studies that use binary scales (easy or difficult) and studies with more categories such as the Likert scale (very easy, easy, medium, difficult, very difficult, etc.).
The lack of publicly available data-sets with difficulty-labelled items has also prevented attempts to compare models using the same data-set. Furthermore, similar difficulties arise when we try to normalise the scores of evaluation metrics that use different scales to explore the comparability between these different models. For example, in an attempt to gain some insight into different model performances, we were unable to normalise RMSE scores using NRMSE or Relative RMS, due in part to the fact that important data such as the difficulty scales used to train the models were not reported. Even though the reporting practices are often appropriate for each paper in isolation, they do not provide a sufficient basis that can be used to perform a comparative analysis. Therefore, the lack of consistency in reporting practices, which do not report some important performance and evaluation data, prevents meaningful and systematic comparisons between difficulty models.
Discussion and Future Challenges
The aim of this review was to assess the research area of automatic methods that perform a priori question difficulty estimation of textual questions with regard to the objectives given in the "Introduction" section. This review is timely, as confirmed by the recent publication of another similar but complementary review that was conducted independently from this study (Benedetto et al., 2023). In order to aid the reader, we therefore provide a characterisation of the differences between these two reviews in the “Comparison with Other Studies” section that illustrates how this study extends and complements the work of Benedetto et al. (2023).
We then present a number of observations based on the analysis given in the "Findings from the Systematic Review" section, as well as challenges that should be addressed (“Reflection on the Aims of This Study” section).
Comparison with Other Studies
Although both reviews assess the field of automatic methods for a priori question difficulty estimation, the study by Benedetto et al. (2023) adopts a different approach to the one conducted here and across a smaller corpus of publications (only 28 studies out of the 55 studies that we identified using a systematic procedure). The differences between the two reviews can be characterised across three different dimensions; that of extent, scope and approach.
The extent of work (in terms of its volume and breadth) covered in this study goes beyond that of other recent studies, by examining some of the earliest studies in the field dating back to the mid-1990s. This contrasts with the time-frame considered by Benedetto et al. (2023), which only covers the more recent studies (i.e. from 2015). This has allowed us to explore the historical context of much of the work, which is crucial in understanding the gradual shift supported by the technical advancements that occurred throughout the years. For example, as discussed in the “Publication Trends” section, artificial neural networks emerged as an alternative to the use of statistical approaches for exploring the relationships between item parameters and difficulty. The use of other machine learning approaches appeared in studies between approximately 2010 and 2015, when there was an increase in the number of publications addressing the automated question difficulty estimation field.
Another significant difference between this study and prior reviews such as that by Benedetto et al. (2023) is in the definition of scope, which in this case is wider, resulting in a larger number of studies considered. In this study, we have also explored other aspects of difficulty models such as questions type, domain, approach or questions provenance (see Tables 6 and 7, for example in “Domains and Item Types” section).
Finally, the approach followed here does not rely on individual illustrative examples for each question type, such as those proposed in Benedetto et al. (2023). Instead, we adopt a method-based approach in that we analyse the studies identified in our review according to the methods and approaches that have been adopted. We also present a comprehensive yet compact view of the overall significant literature by providing a complete decomposition of the basic architectural components of the difficulty models whilst focusing on the main methodologies utilised in the literature. This is especially beneficial for the technically oriented reader who can benefit from both a holistic and compact view of the proposed systems. However, it is not merely a technical reference, but can also provide an informative pedagogical reading by presenting an in-depth analysis of the pedagogical domains that were discovered and how they were transformed by recent technology, thus extending the discussion and findings by Benedetto et al. (2023).
In conclusion, although both studies provide a review of the field of question difficulty estimation from text, the work of Benedetto et al. (2023) has focused primarily on providing an introduction to the field by examining the more recent approaches in the literature, and presenting these based on a taxonomy of question format which they propose. This is then followed by a discussion that highlights opportunities for future directions. Both reviews have emphasised the increased interest in the research area in recent years and stressed the need for public data-sets to allow for quantitative comparisons of the different approaches. However, because of the greater scope and extent of ourapproach, this review complements and extends their work by covering a number of additional aspects that are either absent or only briefly discussed in their review; that include: an in-depth analysis of the specific domains that were investigated; the provenance, size and characteristics of the used data-sets; the linguistic features that were examined; the different evaluation methods that were implemented; and finally the characteristics of the overall research field.
Reflection on the Aims of This Study
The first aim was to provide an overview of the research field with regard to the chronology and type of venue where much of the work has been published. As Fig. 3 illustrates, there has been a growth in publications in the last few years suggesting that the interest in this community is growing, and spans a combination of research areas such as psychometrics, linguistics, educational psychology, knowledge engineering and artificial intelligence. Moreover, automatic difficulty prediction frameworks have been shown to be relevant in other research areas such as in Automatic Question Generation (AQG) and Computerised Adaptive Testing (CAT).
Another aim was to understand how different types of features were correlated to question difficulty. One of the more significant findings to emerge from this review is that linguistic features play a major role in determining items’ difficulty level (“Linguistic Difficulty Features” section). We found that several syntactic and semantic features were explored as indicators of difficulty. On the syntactic level, textual complexity, readability, lexical diversity and grammatical forms are frequently examined by using NLP tools to count textual elements (e.g. words, sentences, complex words, etc.); whereas predicting difficulty by examining semantic features has garnered interest in more recent studies, facilitated by the existence of semantically connected data formats such as domain ontologies and state-of-the-art neural language models.
The evaluation methods employed by the majority of studies used either expert or student ratings of difficulty as a baseline (“Evaluation Approaches for Item Difficulty Prediction” section). Despite the additional time and effort required for such evaluations, they are still considered good indicators of difficulty (i.e. gold standard references), reflecting similar views of psychometricians and educational psychologists. The use of baseline approaches within comparative studies was not used to perform direct comparisons with other existing models, due to the heterogeneity of measurements and the lack of consistency of reporting practices within the field. Another noticeable finding was that the difficulty prediction literature primarily utilised private data-sets, as many research teams relied on collecting data from standardised tests, automatic question generators or hand-crafted by experts.
A significant challenge for the item difficulty prediction community is that of developing a publicly available repository of standardised data-sets to facilitate and accelerate the rate of discovery in the field. These data-sets would ideally need to contain a rich variety of different items and be labelled with levels of difficulty or values that are based on real-world student performance (anonymised to ensure ethical reuse). Although difficulty labels based on expert opinion could also be used, labels based on student performance are typically preferred. Another limitation of existing data is that of size; the majority of current studies utilise smaller data-sets due to the fact that these are typically hand-crafted. Thus, another challenge is in the exploration of approaches that can enrich and increase the size of current data-sets to provide a solid basis for better generalisability of results. Moreover, larger data-sets may yield better performance from many of the emerging machine learning paradigms such as deep learning and neural approaches. Furthermore, the use of a well-defined, standardised repository of data-sets will facilitate comparability and repeatability of results from future studies.
The variety and heterogeneity of different evaluation metrics and measures used in existing studies can hinder systematic comparisons between approaches, due to a lack of standardised approaches (this also relates somewhat to the availability of publicly accessible data-sets). Finding a more consistent means of evaluating the performance of different item difficulty prediction models would facilitate better comparative evaluations, such as ensuring a more consistent use of rating scales, observed difficulty measurements and performance indicators across different studies. Without such measures, studies would need to include more evaluation data (both in terms of empirical methodology and in reported observations) to allow the aggregation and normalisation of scales and results across multiple studies. This is especially the case for evaluation methods and metrics which are considered an essential part of the development of valid and reliable models.
One finding in this review was that the majority of difficulty prediction models tend to be domain and item specific (which can further impede the use of such models to other domains). Hence, providing a generalisable framework that can be applied across multiple domains and item types is achallenging task. Producing generic models will inherently affect the models’ levels of detail (Dhillon, 2011). Thus, another challenge is in the identification of more generic features that can be used across multiple models, possibly achieved by examining the different types of items produced for different domains and identifying shared commonalities. This can also be achieved by examining non-textual sources of difficulty such as was done by Alsubait et al. (2013) and Vinu and Kumar (2020) (see “Domain-independent studies” section).
The relative maturity of some automatic question generation methods that are capable of generating large quantities of items provides an opportunity to study the differences and similarities between human-authored and automatically generated items. One difference that was reported in the literature is related to the level of complexity of items in each type. Human-authored items are more complicated because they address several concepts and competency requirements which are thoughtfully crafted by experienced item writers. Meanwhile, most of the current generating models are only capable of producing simple factual items. Moreover, automatically generated items have very similar linguistic structures. Thus, there is an opportunity to conduct further experiments to examine the effect of different types of features on each type of item.
Finally, there is also the opportunity to investigate the potential of item difficulty prediction models that could be used to provide the AQG community with automatic, reliable and objective evaluation metrics for use in validating automatically generated items with regard to difficulty. The AQG literature stresses the need for automatic evaluation metrics that can analyse large quantities of items, given that current evaluation methodologies which involve human participants, or basic n-gram measures have been criticised for being subjective, inaccurate and difficult to scale (Amidei et al., 2018).
Conclusion
In this paper, we provide a comprehensive and systematic review of automatic approaches to item difficulty predictive modelling, with the goal of providing an overview of the research in this area, as well as characterising the opportunities and challenges for future research. The aim and objectives for the systematic review have been articulated, and the review methodology was presented, together with the details of the selection process that started with an initial repository of 205 candidate publications, and ended with 55 core publications that formed the basis of the review.
This revealed that there have been two lines of work on item difficulty prediction, the most recent being since 2014 where a number of different machine learning approaches have been investigated for use in modelling item difficulty (with Neural networks,SVM and Random Forests being the three most used learning paradigms used), coinciding with the growth of the Automatic Question Generation research area. The vast majority of training data used is sourced through private data-sets; labelled primarily through expert ratings, and sourced primarily from language learning, computer science and medicine. Linguistic features were found to play a major role in determining items’ difficulty level, based on a variety of syntactic and semantic features elicited bya number of NLP based approaches. Although there has been extensive evaluation of the different approaches, few of these have been comparative due the lack of standardised data-sets and a coherent use of evaluation methods.
Several opportunities and challenges for the item difficulty prediction community were identified, including the need for a publicly available repository of standardised data-sets to facilitate and accelerate the rate of discovery in the field, as well asexploring approaches that can enrich and increase the size of current data-sets to provide a solid basis for better generalisability of results. Prediction models would also benefit from the identification of more generic features as part of the featureelicitation process, that would then facilitate greater use across a more diverse range of problem domains. This review lays the groundwork for future research into automatic difficulty prediction, that has the potential to yield various promising directions of inquiry, given its interdisciplinarity nature. Furthermore, the constant growth of online learning environments which require an abundant of difficulty-aware assessment questions provide further applicability for difficulty modelling approaches.
Notes
We use the terms item and question interchangeably throughout this paper to refer to any educational construct that is intended to measure students’ level of knowledge.
Snowballing is a method typically used in systematic reviews to include papers based on the.
citation network to and from a certain paper.
A CTT-based statistic (also commonly referred to asproportion correct or percentage correct), whereby the success rate of test-takers is empirically determined by calculating the proportion of test-takers answering correctly out of the total number of test-takers.
References
AlKhuzaey, S., Grasso, F., Payne, T. R., & Tamma, V. (2021). A systematic review of data-driven approaches to item difficulty prediction. In International Conference on Artificial Intelligence in Education (pp. 29–41). Springer.
Alsubait, T., Parsia, B., & Sattler, U. (2013). A similarity-based theory of controlling MCQ difficulty. In 2013 Second International Conference on Elearning and E-Technologies in Education (ICEEE) (pp. 283–288). IEEE.
Alsubait, T., Parsia, B., & Sattler, U. (2016). Ontology-based multiple choice question generation. KI-Künstliche Intelligenz, 30(2), 183–188.
Amidei, J., Piwek, P., & Willis, A. (2018). Evaluation methodologies in automatic question generation 2013–2018. In Proceedings of the 11th International Natural Language Generation Conference (pp. 307–317).
Aryadoust, V. (2013). Predicting item difficulty in a language test with an adaptive neuro fuzzy inference system. In IEEE Workshop on Hybrid Intelligent Models and Applications (HIMA) (Vol. 2013, pp. 43–50).
Baker, F. B., & Kim, S.-H. (2017). The basics of item response theory using R. Springer International Publishing.
Beinborn, L., Zesch, T., & Gurevych, I. (2014). Predicting the difficulty of language proficiency tests. Transactions of the Association for Computational Linguistics, 2, 517–530.
Beinborn, L., Zesch, T., & Gurevych, I. (2015). Candidate evaluation strategies for improved difficulty prediction of language tests. In Proceedings of the Tenth Workshop on Innovative use of NLP for Building Educational Applications (pp. 1–11).
Benedetto, L., Aradelli, G., Cremonesi, P., Cappelli, A., Giussani, A., & Turrin, R. (2021). On the application of transformers for estimating the difficulty of multiple-choice questions from text. In Proceedings of the 16th Workshop on Innovative Use of NLP for Building Educational Applications (pp. 147–157).
Benedetto, L., Cappelli, A., Turrin, R., & Cremonesi, P. (2020a). Introducing a framework to assess newly created questions with natural language processing. In I. I. Bittencourt, M. Cukurova, K. Muldner, R. Luckin, & E. Millán (Eds.), Artificial intelligence in education (pp. 43–54). Springer.
Benedetto, L., Cappelli, A., Turrin, R., & Cremonesi, P. (2020b). R2DE: A NLP approach to estimating IRT parameters of newly generated questions. In Proceedings of the 10th International Conference on Learning Analytics & Knowledge (pp. 412–421).
Benedetto, L., Cremonesi, P., Caines, A., Buttery, P., Cappelli, A., Giussani, A., & Turrin, R. (2023). A survey on recent approaches to question difficulty estimation from text. ACM Computing Surveys, 55(9), 1–37.
Bi, S., Cheng, X., Li, Y.-F., Qu, L., Shen, S., Qi, G., ... Jiang, Y. (2021). Simple or complex? complexity-controllable question generation with soft templates and deep mixture of experts model. arXivpreprint arXiv:2110.06560
Boldt, R. F. (1998). GRE analytical reasoning item statistics prediction study. ETS Research Report Series, 1998(2), i–23.
Boldt, R. F., & Freedle, R. (1996). Using a neural net to predict item difficulty. ETS Research Report Series, 1996(2), i–19.
Cheng, S., Liu, Q., Chen, E., Huang, Z., Huang, Z., Chen, Y., & Hu, G. (2019). DIRT: Deep learning enhanced item response theory for cognitive diagnosis. In Proceedings of the 28th ACM International Conference on Information and Knowledge Management (pp. 2397–2400).
Choi, I.-C., & Moon, Y. (2020). Predicting the difficulty of EFL tests based on corpus linguistic features and expert judgment. Language Assessment Quarterly, 17(1), 18–42.
Coltheart, M. (1981). The MRC psycholinguistic database. The Quarterly Journal of Experimental Psychology Section A, 33(4), 497–505.
Conejo, R., Guzmán, E., Perez-De-La-Cruz, J.-L., & Barros, B. (2014). An empirical study on the quantitative notion of task difficulty. Expert Systems with Applications, 41(2), 594–606.
Devlin, J., Chang, M.-W., Lee, K., Toutanova, K. (2018). Bert: Pre-training of deep bidirectional transformers for language understanding. arXivpreprint arXiv:1810.04805
Dhillon, D. (2011). Predictive models of question difficulty-a critical review of the literature.The Assessment and Qualifications Alliance, 21
El Masri, Y. H., Ferrara, S., Foltz, P. W., & Baird, J.-A. (2017). Predicting item difficulty of science national curriculum tests: The case of key stage 2 assessments. The Curriculum Journal, 28(1), 59–82.
Faizan, A., & Lohmann, S. (2018). Automatic generation of multiple choice questions from slide content using linked data. In Proceedings of the 8th International Conference on Web Intelligence, Mining and Semantics (pp. 1–8).
Fei, T., Heng, W. J., Toh, K. C., & Qi, T. (2003). Question classification for e-learning by artificial neural network. In Fourth international conference on information, communications and signal processing, 2003 and the fourth pacific rim conference on multimedia. Proceedings of the 2003 joint (Vol. 3, pp. 1757–1761).
Felice, M., & Buttery, P. (2019). Entropy as a proxy for gap complexity in open cloze tests. In Proceedings of the International Conference on Recent Advances in Natural Language Processing (RANLP 2019) (pp. 323–327).
Flesch, R. (1948). A new readability yardstick. Journal of Applied Psychology, 32(3), 221.
Franzen, M. (2011). Item difficulty. Encyclopedia of Clinical Neuropsychology, 100–100.
Gao, Y., Bing, L., Chen, W., Lyu, M.R., King, I. (2018). Difficulty controllable generation of reading comprehension questions. arXivpreprint arXiv:1807.03586
Grivokostopoulou, F., Hatzilygeroudis, I., & Perikos, I. (2014). Teaching assistance and automatic difficulty estimation in converting first order logic to clause form. Artificial Intelligence Review, 42(3), 347–367.
Grivokostopoulou, F., Perikos, I., & Hatzilygeroudis, I. (2015). Estimating the difficulty of exercises on search algorithms using a neuro-fuzzy approach. In 2015 IEEE 27th International Conference on Tools with Artificial Intelligence (ICTAI) (pp. 866–872).
Grivokostopoulou, F., Perikos, I., & Hatzilygeroudis, I. (2017). Difficulty estimation of exercises on tree-based search algorithms using neuro-fuzzy and neuro-symbolic approaches. In Advances in combining intelligent methods (pp. 75–91). Springer.
Ha, V., Baldwin, P., Mee, J., et al. (2019). Predicting the difficulty of multiple choice questions in a high-stakes medical exam. In Proceedings of the 14th workshop on innovative use of NLP for building educational applications (pp. 11–20).
Hambleton, R. K., & Jones, R. W. (1993). Comparison of classical test theory and item response theory and their applications to test development. Educational Measurement: Issues and Practice, 12(3), 38–47.
He, J., Peng, L., Sun, B., Yu, L., & Zhang, Y. (2021). Automatically predict question difficulty for reading comprehension exercises. In 2021 IEEE 33rd International Conference on Tools with Artificial Intelligence (ICTAI) (pp. 1398–1402).
Hoshino, A., & Nakagawa, H. (2010). Predicting the difficulty of multiple-choice close questions for computer-adaptive testing. In Proceedings of the 11th International Conference on Intelligent Text Processing and Computational Linguistics, 46 (pp. 279–292).
Hou, J., Koppatz, M., Hoya Quecedo, J. M., Stoyanova, N., Kopotev, M., & Yangarber, R. (2019). Modeling language learning using specialized Elo ratings. Innovative use of NLP for Building Educational Applications, 494–506.
Hsu, F.-Y., Lee, H.-M., Chang, T.-H., & Sung, Y.-T. (2018). Automated estimation of item difficulty for multiple-choice tests: An application of word embedding techniques. Information Processing & Management, 54(6), 969–984.
Huang, Z., Liu, Q., Chen, E., Zhao, H., Gao, M., Wei, S., Hu, G. (2017). Question difficulty prediction for reading problems in standard tests. Proceedings of the AAAI Conference on Artificial Intelligence, 31(1), 1352–1359 AAAI.
Hutzler, D., David, E., Avigal, M., & Azoulay, R. (2014). Learning methods for rating the difficulty of reading comprehension questions. In 2014 IEEE International Conference on Software Science (pp. 54–62). Technology and Engineering.
Keele, S. (2007). Guidelines for performing systematic literature reviews in software engineering. In Technical Report Technical report, Ver. 2.3 EBSE Technical Report.
Khodeir, N. A., Elazhary, H., & Wanas, N. (2018). Generating story problems via controlled parameters in a web-based intelligent tutoring system. The International Journal of Information and Learning Technology, 35(3), 199–216.
Kincaid, J. P., Fishburne, R. P., Jr., Rogers, R. L., & Chissom, B. S. (1975). Derivation of new readability formulas (automated readability index, fog count and Flesch reading ease formula) for navy enlisted personnel (Tech. Rep.), CNTECHTRA Research Branch Report (pp. 8–75).
Kurdi, G., Leo, J., Matentzoglu, N., Parsia, B., Sattler, U., Forge, S., ... Dowling, W. (2021). A comparative study of methods for a priori prediction of MCQ difficulty. Semantic Web, 12(3), 449–465
Lai, G., Xie, Q., Liu, H., Yang, Y., Hovy, E. (2017). Race: Large-scale reading comprehension dataset from examinations. arXivpreprint arXiv:1704.04683
Lee, J.-U., Schwan, E., Meyer, C. M. (2019). Manipulating the difficulty of c-tests. arXivpreprint arXiv:1906.06905
Leo, J., Kurdi, G., Matentzoglu, N., Parsia, B., Sattler, U., Forge, S., ... Dowling, W. (2019). Ontology-based generation of medical, multiterm mcqs. International Journal of Artificial Intelligence in Education, 29(2), 145–188
Lin, C., Liu, D., Pang, W., & Apeh, E. (2015). Automatically predicting quiz difficulty level using similarity measures. In Proceedings of the 8th international conference on knowledge capture (pp. 1–8).
Lin, L.-H., Chang, T.-H., & Hsu, F.-Y. (2019). Automated prediction of item difficulty in reading comprehension using long short-term memory. In 2019 International Conference on Asian Language Processing (IALP) (pp. 132–135). IEEE.
Ling, T., Kang, B. H., Johns, D. P., Walls, J., & Bindoff, I. (2008). Expert-driven knowledge discovery. In Fifth International Conference on Information Technology: New Generations (ITNG 2008) (pp. 174–178). IEEE.
Loginova, E., Benedetto, L., Benoit, D., & Cremonesi, P. (2021). Towards the application of calibrated transformers to the unsupervised estimation of question difficulty from text. In RANLP 2021 (pp. 846–855). INCOMA.
Loukina, A., Yoon, S.-Y., Sakano, J., Wei, Y., & Sheehan, K. (2016). Textual complexity as a predictor of difficulty of listening items in language proficiency tests. In Proceedings of COLING 2016, the 26th International Conference on Computational Linguistics: TECHNICAL papers (pp. 3245–3253).
Manning, C. D., Surdeanu, M., Bauer, J., Finkel, J. R., Bethard, S., & McClosky, D. (2014). The Stanford CoreNLP natural language processing toolkit. In Proceedings of 52nd annual meeting of the association for computational linguistics: system demonstrations (pp. 55–60).
Mikolov, T., Chen, K., Corrado, G., Dean, J. (2013a). Efficient estimation of word representations in vector space. arXiv preprint arXiv:1301.3781
Mikolov, T., Sutskever, I., Chen, K., Corrado, G., & Dean, J. (2013b). Distributed representations of words and phrases and their compositionality. In Proceedings of the 26th international conference on neural information processing systems (Vol. 2, pp. 3111–3119). Curran Associates Inc.
Mou, L., Li, G., Zhang, L., Wang, T., & Jin, Z. (2016). Convolutional neural networks over tree structures for programming language processing. Thirtieth AAAI Conference on Artificial Intelligence, 30(1), 1287–1293.
Pandarova, I., Schmidt, T., Hartig, J., Boubekki, A., Jones, R. D., & Brefeld, U. (2019). Predicting the difficulty of exercise items for dynamic difficulty adaptation in adaptive language tutoring. International Journal of Artificial Intelligence in Education, 29(3), 342–367.
Pérez, E. V., Santos, L. M. R., Pérez, M. J. V., de Castro Fernández, J. P., & Martín, R. G. (2012). Automatic classification of question difficulty level: Teachers’ estimation vs. students’ perception. In 2012 Frontiers in Education Conference Proceedings (pp. 1–5). IEEE.
Perikos, I., Grivokostopoulou, F., Hatzilygeroudis, I., & Kovas, K. (2011). Difficulty estimator for converting natural language into first order logic. In Intelligent Decision Technologies (pp. 135–144).
Perikos, I., Grivokostopoulou, F., Kovas, K., & Hatzilygeroudis, I. (2016). Automatic estimation of exercises’ difficulty levels in a tutoring system for teaching the conversion of natural language into first-order logic. Expert Systems, 33(6), 569–580.
Perkins, K., Gupta, L., & Tammana, R. (1995). Predicting item difficulty in a reading comprehension test with an artificial neural network. Language Testing, 12(1), 34–53.
Peters, M.E., Ammar, W., Bhagavatula, C., Power, R. (2017). Semi-supervised sequence tagging with bidirectional language models. arXiv preprint arXiv:1705.00108
Qiu, Z., Wu, X., & Fan, W. (2019). Question difficulty prediction for multiple choice problems in medical exams. In Proceedings of the 28th ACM International Conference on Information and Knowledge Management (pp. 139–148).
Rajpurkar, P., Zhang, J., Lopyrev, K., Liang, P. (2016). SQuAD: 100,000+ questions for machine comprehension of text. arXiv preprint arXiv:1606.05250
Rust, J., & Golombok, S. (2014). Modern psychometrics: The science of psychological assessment. Routledge.
Salton, G., & McGill, M. J. (1986). Introduction to modern information retrieval. McGraw-Hill Inc.
Sano, M. (2015). Automated capturing of psycho-linguistic features in reading assessment text. Annual Meeting of the National Council on Measurement in Education.
Scott, M. (2008). Wordsmith tools (version 6) [computer software]. Oxford University Press.
Settles, B., Lalair, G. T., & Hagiwara, M. (2020). Machine learning–driven language assessment. Transactions of the Association for computational Linguistics, 8, 247–263.
Seyler, D., Yahya, M., & Berberich, K. (2017). Knowledge questions from knowledge graphs. In Proceedings of the ACM SIGIR international conference on theory of information retrieval (pp. 11–18).
Sheehan, K. M., Flor, M., & Napolitano, D. (2013). A two-stage approach for generating unbiased estimates of text complexity. In Proceedings of the workshop on natural language processing for improving textual accessibility (pp. 49–58).
Susanti, Y., Nishikawa, H., Tokunaga, T., Obari, H., et al. (2016). Item difficulty analysis of English vocabulary questions. CSEDU, 1, 267–274.
Susanti, Y., Tokunaga, T., & Nishikawa, H. (2020). Integrating automatic question generation with computerised adaptive test. Research and Practice in Technology Enhanced Learning, 15(1), 1–22.
Susanti, Y., Tokunaga, T., Nishikawa, H., & Obari, H. (2017). Controlling item difficulty for automatic vocabulary question generation. Research and Practice in Technology Enhanced Learning, 12(1), 1–16.
Thorndike, R. (1982). Item and score conversion by pooled judgment. Test Equating, 309–317.
Trace, J., Brown, J. D., Janssen, G., & Kozhevnikova, L. (2017). Determining cloze item difficulty from item and passage characteristics across different learner backgrounds. Language Testing, 34(2), 151–174.
Vinu, E., Alsubait, T., Kumar, P. (2016). Modeling of item-difficulty for ontology-based MCQs. arXiv preprint arXiv:1607.00869
Vinu, E., & Kumar, P. (2020). Difficulty-level modeling of ontology-based factual questions. Semantic Web, 11(6), 1023–1036.
Vinu, E. V., & Kumar, P. (2015). A novel approach to generate MCQs from domain ontology: Considering DL semantics and open-world assumption. Journal of Web Semantics, 34, 40–54.
Vinu, E. V., & Kumar, P. (2017). Automated generation of assessment tests from domain ontologies. Semantic Web, 8(6), 1023–1047.
Wauters, K., Desmet, P., & Van Den Noortgate, W. (2012). Item difficulty estimation: An auspicious collaboration between data and judgment. Computers & Education, 58(4), 1183–1193.
Wohlin, C. (2014). Guidelines for snowballing in systematic literature studies and a replication in software engineering. In Proceedings of the 18th International Conference on Evaluation and Assessment in Software Engineering (pp. 1–10).
Xu, J., Wei, T., & Lv, P. (2022). SQL-DP: A novel difficulty prediction framework for SQL programming problems. In Proceedings of the 15th International Conference on Educational Data Mining (p. 86).
Xue, K., Yaneva, V., Runyon, C., & Baldwin, P. (2020). Predicting the difficulty and response time of multiple choice questions using transfer learning. In Proceedings of the fifteenth workshop on innovative use of NLP for building educational applications (pp. 193–197).
Yaneva, V., Baldwin, P., Mee, J., et al. (2019). Predicting the difficulty of multiple choice questions in a high-stakes medical exam. In Proceedings of the fourteenth workshop on innovative use of NLP for building educational applications (pp. 11–20).
Yaneva, V., Baldwin, P., Mee, J., et al. (2020). Predicting item survival for multiple choice questions in a high-stakes medical exam. In Proceedings of the 12th language resources and evaluation conference (pp. 6812–6818).
Yang, Z., Qi, P., Zhang, S., Bengio, Y., Cohen, W. W., Salakhutdinov, R., Manning, C. D. (2018). HotpotQA: A dataset for diverse, explainable multi-hop question answering. arXiv preprint arXiv:1809.09600
Yeung, C. Y., Lee, J. S., & Tsou, B. K. (2019). Difficulty-aware distractor generation for gap-fill items. In Proceedings of the 17th annual workshop of the Australasian language technology association (pp. 159–164).
Zhou, Y., & Tao, C. (2020). Multi-task BERT for problem difficulty prediction. In 2020 International Conference on Communications, Information System and Computer Engineering (CISCE) (pp. 213–216).
Funding
This work has been funded by a PhD studentship from Umm Al-Qura University, Saudi Arabia, and the Saudi Arabian Cultural Bureau (SACB). This manuscript is an extended version of the work presented at the 22nd International Conference on Artificial Intelligence in Education, 2021 (AlKhuzaey et al., 2021).
Author information
Authors and Affiliations
Contributions
All authors contributed equally to this work.
Corresponding author
Ethics declarations
Competing Interests
The authors have no relevant financial or non-financial interests to disclose.
Additional information
Publisher's Note
Springer Nature remains neutral with regard to jurisdictional claims in published maps and institutional affiliations.
Appendix
Appendix
In this appendix, Table
12 provides a summary of the studies selected as part of the selection process in the "Review Methodology / Protocol" section, with details given for each one: the feature extraction processes used; the prediction model and baseline used to evaluate the performance; the type of items (questions) used and the data-set provenance (including its domain, how it was generated, and size). Finally, the evaluation process and headline results for each are presented.
Rights and permissions
Open Access This article is licensed under a Creative Commons Attribution 4.0 International License, which permits use, sharing, adaptation, distribution and reproduction in any medium or format, as long as you give appropriate credit to the original author(s) and the source, provide a link to the Creative Commons licence, and indicate if changes were made. The images or other third party material in this article are included in the article's Creative Commons licence, unless indicated otherwise in a credit line to the material. If material is not included in the article's Creative Commons licence and your intended use is not permitted by statutory regulation or exceeds the permitted use, you will need to obtain permission directly from the copyright holder. To view a copy of this licence, visit http://creativecommons.org/licenses/by/4.0/.
About this article

Cite this article
AlKhuzaey, S., Grasso, F., Payne, T.R. et al. Text-based Question Difficulty Prediction: A Systematic Review of Automatic Approaches. Int J Artif Intell Educ (2023). https://doi.org/10.1007/s40593-023-00362-1
Accepted:
Published:
DOI: https://doi.org/10.1007/s40593-023-00362-1