
Abstract
Background
Running biomechanics is considered an important determinant of running economy (RE). However, studies examining associations between running biomechanics and RE report inconsistent findings.
Objective
The aim of this systematic review was to determine associations between running biomechanics and RE and explore potential causes of inconsistency.
Methods
Three databases were searched and monitored up to April 2023. Observational studies were included if they (i) examined associations between running biomechanics and RE, or (ii) compared running biomechanics between groups differing in RE, or (iii) compared RE between groups differing in running biomechanics during level, constant-speed, and submaximal running in healthy humans (18–65 years). Risk of bias was assessed using a modified tool for observational studies and considered in the results interpretation using GRADE. Meta-analyses were performed when two or more studies reported on the same outcome. Meta-regressions were used to explore heterogeneity with speed, coefficient of variation of height, mass, and age as continuous outcomes, and standardization of running shoes, oxygen versus energetic cost, and correction for resting oxygen or energy cost as categorical outcomes.
Results
Fifty-one studies (n = 1115 participants) were included. Most spatiotemporal outcomes showed trivial and non-significant associations with RE: contact time r = − 0.02 (95% confidence interval [CI] − 0.15 to 0.12); flight time r = 0.11 (− 0.09 to 0.32); stride time r = 0.01 (− 0.8 to 0.50); duty factor r = − 0.06 (− 0.18 to 0.06); stride length r = 0.12 (− 0.15 to 0.38), and swing time r = 0.12 (− 0.13 to 0.36). A higher cadence showed a small significant association with a lower oxygen/energy cost (r = − 0.20 [− 0.35 to − 0.05]). A smaller vertical displacement and higher vertical and leg stiffness showed significant moderate associations with lower oxygen/energy cost (r = 0.35, − 0.31, − 0.28, respectively). Ankle, knee, and hip angles at initial contact, midstance or toe-off as well as their range of motion, peak vertical ground reaction force, mechanical work variables, and electromyographic activation were not significantly associated with RE, although potentially relevant trends were observed for some outcomes.
Conclusions
Running biomechanics can explain 4–12% of the between-individual variation in RE when considered in isolation, with this magnitude potentially increasing when combining different variables. Implications for athletes, coaches, wearable technology, and researchers are discussed in the review.
Protocol registration
https://doi.org/10.17605/OSF.IO/293ND (OpenScience Framework).
Among spatiotemporal variables, ground contact time, flight time, and duty factor showed trivial and non-significant associations with running economy, while a higher step frequency was weakly associated with a better running economy. |
Lower vertical displacement and higher vertical and leg stiffness were moderately associated with better running economy, while joint angles at specific instances of the gait cycle, joint angle range of motion, peak vertical ground reaction force, mechanical work variables, and electromyographic muscle activation showed non-significant and often trivial associations with running economy. Nevertheless, some non-significant trends of at least a small magnitude were observed for some outcomes (e.g., co-contraction duration, joint angles at toe-off). |
Overall, our findings show that biomechanical variables can explain 4–12% of the between-individual variance in running economy when considered in isolation, with this magnitude potentially increasing when combining different variables. |
1 Introduction
Running economy (RE) represents the amount of oxygen or energy required to run at a given steady-state speed and is considered an important determinant of running performance, alongside other variables such as the maximum oxygen uptake (\(\dot{V}{{\text{O}}}_{2{\text{max}}}\)) and the ability to run at a high percentage of \(\dot{V}{{\text{O}}}_{2{\text{max}}}\) [1,2,3]. These three factors can collectively account for approximately 89%–95% of the variance in long-distance running performance [4], or speed at anaerobic threshold [5, 6]. However, RE has been shown to have a stronger association with running performance than \(\dot{V}{{\text{O}}}_{2{\text{max}}}\) within homogeneous running populations [7, 8], although there are some conflicting findings [9]. Further support for the importance of RE for running performance is provided by the dominance of East Africans in distance running events, which has often been attributed to their superior RE compared with other ethnicities [10, 11]. Finally, changes in RE have been shown to have strong associations with changes in running (i.e., time-trial) performance in studies that acutely alter RE, for example by shoe wear manipulations [12, 13], as well as long-term studies, in which changes in RE correlate with changes in time-trial performance [14]. While much of the previous work focused solely on male runners, it is likely similar findings would be present in female runners due to limited sex differences in RE when measured at relative intensities [15, 16].
Due to the importance of RE for running performance, knowledge about factors that can (a) influence RE, and (b) be modified to improve RE, is crucial for coaches and athletes, as well as researchers. Several factors have been shown to be associated with RE, such as anthropometrical measures, biochemical aspects, musculotendon properties, and running biomechanics [17,18,19,20,21,22]. Specifically, longer lower leg length has been associated with better RE in a group of high-level male European distance runners [18]. The proportion of type I and type II fibers has also been associated with RE, although the evidence is often conflicting [17, 19,20,21, 23]. Finally, several running-related spatiotemporal characteristics, kinematics, and kinetics have also been associated with RE [23,24,25]. Of these factors, running biomechanics is the only factor that can be modified both acutely (i.e., during a race) and chronically (i.e., over the course of a training program).
Previous work considering how biomechanics influences RE between runners has shown that 54% of the between-individual variation in RE (expressed as mLO2∙kg−1∙min−1) was explained by two kinematics and one kinetic variable [23], whilst others have shown three kinematics to explain 39% of the between-individual variance in RE (expressed as kcal∙kg−1∙km−1) [24]. In terms of modifying running biomechanics, within-subject changes in running kinematics and kinetics have been reported to explain up to 94% of the changes in RE over a 10-week running program in female runners [26, 27]. Given the modifiable nature of running kinematics and kinetics, coaches and athletes often try to optimize them in an attempt to improve RE and hence running performance. For example, studies have manipulated stride length [28, 29] and ground contact time [30] to show that small adjustments to these characteristics could be beneficial for runners whose self-selected gait deviates from a gait that would mathematically minimize oxygen or energy cost, which would thus improve RE. Similarly, some wearable technologies claim to help enhance performance by attempting to aid runners in modifying factors such as vertical displacement or footstrike pattern, often based on the implicit assumption that there is a common economical running technique for all runners (at least for the modified component) [31].
Although multiple studies have investigated the association between running biomechanics and RE, the evidence is often inconclusive or even conflicting. For instance, while some studies reported rearfoot striking to be associated with a better RE [23, 32], other studies reported fore-/mid-foot striking to be associated with a better RE [24, 33], and yet several studies reported no differences in RE between runners with different footstrike patterns [34, 35]. These conflicting findings may reflect differences in the methods used to assess running biomechanics and RE (e.g., no use of a fixed speed for all participants), or differences due to sampling variation with small sample sizes. However, they could also reflect true differences in the most economical running biomechanics between (groups of) individuals [36]. Although several reviews have covered the relationship between running biomechanics and RE [25, 31, 37, 38], they have also discussed the association of RE with other variables such as footwear or physiological factors. As a result, such reviews have provided a limited detailed critical appraisal of conflicting findings regarding the association between running biomechanics and RE. Further, they were all narrative reviews that had no systematic search and therefore could have missed relevant studies. A systematic review can highlight best practices in data collection and limitations, both of which may be used by future studies to further investigate associations between running biomechanics and RE. Additionally, a meta-analysis can weigh studies according to their precision and thereby provide a more informative estimate of the association between running biomechanics and RE. As such, a systematic review with meta-analysis that (i) provides an updated and comprehensive overview of the associations between running biomechanics and RE, and (ii) discusses potential reasons for conflicting findings would be beneficial. Therefore, the primary aim of this systematic review and meta-analysis was to synthesize the available evidence on the association between running biomechanics and RE as investigated in observational studies. Such evidence is important to inform coaches, athletes, researchers, and developers of wearable technologies on running biomechanics modification strategies, ultimately allowing for more effective improvements in RE.
Studies that investigate the correlation between RE and running biomechanics at different speeds do not always report consistent associations across speeds (e.g., [39, 40]). Further, it is well known that shoes can influence RE [41,42,43] and running biomechanics [44, 45] and shoe standardization across individuals may therefore impact the correlations between RE and running biomechanics. Similarly, the method used to express RE (i.e., oxygen or energy cost), and normalization of RE for resting or standing oxygen/energy expenditure may impact the established correlations. As a secondary aim, we therefore also explored if the association between running biomechanics and RE was modulated by running speed, the use of standardized shoes, the method used to express RE (i.e., oxygen or energy cost), and normalization of RE for resting or standing oxygen/energy expenditure. Further, given the potential influence of anthropometric characteristics [46,47,48,49] and age [50,51,52] on RE and running biomechanics, we also explored whether sample homogeneity for height, mass, and age affected the magnitude of the correlations.
2 Methods
2.1 Registry of Systematic Review Protocol
A systematic review of the literature was performed using guidelines in the Cochrane Handbook for Systematic Reviews of Interventions (version 6.0) and following the checklist for the Preferred Reporting Items for Systematic reviews and Meta-Analyses 2020 (PRISMA) [53]. The protocol was prospectively registered on the OpenScience Framework (https://osf.io/293nd/). Registration occurred after searches had been conducted, but before screening was completed.
2.2 Eligibility Criteria
To be included, studies had to (i) be cross-sectional studies that determined associations between running biomechanics and RE, or compared running biomechanics between two or more groups differing in running economy, or compared running economy between two or more groups differing in running biomechanics (e.g., footstrike comparison studies), during level (0 and 1% incline), constant-speed motorized treadmill, or overground running at sub-maximal speeds (i.e., respiratory exchange ratio < 1.0 or below lactate threshold/respiratory compensation point); (ii) be performed among healthy, non-injured humans between 18–65 years; (iii) measure biomechanical variables (spatiotemporal, kinematics, kinetics, and muscle activity outcomes were all included); (iv) be written in English; and (v) measure RE using respiratory gas analysis (both oxygen and energetic cost and linear or allometrically scaled data were included). Grey literature such as conference abstracts and theses were included only if they provided sufficient methodological details, or if the authors provided this upon request. Data on running above the anaerobic threshold/respiratory compensation point, sprinting (defined here as > 25 km∙h−1 or > 7 m∙s−1 [54]), barefoot running, running with orthopedic inserts, musculoskeletal modeling studies, running in a fatigued state, and running with additional mass were excluded. We did not apply restrictions to the training level of the sample.
2.3 Information Sources
Three electronic databases (MEDLINE via PubMed, Web of Science, and Embase) as well as two pre-print servers (SportRxiv and BioRxiv) were searched. The searches covered all dates of available literature, with the date of the last search being September 30, 2020. No limits were applied for language within each database to prevent exclusion of articles that were not assigned a language. Search alerts were created to monitor any new search results after the date of the last search up to April 1, 2023. Any articles identified by this search were assessed by two researchers (BVH and KF) for eligibility. One researcher (BVH) double-checked the included papers from the systematic search and modified the eligibility criteria to limit the scope of the review, for example, by only including studies that assessed correlations with all participants running at the same speed as opposed to a percentage of their ventilatory threshold or \(\dot{V}{\text{O}}_{2{\text{peak}}}\). Hand searching of reference lists and forward citation searching of included studies was also used to identify articles. An additional narrative search was performed on February 1, 2022, for studies that compared both RE and biomechanics with participants running in different shoes. Although we were not interested in the effect of shoes, studies comparing running economy and running biomechanics between different shoes collected all information to compute correlations between running biomechanics and RE. Therefore, the authors of these studies were emailed to request averaged correlational data across shoes between the measured running biomechanics and RE so these data could also be included in the analyses.
2.4 Search Strategy
A PICO systematic search strategy was developed for PubMed together with a research librarian, and using the Word Frequency Analyser tool (http://sr-accelerator.com/#/help/wordfreq) to suggest potentially relevant search terms [55]. The Research refiner tool (https://ielab-sysrev2.uqcloud.net/) was subsequently used to optimize the sensitivity and specificity of the search, while the Polyglot Search Translator Tool (https://sr-accelerator.com/#/polyglot) was used to adapt the search to other databases [56, 57]. The final search consisted of terms for running, running economy, and running biomechanics. The search string used for all databases is reported in Supplementary File S1 of the Electronic Supplementary Material (ESM).
2.5 Study Selection
Duplicate references were first removed using an online deduplicate tool for systematic reviews (https://sr-accelerator.com/#/libraries/dedupe) [58] and subsequent manual methods. Two authors (BVH and KF) then independently screened titles and abstracts to determine initial eligibility using systematic review software (Rayyan) [59]. Blinding of authors was used to reduce bias during this process. Finally, the authors reviewed the full texts of all articles to determine their eligibility for inclusion based on the eligibility criteria. Disagreements in eligibility decisions were resolved through discussion, or with a third reviewer (IM) when required.
2.6 Data Collection Process
Data extraction was completed independently and in duplicate by four authors (KF, IB, BVH, MC) using a standardized form that was pilot tested on five randomly selected included studies and refined accordingly through discussions with BVH and IM. The data were then merged by two authors (BVH, MC) and any discrepancies in the extracted data were resolved through discussion. Extracted data from each full-text article included (i) study identification information; (ii) study design; (iii) sample size; (iv) sex and nationality/ethnicity; (v) age, height, and body mass; (vi) running ability (e.g., weekly distance, personal best times, and RE); (vii) running surface; (viii) data collection equipment and procedures (e.g., wearable device or 3D motion capture, gas exchange equipment); (ix) running speeds; (x) footwear; (xi) data analysis approaches (e.g., verification of steady-state, corrections or no corrections of RE for resting oxygen/energy expenditure); (xii) correlations between biomechanics and RE for correlational studies, or (xiii) means and standard deviations for relevant outcome measures; and (xiv) an exact p-value, t-value, or confidence intervals when a study compared RE/biomechanics between groups differing in biomechanics/RE, respectively. If insufficient data were reported, or when more metrics were measured than reported in the results (e.g., studies that assessed duty factor but did not report correlations for contact time and flight time), the corresponding authors were contacted by email. If the corresponding author did not respond, we contacted other authors of the paper and also used different contact methods (e.g., ResearchGate). When data were not presented in tables or text and when authors did not provide the requested data, these were extracted from figures using WebPlot Digitizer (Web Plot Digitizer, V.4.1. Texas, USA) [60] where possible.
2.7 Risk-of-Bias Assessment
Although several risk-of-bias tools are available [61,62,63], most tools are developed for risk-of-bias assessment of intervention studies and therefore contain several criteria that are not relevant to the observational studies included in this review. Therefore, we modified the risk-of-bias tool developed by Hoy and colleagues [64] and used this to perform a risk-of-bias assessment independently by three authors (IJ, KF, BVH). More information on the criteria used in risk-of-bias assessment can be found in Supplementary File S2 of the ESM. The risk of bias was assessed based on the information reported in the published paper and not on information provided by the authors, except for information regarding steady-state verification as this was often missing in the papers. Disagreements in risk-of-bias assessment were resolved by discussion before the scores were merged into a spreadsheet. The mean kappa agreement between the authors was 0.95 (nearly perfect). The risk of bias was considered in the interpretation of the results by applying the Grading of Recommendations Assessment, Development and Evaluation (GRADE) system [65]. Briefly, the overall quality was initially rated as high and downgraded one level to moderate, low, or very low for each of the following limitations: total sample size < 100 participants (imprecision), high (I2 > 50%) statistical heterogeneity (inconsistency), > 50% of studies in the meta-analysis had one or more risk-of-bias items assessed to be high risk (risk of bias). For individual study outcomes, we used the same criteria but rated the risk for statistical heterogeneity down if there was only one study reporting on a specific outcome.
2.8 Statistical Analysis
2.8.1 Effect Size and Synthesis of Studies Providing Correlations
Pearson correlation coefficients between running biomechanics and RE were considered the primary effect size of interest. If studies reported a Spearman’s rank correlation, we converted this to a Pearson correlation using Eq. 1 as Spearman’s correlations are typically smaller than Pearson correlations [66]:
where rs is Spearman’s rank correlation.
The sampling distribution of (Pearson) correlation coefficients is increasingly non-normal (i.e., skewed) with stronger correlations because it is bound from − 1 to 1 [67]. Correlations were therefore transformed to Fisher’s z as detailed previously [67] to better approximate a normal distribution. The z-transformed correlation coefficient was then meta-analyzed to obtain a weighted point estimate with 95% confidence intervals, and these were back-transformed into a Pearson correlation coefficient using an integral z-to-r transformation [68] to aid interpretation. Correlations were interpreted as < 0.1 trivial; 0.1–0.29 small; 0.30–0.49 moderate; 0.5–0.69 large; 0.7–0.89 very large; 0.9–0.99 nearly perfect [69].
The synthesis of z-scores across studies was done using a random-effects model, with a separate random-effects meta-analysis being performed when two or more studies reported on the same outcome. A substantial proportion of studies included in this review provided two or more correlation coefficients (e.g., at multiple speeds). Two effects from the same study (e.g., correlation coefficients between the two variables at different speeds) are likely more similar than two effects from two different studies due to the use of the same participants and data collection and analysis procedures within each study. The inclusion of multiple effects from the same study would therefore violate the assumption of independence in traditional meta-analyses. To account for this, we conducted a three-level meta-analysis (i.e., a multi-level model). By using a three-level structure we accounted for three different variance components distributed over the three levels in the model. This included sampling variance of the extracted effect sizes at level one, variance between the extracted effect sizes within the same study at level two, and variance between studies at level three. We used cluster-robust variance estimation methods [70] with small-sample adjustments [71] to adjust the within-study standard errors for correlations between effect sizes. To do so, the method required an estimate of the mean correlation between all pairs of within-study effect sizes (ρ), which was used to correct the between-study sampling variance (τ2) for statistical dependencies [72]. Since information about the sampling correlations among effect sizes was limited, this correlation was set to 0.6 [72]. Sensitivity analysis with correlations of 0.4 and 0.8 showed no differences in the outcomes of the meta-analyses.
The inverse of the standard error was used to determine the weight (i.e., contribution) of each effect (i.e., correlation coefficient) in the meta-analysis. Within the multi-level meta-analysis implemented, the standard error (and thus weight) of each study was determined by a combination of within- and between-study heterogeneity in effect sizes, the correlation between effect sizes within each study, and the sample variance of each effect size as described in Eq. 2 [73]:
where \({w}_{j}\) is the weight of study j, \({k}_{j}\) the number of effect sizes within study j, \({\widehat{t}}^{2}\) the between-study heterogeneity, \(\rho\) the correlation between the within-study effects, \({\widehat{\omega }}^{2}\) the within-study heterogeneity, and \({\sigma }_{j}^{2}\) the sample variance of each effect. The sample variance of each effect (i.e., of the Fisher’s z-transformed correlation) was in turn directly proportional to the sample size as shown in Eq. 3 [67]:
where n is the sample size.
Within this weighting procedure (Eq. 2), a large between-study variation in effect sizes will result in relatively more equal weights given to different studies. Further, when there is large within-study variability in effect sizes, relatively more weight will be given to studies that provide multiple effect sizes because the average estimate from such a study will yield a more accurate estimate of the real effect than a study that provides only one effect. This weight will, however, also depend on the correlation assumed between the effect sizes. Specifically, if the correlation between within-study effect sizes is high, averaging highly correlated estimates does not substantially improve the precision relative to using one effect size. Finally, effect sizes with small variance (i.e., large sample size, see Eq. 3) will receive more weight than effect sizes with larger variance.
All model parameters were estimated using the restricted maximum likelihood estimation method. Tests of individual coefficients in all models, and their corresponding confidence intervals, were based on a t-distribution. Multilevel meta-analyses and meta-regressions were performed in R (version 4.2.0, R Foundation for Statistical Computing) [74] using the metafor package [74], whereas the clubSandwich package [72] was used to implement the robust methods with correlated and hierarchical effects.
The heterogeneity of the correlations across studies was assessed using the I2 statistic obtained from the multi-level model. Briefly, the variance components of the pooled correlation coefficient were decomposed into sampling variance of the observed correlations (level 1), and variance within (level 2) and between studies (level 3). This I2 (level 3) represents the percentage of the total variation in estimated effects across studies due to heterogeneity rather than chance and was interpreted as small (I2 < 25%), moderate (I2 = 25–49%), and high (I2 > 50%) [75]. We only report and use the I2 (level 3) for the GRADE criteria (see Sect. 2.7).
Meta-regressions were performed when at least ten effects (i.e., correlations) were available for an outcome [67, 76]. Meta-regressions were performed with running shoes (i.e., standardized vs non-standardized shoes), RE units (i.e., oxygen or energy cost), and normalization of RE (i.e., corrected for resting or standing oxygen/energy expenditure) as categorical outcomes when at least two studies reported on each moderator. Categorical moderators were dummy coded (e.g., oxygen cost = 1, energy cost = 0) to allow the regression coefficient to be interpreted as the difference in effect size between two levels of the moderator. If studies reported correlations between running biomechanics and energy cost expressed as caloric units and oxygen cost, we used the caloric units for all analyses. We performed a sensitivity analysis to investigate the difference in correlations between running biomechanics and RE with RE expressed as oxygen or caloric cost to investigate the impact of this decision (Supplementary File S3, see ESM). When no specification of shoe standardization was reported, we assumed participants ran in non-standardized shoes. Similarly, RE was assumed to be not corrected for resting or standing oxygen/energy expenditure if this was not specifically reported. Meta-regressions were performed with speed, and the coefficient of variation in height, mass, and age as continuous outcomes. The coefficients of variation for height, mass, and age were determined from the reported mean and standard deviation in each study and were used as continuous outcomes because the homogeneity of a group on these outcomes could affect the magnitude of the correlations given the potential influence of anthropometric characteristics [46,47,48,49] and age [50,51,52] on RE and running biomechanics. If there were sufficient studies to perform a multi-variable meta-regression (i.e., at least 10 effects per moderator), we combined variables in the following fixed order: (a) RE units, (b) shoe standardization, (c) speed, (d) normalization of RE, while always ensuring at least 10 effects were available per moderator.
Leverage, outlier, and influential case diagnostics were conducted for all meta-regression models by examining hat, Cook’s distance, and studentized residuals [77,78,79]. Cases exceeding three times the mean value for hat and Cook’s distance, as well as an absolute studentized residual > 3, were considered influential. These red-flagged estimates (i.e., correlation coefficients) were then dropped from the dataset, and meta-regression models were refitted without them. If the interpretation of the meta-regression model did not change after excluding influential estimates, the original model was retained. In contrast, if the interpretation of a given meta-regression model changed as a consequence of removing influential cases, the model without influential cases was retained and reported instead.
2.8.2 Effect Size and Synthesis of Studies Providing Between-Group Differences
Some studies compared running biomechanics and RE between two groups running at a similar speed and did not report a correlation coefficient, but instead reported mean and standard deviations for RE and some biomechanical outcomes of each group, as well as a statistic representing the between-group difference. Specifically, six studies reported or provided RE data for runners running with a rearfoot or mid/forefoot strike. As the RE data were reported in different units, standardized mean differences for independent groups were computed using procedures outlined by Borenstein et al. [67]. Briefly, the RE data in the rearfoot strike group were subtracted from the mid/forefoot strike group to determine the mean difference, which was then divided by the pooled within-group standard deviation to determine the standardized mean difference. The resulting standardized mean differences and their variance were corrected for small sample bias using a correction factor [67].
After the effect sizes (i.e., standardized mean differences) for each comparison were calculated, a meta-analysis was performed using similar procedures as for the correlational data reported in Sect. 2.8.1. Briefly, a cluster-robust variance estimation method [70] with small-sample adjustments [71] was used to adjust the standard error for the overall standardized mean difference, with clustering at the study level. The sampling correlation between the effect sizes was assumed to be 0.6. In addition, the inverse of the standard error was used to weigh each effect as detailed in Eq. 2. Note, however, that the sample variance of each effect was determined for standardized mean differences of independent groups (as opposed to correlations) as detailed by Borenstein and colleagues [67]. Finally, the model’s parameters were estimated using the restricted maximum likelihood estimation method and p-values and confidence intervals were based on a t-distribution.
2.8.3 Data Reduction
The variability in designs and outcomes among eligible studies required several decisions to ensure the data could be appropriately combined for meta-analysis. These decisions are specified in Supplementary File S4 (see ESM). Most importantly, joint or segment angles were expressed in the same reference frame (e.g., higher values representing higher flexion in all studies for a given outcome) so that correlations were also directionally consistent. Two authors (BVH and IM) were involved in checking the reference frame assignment to ensure accuracy. Further, step and stride frequency were combined in one analysis, and we refer to stride frequency throughout the paper to ensure consistency. A similar approach was used for step and stride length. Further, while most studies reported vertical oscillation during a stride or step (i.e., including the flight phase), some studies reported only on the stance phase vertical displacement. Because step vertical oscillation and stance vertical displacement have highly similar correlations with RE [24], we combined all outcomes in one analysis and refer to these as vertical oscillation for consistency. While different methods were used to classify footstrike patterns (e.g., foot–ground angle, footstrike index), we will collectively refer to footstrike angle in Sect. 3 and Sect. 4 as this was the dominant method used in the included studies.
2.9 Publication Bias
Publication bias was not assessed because there was only a small number of studies included in most meta-analyses and we did not see any reason why studies reporting no correlation between RE and biomechanics would be less likely to be published than studies finding a significant correlation. Additionally, we included studies that did not directly aim to assess the relationship between running biomechanics and RE. Therefore, these studies are unlikely to be affected by publication bias. Finally, we also reduced the potential impact of publication bias by checking the consistency between the measured biomechanical outcomes, and reported biomechanical outcomes in Sect. 3.
3 Results
3.1 Search Results
The initial literature search yielded 2014 records through electronic databases (Fig. 1). Title and abstract screening resulted in exclusion of 1570 records. After screening 58 records for inclusion/exclusion criteria, 17 records were excluded, resulting in 41 articles being identified from the original search. A combination of forward citation searching for articles that passed title/abstract screening and monitoring of newly published literature using the search alerts and regular manual checking of relevant journals yielded an addition 15 records for consideration in the review. Five of these were subsequently excluded because the authors did not provide the requested data, resulting in a total number of 51 articles included in the review.

PRISMA flow-diagram
3.2 Study Characteristics
Detailed study characteristics are reported in Table 1. All 51 studies included in this review provided either correlations between running biomechanics and RE (38 studies), compared RE between groups differing in running biomechanics (e.g., footstrike angle; 5 studies [32, 34, 35, 80, 81]), compared running biomechanics between groups differing in RE (5 studies [23, 82,83,84,85]), or provided both correlations and between-group comparisons (3 studies [81, 86, 87]). The total number of participants in the included studies was 1115 (904 males, 227 females). Note that three studies used the same sample [88,89,90], but analyzed different biomechanical outcomes. The sample size of these studies was counted only once for the overall sample size calculation. Of the 51 included studies, 35 included only males, 2 only females, 13 both males and females (only one presented sex-disaggregated data), and one did not specify the sex of included participants. Fifty studies recruited participants that were runners or physically active in other sports, and one study did not specify the physical activity of the participants [40]. Running speeds used for RE assessment ranged from 2.22 m∙s−1 [40, 91] to 5.56 m∙s−1 [92]). Sixteen studies standardized shoe wear, while 38 studies did not, or at least did not explicitly report that they had.
Twenty-seven studies assessed RE during one fixed speed, and 24 studies assessed RE during two or more speeds. In one study [93], male and female participants ran at a different constant speed. RE was expressed in mlO2∙kg−1∙km−1 in nine studies, mlO2∙kg−1∙min−1 in 23 studies, and kcal∙kg−1∙km−1 in seven studies. Other commonly employed units for RE were W∙kg−1 (k = 4), J∙kg−1 (k = 1), J∙kg−1∙m−1 (k = 5), J∙kg−1∙min−1 (k = 2), mLO2∙kg−0.75∙km−1 (k = 1), and mlO2∙kg−0.75∙min−1 (k = 2). Several studies reported RE in multiple units, and thus the total is higher than 51. Forty studies described methods used to check for a steady state, which included verification of the respiratory exchange ratio below 1.0 (22 studies [24, 39, 40, 80, 81, 86, 88,89,90, 93,94,95,96,97,98,99,100,101,102,103,104], measurement of blood lactate concentration (12 studies [23, 24, 40,41,42,43, 82, 92, 105,106,107,108]), and visual inspection of a plateau in the oxygen consumption (\(\dot{V}{\text{O}}_2\)) and/or carbon dioxide expired \((\dot{V}{\text{CO}}_2 )\) data (21 studies [34, 35, 39, 80, 82, 84,85,86, 88,89,90, 94,95,96, 98, 99, 106, 109,110,111,112]). Most studies (k = 18) employed multiple methods to check for steady state [32, 83, 87, 113,114,115,116,117,118,119,120], while 11 studies did not report any steady-state verification. Six studies subtracted resting (3 studies [23, 91, 111, 113]) or standing (3 studies [24, 81, 86]) \(\dot{V}{\text{O}}_2\) or energy expenditure from running \(\dot{V}{\text{O}}_2\) or energy expenditure. Most studies (k = 44) did not report whether such a subtraction was performed, and one study [101] explicitly stated that no subtraction was done. Four studies used allometric scaling when normalizing RE for body mass [97, 99, 117, 120] while 47 studies used linear scaling. Finally, six studies used the Péronnet equations to compute the energetic cost from \(\dot{V}{\text{O}}_2\) and \(\dot{V}{\text{CO}}_2\), one study used the Brockway equation, three referred to Fletcher [121], who used the Lusk equation, one study used the Jeukendrup equation [122], one study used a method described by Kyröläinen based on blood lactate [111], and one used the Weir equation [123].
Thirty-one studies assessed running biomechanics and RE simultaneously, while 14 studies performed these assessments separately. The remaining six studies did not specify these components. Thirty-three studies used three-dimensional motion capture and/or an instrumented treadmill or ground-mounted force plate to measure running biomechanics, four studies used photoelectronic cell systems, contact laser platforms, or an optical measurement system. The remaining studies used accelerometry (k = 2), two-dimensional measurements (k = 10), and other methods such as surface electromyographic electrodes (k = 5) or electro goniometers (k = 1).
3.3 Risk of Bias in Studies
The risk-of-bias score of included studies is reported in Fig. 2. Most studies were at moderate or high risk of bias for not clearly describing the inclusion and exclusion criteria. Conversely, only a few studies were at high risk of bias for the data collection and analysis procedures.

Risk-of-bias assessment for all included studies
3.4 Spatiotemporal Outcome Measures
Among the spatiotemporal outcomes investigated (contact time [Fig. 3], flight time, swing time, stride time, duty factor, stride length, normalized stride length, and stride frequency), only stride frequency was significantly associated with RE (Table 2, Figs. 4, 5, 6, and 7). The results of the meta-regressions are detailed in Supplementary File S5 (see ESM) and two meta-regression examples are shown in Figs. 5 and 7.
Random-effects meta-analysis of the correlation between ground contact time and running economy. Positive correlations indicate that longer contact times are associated with a higher oxygen or energy cost of running, or that shorter contact times are associated with a lower oxygen or energy cost (i.e., longer is higher or shorter is lower), while negative correlations indicate that a shorter contact time is associated with a higher oxygen or energy cost or that a longer contact time is associated with lower oxygen or energy cost (i.e., longer is lower or shorter is higher). CI confidence interval. Note that the correlation coefficients are depicted on a non-linear scale to ensure symmetric confidence intervals after the back transformation procedure
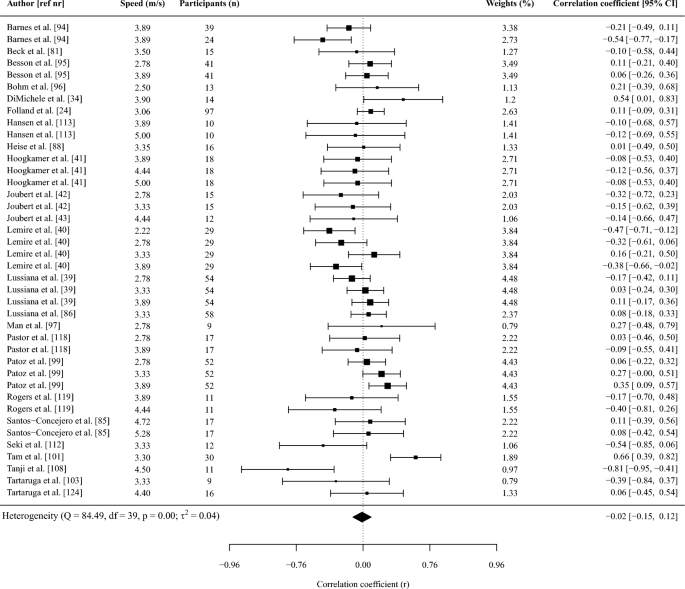
Random-effects meta-analysis of the correlation between stride frequency and running economy. Positive correlations indicate that higher step/stride frequencies are associated with a higher oxygen or energy cost of running or that lower step/stride frequencies are associated with a lower oxygen or energy cost (i.e., higher is higher or lower is lower), while negative correlations indicate that a lower step/stride frequency is associated with a higher oxygen or energy cost or that a higher step/stride frequency is associated with lower oxygen or energy cost (i.e., higher is lower or lower is higher). CI confidence interval. Note that the correlation coefficients are depicted on a non-linear scale to ensure symmetric confidence intervals after the back transformation procedure

Meta-regression of the correlation between stride frequency and running economy as a function of running speed and with running economy expressed as the energetic or oxygen cost. The meta-regression also included shoe standardization as a categorical covariate. The solid line represents the mean effect, while the dashed lines indicate the 95% confidence intervals. Circles represent individual correlations, with the size of the circle representing the weight of the effect to the meta-regression. The stacked bars on the right side depict the distribution of the categorical data (i.e., oxygen or energy cost)
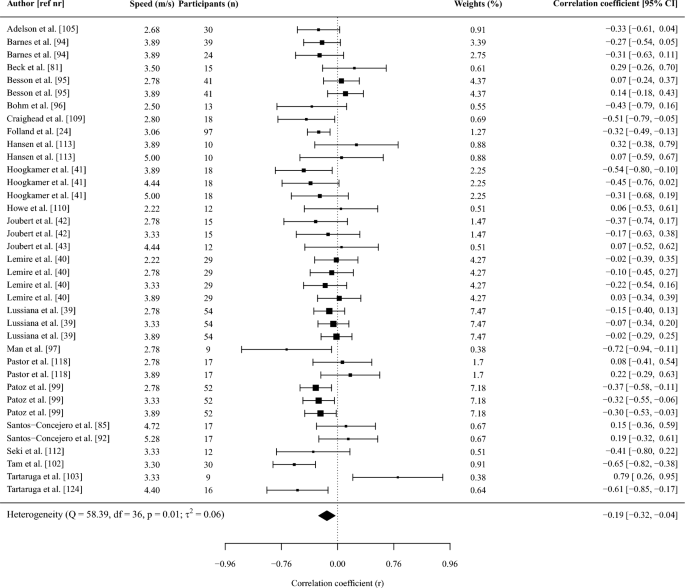
Random-effects meta-analysis of the correlation between duty factor and running economy. Positive correlations indicate that higher duty factors are associated with a higher oxygen or energy cost of running or that lower duty factors are associated with a lower oxygen or energy cost (i.e., higher is higher or lower is lower), while negative correlations indicate that a lower duty factor is associated with a higher oxygen or energy cost or that a higher duty factor is associated with lower oxygen or energy cost (i.e., higher is lower or lower is higher). CI confidence interval. Note that the correlation coefficients are depicted on a non-linear scale to ensure symmetric confidence intervals after the back transformation procedure

Meta-regression of the correlation between duty factor and running economy as a function of running speed. The solid blue line represents the mean effect, while dashed blue lines indicate the 95% confidence intervals. Circles represent individual study correlations, with the size of the circle representing the weight of the study in the meta-regression
3.5 Vertical Oscillation
A higher vertical oscillation of the pelvis/trunk/center of mass showed a moderate, significant association with a higher oxygen/energetic cost (poorer RE; r = 0.35, Supplementary File S6, Fig. S1, see ESM).
3.6 Kinematic Outcomes
Ankle, knee, and hip angles at different phases in the gait cycle and their range of motion were not significantly associated with RE (Table II, Supplementary File S6, Figs. S4–S6, see ESM). Similarly, segment angles relative to the global reference frame were not associated with RE (Table 2). Meta-regression results are detailed in Supplementary File S5 (see ESM).
3.7 Kinetic Outcomes
Peak vertical ground reaction forces were not significantly associated with RE overall (r = − 0.02, or when considering absolute r = − 0.27 or normalized r = 0.28 outcomes separately; Table 2). Meta-regression was not undertaken for these outcomes due to insufficient effects. Similarly, a higher vertical and leg stiffness were both associated with a moderate and small significant reduction in oxygen/energetic cost (r = − 0.31 and − 0.28, respectively, Supplementary File S6, Figs. S2–S3, see ESM). The results of the meta-regressions are detailed in Supplementary File S5 (see ESM).
One study further reported a higher anterior–posterior and medio-lateral impulse to be non-significantly associated with a higher energy cost (r = 0.25 and 0.37, respectively) [88]. Storen and co-workers [120] reported no significant correlations between the braking or propulsive forces (correlation magnitudes not reported), but runners with a higher oxygen cost showed a higher sum of the horizontal and vertical forces (r = 0.66). Similarly, Williams and Cavanagh [23] reported the group with the lowest oxygen cost exhibited lower horizontal braking forces than the group with medium oxygen cost, which in turn exhibited lower braking forces than the group with high oxygen cost, although no differences reached statistical significance. One final study reported a trivial correlation between average braking forces and energy cost (r = 0.07), but a moderate correlation between average propulsive force and energy cost (r = 0.30) [81].
3.8 Mechanical Work Outcomes
Total, negative, or positive mechanical work were not significantly associated with RE (Table 2). Meta-regression was not undertaken due to insufficient effects.
3.9 Electromyographic Outcomes
Surface electromyographic activation of the gluteus maximus, soleus, gastrocnemius medialis/lateralis, rectus femoris, vastus lateralis, biceps femoris long head, and tibialis anterior during stance was not significantly associated with RE (Table 2). Meta-regression was not undertaken due to insufficient effects.
3.10 Between-Group Comparisons
The only between-group comparison with sufficient data for meta-analysis was footstrike angle. Meta-analysis showed that RE did not significantly differ between footstrike classified into rearfoot or midfoot/forefoot strikers (standardized mean difference = − 0.02, Table 2, Supplementary File S6, Fig. S7, see ESM).
3.11 Sensitivity Analysis
We performed an informal sensitivity analysis to compare whether the correlations between various biomechanics and RE were affected by the expression of RE as oxygen or energetic cost within the same study by comparing the correlation coefficients (Supplementary File S3, see ESM). These analyses revealed that the correlations were very similar with both analyses (mean difference of r = − 0.03 and 0.01 for contact time and cadence, respectively). Additionally, we compared the sensitivity of the correlation coefficients to two different stoichiometric equations. This resulted in negligible mean differences of r = 0.01.
4 Discussion
The primary aim of this systematic review and meta-analysis was to synthesize the available evidence on the association between running biomechanics and RE as investigated in observational studies. In the following sections we first discuss the most important findings from the meta-analyses and (to a lesser extent) individual study results, and we discuss potential biomechanical/physiological mechanisms for each of the observed effects. We also briefly compare the associations found in our review of observational studies with findings from longitudinal studies that investigated changes in running biomechanics and RE, and with studies that investigated associations between running biomechanics and running performance. Finally, we provide practical implications of our findings for coaches, researchers, and developers of wearable technology. Note that we also discuss non-significant correlations as ‘trends’ when their magnitude is at least small (r > 0.1) and when the correlation is consistent with other significant biomechanical outcomes. For example, a larger vertical oscillation could result from a larger knee flexion during stance, but the latter may not be significant due to the small number of studies assessing this outcome.
4.1 Spatiotemporal Outcomes
Moderate GRADE evidence showed that a higher stride frequency was weakly but significantly (r = − 0.20) associated with a lower energetic cost of running (Table 2, Fig. 4). Between-group studies included in this review that compared cadence between groups differing in RE also reported a higher cadence in the more economical group [83], or no difference between groups [82]. At the fixed running speed used in all included articles, a low stride frequency means that runners adopt a long stride length, which can lead to higher braking impulses [125]. Greater braking during the initial phase of the stance phase necessitates a larger horizontal propulsive force production during the remaining stance phase to reaccelerate the center of mass to maintain running speed. The generation of propulsive force involves energetically expensive concentric contractions and is an important component of the metabolic cost of running [24, 126]; see also Sect. 4.4. These mechanisms may therefore partly explain the association between a higher stride frequency and lower energy cost. However, the small magnitude of the correlation between stride frequency and RE should be noted. The small magnitude observed may be due to differences in anthropometrics (e.g., height and body mass) between individuals that in turn can cause differences in the most economical stride frequency between individuals [46,47,48,49], and thereby reduce the magnitude of the correlation. We explored whether more homogeneous groups showed stronger correlations between stride frequency and RE by performing a meta-regression with the coefficients of variation in height or body mass as continuous predictors (Supplemental File S5, see ESM). However, this indicated that the correlation between stride frequency and RE did not differ with smaller coefficients of variation in height and body mass (i.e., reflecting a more homogeneous group). Therefore, a higher stride frequency is weakly associated with better RE, but the homogeneity of anthropometrics across studies does not appear to alter the strength of the observed relationship. Running speed and running economy units both significantly moderated the correlation between cadence and RE (Supplemental File S5, Fig. 5), such that the correlation became larger with increases in speed, and decreased with RE expressed as oxygen cost.
Based on (a) the significant association found between stride frequency and RE, and (b) the inverse relationship between stride length and stride frequency at a given running speed, one would expect a shorter stride length also to be associated with a lower energy cost. While the direction of the effect did indeed suggest shorter stride lengths were associated with a lower energy cost (r = 0.12; moderate GRADE evidence), the association was not significant. This is likely due to the ~ 65% smaller sample size and thus lower statistical power in the stride length analysis compared with the stride frequency analysis (Table 2). A similar reason likely explains the lack of significant associations for stride length normalized to height. Interestingly, the correlation for normalized stride length was approximately double compared with stride length (r = 0.27; moderate GRADE evidence). This suggests that individuals with short stride lengths relative to their height might have better RE than those with long stride lengths relative to their height. Stride length normalized to height may therefore be more relevant to inform on running economy, and potentially presents a useful variable to modify when optimizing running economy, although further research is required to substantiate this notion.
Stride time, ground contact time (Fig. 3), flight time, and swing time were not significantly and mostly trivially associated with RE (moderate–high GRADE evidence). One between-group study included in this review also found no differences in these outcomes between groups differing in RE [82]. Combining these findings with the significant correlation observed between stride frequency and RE suggests that the higher stride frequency seen in more economical runners may be achieved using different combinations of contact and flight times that are equally economical. This supports the notion that contact time can be self-optimized and operates within a narrower optimal range than stride frequency [30]. Mechanistically, the trivial association between contact time and RE may be because a shorter contact time requires a faster force production, which in turn requires a higher fascicle/fiber shortening velocity and this increases energy costs [22, 127]. Conversely, a longer contact time may lead to more dissipation of stored elastic energy into heat (e.g., [128]), and may reflect a longer braking phase and thus higher braking impulse, both of which require metabolically expensive concentric muscle action to generate propulsive force to maintain a similar running speed. The trivial correlation between contact time and RE is notable as it is often believed that a short contact time is reflective of better RE based on the findings of several studies in highly trained runners [100, 129]. However, these studies either did not standardize running speed [129], or measured RE above the anaerobic threshold [100], and our findings suggest that this effect is not observed when running speed is standardized and when measured at a metabolic steady state.
In line with the findings for contact and flight time, duty factor (i.e., contact time/[contact time + flight time]; reflecting the proportion of stride time spent on the ground) was also not significantly associated with RE (high GRADE evidence, Table 2). Mechanistically, this may be because runners with a low duty factor (e.g., long flight time) rely more on a larger vertical displacement (which increases energy cost), but also better use elastic energy (i.e., optimization of the spring-mass model; which reduces energy cost), while runners with a high duty factor rely more on energetically costly forward propulsion, but also limit energetically costly vertical displacement [39, 130]. The net effect is therefore that both lower and higher duty factors can be economical. Whether a runner adopts a lower or higher duty factor may in turn reflect differences in musculotendinous properties. Runners with a low duty factor (longer flight time, shorter contact time) have, for example, been shown to exhibit a higher rate of force development, muscle activation, and H-reflex of the soleus compared with runners with a high duty factor [131]. Runners may therefore simply self-organize to the technique that is most economical for their musculotendinous properties with sufficient training (e.g., [27]). Simply altering contact or flight time (and thus duty factor) without determining if a runner already produces a metabolically optimized running gait may force them to use a technique that is not economical for their current musculotendinous properties and could reduce rather than increase performance. Further research is required to investigate whether alterations in musculotendinous properties could allow individuals to use a different running technique that in turn is more economical.
Our meta-regression, however, indicated that the correlation between duty factor and RE became significantly larger (from moderate negative correlations to small positive correlations) with increases in running speed (Supplementary File S5, see ESM). This suggests that high duty factors (shorter contact times and/or longer flight times) are associated with lower energy costs at relatively slower speeds, but higher energy costs at higher speeds. This may be explained as follows: at relatively slow running speeds, the contact time is relatively long (e.g., 275 ms at 2.78 m∙s−1), and this leads to more dissipation of elastic energy into heat as compared with shorter contact times [128]. By adopting a relatively shorter contact time and increasing the flight time at these slow speeds, less elastic energy may dissipate, thus benefiting energy costs. Conversely, at higher speeds, the contact time is already shorter (e.g., 175 ms at 4 m∙s−1) and further reductions in contact time may not yield much benefit from an elastic energy dissipation perspective, while they may be more energetically costly from a fascicle shortening velocity perspective, thus reducing the benefit of a high duty factor. Nevertheless, further research is required to substantiate these hypotheses.
Findings from individual studies showed that contact time imbalance was not significantly associated (r = − 0.05) with RE in one study [43]. Another study reported no correlation between different symmetry indexes and RE [91]. These findings are in contrast to those of a study not included in this review that found contact time imbalance to be strongly associated with poorer RE [132]. However, this study did not standardize speed, thus suggesting running speed may have confounded this association. Only one study reported on step width, with this being not significantly different between groups differing in RE [23]. This latter finding is in line with the relatively small energetic cost for maintaining mediolateral balance during running, which is estimated to account for only ~ 2% of the total energetic cost [133].
4.2 Vertical Oscillation
Moderate GRADE level evidence showed that a higher vertical oscillation of the pelvis/trunk/center of mass during either a complete stride or stance phase was moderately associated with a higher energetic cost (poorer RE; r = 0.35, Supplementary File S6, Fig. SI, see ESM). One study identified by our systematic search compared vertical displacement between groups of runners differing in RE and found vertical oscillation also to be lower in more economical groups, although the difference was not significant [23]. From a physiological perspective, the correlation between vertical oscillation and RE can be explained by a higher vertical oscillation requiring recruitment of a larger muscle volume to produce a larger vertical impulse, which increases energy cost. From a mechanical perspective, higher vertical oscillation will contribute to greater work needing to be performed against gravity, and thus a greater energetic demand being placed on a runner. Meta-regression analyses showed no moderation of the effect with RE expressed as oxygen cost or energetic cost, or gross versus net oxygen/energetic cost (Supplemental File S5, see ESM). Similarly, meta-regression showed that running speed did not significantly moderate the association between RE and vertical oscillation (Supplementary File S6, Fig. SI, see ESM), although there appeared to be a trend within each study for stronger associations with increases in speed (Supplementary File MOESM1, Fig. SI, see ESM). Meta-regression with standardized versus non-standardized shoes showed that the correlation between RE and vertical oscillation increased when shoes were standardized, suggesting that some shoe features such as the degree of cushioning may affect vertical oscillation and thereby RE. In support of this, removing shoe cushioning has been shown to reduce vertical oscillation and improve RE [134] and net mechanical efficiency [135]; this may explain the smaller correlation when shoes were not standardized. When vertical oscillation was normalized to step length, the correlation became non-significant, yet the magnitude of the effect was in the same direction (i.e., larger normalized step length is higher energy cost; r = 0.20). The absence of a significant effect likely reflects the small number of studies (k = 2) that measured this outcome. The slightly smaller magnitude of the normalized vertical oscillation suggests that part of the higher energy cost with higher vertical oscillation is related to the resulting larger step length and thus higher oscillation during the flight phase, while the remaining part results from larger vertical displacement during the stance phase. Collectively, these different measures therefore all reflect that a smaller vertical oscillation is typically associated with a better RE.
4.3 Kinematic Outcomes
A larger peak knee flexion and knee flexion range of motion were non-significantly associated with a higher energy cost (r = 0.27 and 0.23, respectively, Table 2, Supplementary File S6, Fig. S5 [see ESM], moderate and high GRADE evidence, respectively). The lack of significant associations may reflect the relatively small number of studies that investigated these outcomes and considerable inter-study variability (potentially introduced by non-standardized shoes, which may impact lower extremity stiffness [136,137,138]). Further, one between-group study included in this review found no differences in knee angle between groups of runners differing in RE, but shoe wear was not standardized [82]. Mechanistically, a higher knee flexion angle or range of motion during mid-stance creates a larger knee extension moment, meaning greater muscle force needs to be produced potentially through recruiting a larger muscle volume, which in turn may increase energy costs. A small training study supports this notion, with reductions in the knee extensor moment as runners became more economical [26]. Further, studies that had individuals adopt larger knee flexion during running also reported increases in energy cost [139]. As a larger knee flexion (range of motion) is expected to increase vertical displacement during stance, this may also partly explain the association between vertical displacement and RE. Nevertheless, some findings suggest that the knee extensors may function on the ascending limb of the force–length curve at knee angles similar to those observed during the stance phase in running [140], and a slightly larger knee flexion angle could therefore result in more force potential, which reduces activation and energy cost. This may explain why one study that compared groups of runners differing in RE found a trend towards a larger peak knee flexion angle in the more economical group, although the difference was not significant [23]. The knee angle at footstrike and toe-off both showed trivial and non-significant associations with the energetic cost of running (Table 2), suggesting the trend for a higher energy cost with a larger knee flexion range of motion may be due to a variable combination of joint angles, with some individuals landing with a relatively extended knee at footstrike followed by large flexion, while other individuals may instead extend their leg more at toe-off following large flexion. One study further reported a significant correlation (r = 0.41) between a higher peak knee flexion angle during the swing phase of running and a higher energy cost [24]. While a larger knee flexion reduces the leg moment of inertia, it may also speculatively delay the coupled swing-leg retraction of the front leg, with this delay potentially leading to higher braking forces and thereby a higher energetic cost than the larger moment of inertia.
Similar to the knee, a larger hip range of motion during the stance phase showed a small but non-significant association with a higher energy cost (r = 0.21; high GRADE evidence; Table 2), although one between-group study included in this review showed no differences between groups differing in RE [82]. Mechanistically, a larger hip range of motion requires either a larger flexion at or just after initial contact, or greater extension at toe-off. However, the hip angle at footstrike and toe-off both showed trivial and non-significant associations with RE (Table 2), suggesting runners may use a combination of strategies to realize this larger range of motion. Alternatively, the degree to which runners flex their hips after initial contact may better correlate with RE as this could reflect a high braking impulse, although this contention requires further research. Hip and knee angles at footstrike are often measured to infer whether an individual is ‘overstriding’ based on the premise that this increases injury risk and decreases RE (e.g., [125, 141]). However, our findings do not support that either joint angle in isolation is associated with RE. Moreover, a measure that integrates both angles into one outcome (i.e., heel to the extrapolated center of mass horizontal, anterior posterior distance) also showed a trivial association (r = 0.04) with RE, thus questioning whether a combination of both angles is more sensitive for inferring RE than either measure alone. Similar trivial associations (r = − 0.09, 0.06, and 0.11 at 2.78, 3.33, and 3.89 m∙s−1) were reported by one study when heel to the center of mass distance was normalized to leg length [39]. Likewise, shank or thigh angles relative to the global reference frame were also not significantly associated with RE (Table 2), with one study even showing a more horizontal shank angle in more economical runners [23]. Collectively, these findings suggest that lower limb orientation at initial contact plays only a minimal role in contributing to RE. Future research could explore whether a combination of angles and velocities at initial contact may better correlate with RE than joint angles alone. Moreover, future studies could also investigate if biomechanical outcomes at midstance may better relate to RE than at initial contact.
The ankle angles at footstrike, toe-off, or the peak during stance were all not significantly associated with RE (Table 2, Supplementary File S6, Figs. S4–6, see ESM), although a more plantar flexed ankle at toe-off showed a small non-significant association with a higher energy cost (r = 0.13). This is in line with previous findings whereby more economical runners showed smaller ankle plantar flexion at toe-off [23] and reductions in ankle plantar flexion at toe-off were observed when runners became more economical [27]. Positioning the ankle in less plantar flexion may optimize the force–length potential [142] and thereby both reduce activation-related energy cost and aid the production of horizontal force during the propulsive phase [27], hence making it an economical running characteristic. Additionally, larger plantar flexion angles at toe-off may require a metabolically costly concentric muscle action and thereby explain the small association with higher energy cost. Finally, a larger plantar flexion at toe-off may result in a larger vertical oscillation as runners are using their plantar flexors to push upwards, and this may also partly explain the association between vertical oscillation and RE.
Our between-group meta-analysis showed no significant differences in RE between rearfoot or fore/midfoot strikers (Hedges’ g = − 0.02; moderate GRADE evidence, Table 2, Supplementary File S6, Fig. S7, see ESM). In line with these findings, two studies included in this review reported a trivial correlation (r = 0.08 and 0.10) between RE and footstrike angle [24, 86]. Therefore, these findings do not support the use of footstrike patterns to infer RE as used by some coaches [143]. Mechanistically, the similar RE between different footstrike patterns can be explained by the reduced muscle energy cost associated with lower fascicle contraction velocity in fore/midfoot strikers being counteracted by greater muscle forces during early ground contact, thus yielding no net benefit to RE [144]. While pronation of the subtalar joint is often investigated in relation to injury risk, only one study investigated its association with RE [124], reporting a small but non-significant correlation (r = 0.12; p = 0.65) between higher pronation and higher energy cost. The trivial associations between ankle angles and foot orientation at initial contact and RE further support the notion that initial contact kinematics have a minimal role in RE, potentially due to the small muscle forces at this time instant. Conversely, our findings regarding toe-off plantar flexion indicate that the lower limb orientation during propulsion may play some role in RE.
Only a few studies investigated trunk or upper limb kinematics in relation to RE and the difference in the measured components did not allow combination in a meta-analysis. No studies reported breast motion. One study of 97 runners reported that a greater trunk lean range of motion was significantly associated with a higher energy cost (r = 0.32), while a greater trunk lean angle relative to the global reference frame was non-significantly associated with a higher energy cost (r = 0.27) [24]. Moreover, a greater pelvis/trunk rotation (i.e., longitudinal body rotation) was associated with higher energy cost in the same study (r = 0.32) [24]. However, another study found no significant differences in trunk rotation between groups differing in RE and found rather greater trunk flexion in a more economical group [23]. These conflicting findings may be related to the smaller number of subjects in the latter study [23] versus the former [24], and because the latter study [23] split the sample into three groups which reduced statistical power. Tartaruga et al. [124] found a moderate but non-significant correlation (r = 0.42; p = 0.11) between a larger elbow range of motion and oxygen cost. Similarly, Williams and Cavanagh [23] showed greater arm movement (as measured by three-dimensional wrist displacement) in a group of runners with higher \(\dot{V}{\text{O}}_2\) as compared with a group with lower \(\dot{V}{\text{O}}_2\), although the difference was not significant. Mechanistically, arm movement reduces the lateral movement and longitudinal rotation of the body by counteracting the angular momentum created by the swinging legs. Because greater pelvis/trunk rotation (i.e., longitudinal body rotation) has been associated with higher energy cost [24], greater arm movement may be associated with a higher energy cost via a compensatory mechanism whereby greater arm movements compensate for greater trunk rotation, with this indirect association possibly explaining the non-significant nature of the findings in individual studies with small sample sizes. The lack of studies and use of inconsistent biomechanical outcomes means future studies should focus on the relationship between the trunk, breast, upper limb, and pelvis kinematics, and RE.
4.4 Kinetic Outcomes
High GRADE level evidence indicated that a higher absolute peak vertical ground reaction force showed a small non-significant negative association with a lower energy cost (r = − 0.27). Conversely, when the vertical ground reaction force was normalized for body mass, there was a small non-significant positive correlation (r = 0.28; low GRADE evidence), suggesting that higher peak vertical ground reaction forces relative to body weight were associated with higher energy costs. Individual study outcomes indicated that the normalized peak vertical ground reaction force was higher in a group of runners that showed a higher oxygen cost as opposed to a group of runners with lower oxygen cost [23]. Further, Heise and Martin [88] reported that a larger net vertical impulse was associated (r = 0.60) with a higher oxygen cost. The energy required to support and accelerate the body has been suggested to account for ~ 80% of the energy cost of running [133]. Mechanistically, a larger vertical ground reaction force peak relative to body weight reflects a larger vertical acceleration (as force/mass = acceleration) that in turn requires the recruitment of more muscle mass, which increases energy cost. This larger vertical acceleration is likely to also lead to a larger vertical oscillation and this finding is therefore consistent with the relationship found between vertical oscillation and RE.
In line with the lower normalized peak vertical ground reaction force and lower vertical oscillation being associated with a lower energetic cost, a larger vertical stiffness and leg stiffness also showed a small significant association with a lower energy cost (r = − 0.31, and − 0.28, respectively; moderate GRADE evidence). Having a high vertical stiffness and leg stiffness may optimize storage and release of elastic energy and thereby benefit RE. In contrast, knee and ankle stiffness were not associated with RE (Table 2). This may be due to variations in mechanisms regarding how leg stiffness is produced, with runners utilizing different lower limb segment orientations to produce similar magnitudes of leg stiffness (e.g., different degrees of hip and knee flexion). Consequently, leg and/or vertical stiffness may be more informative for inferring RE than the stiffness of individual joints. In line with these findings, Burns and colleagues [145] re-analyzed data from two studies included in this review and showed that more economical runners exhibited a technique that was more similar to an ideal spring-mass system than recreational runners.
Studies have shown a tendency towards higher peak forces and or impulses in the anterior–posterior direction to be related to a higher oxygen cost [81, 88, 120] or to be present in runners with a worse RE than those with a good RE [23]. However, limited significant findings exist. A body of research by Arellano and Kram [133] has identified propulsive forces to be more metabolically costly to generate than braking forces using repeated-measures study designs. Collectively, minimizing propulsive force generation may be important for economical running, but due to the need to balance braking and propulsion during constant speed running, this will also involve minimization of braking forces.
4.5 Mechanical Work Outcomes
Since it is difficult to isolate the effect of one biomechanical factor on RE, some studies have used a more global measure that involves estimation of the mechanical work done to move the center of mass, and work done relative to the center of mass. Specifically, external mechanical work refers to the movement of the whole-body center of mass relative to the ground, whereas internal mechanical work refers to the movement of the arms and legs relative to the whole-body center of mass. Total mechanical work in turn reflects the sum of both external and internal work. Surprisingly, none of the mechanical work variables were significantly associated with RE. Nevertheless, the directions of the effects were consistent with the notion that more mechanical work should reflect more metabolic work as a higher total mechanical work was moderately but non-significantly associated with a higher energy cost (r = 0.37). The lack of significant findings for these outcomes likely reflects the small number of studies (with each also having a small sample size) that investigated these outcomes (Table 2), and different methods that can be used to calculate mechanical work [146].
Two studies have shown that more economical runners had more energy transfer between adjacent segments [115] or between the trunk and legs [23]. This suggests that more economical runners are better able to use the energy-transporting role of bi-articular muscles, which in turn requires less muscle work to displace the center of mass. However, more research is required to detail which exact components (e.g., joint coupling) allow for this better energy transport.
4.6 Muscle Activation Outcomes
Surface electromyographic activation of various mono- and biarticular lower limb muscles during stance was not significantly associated with RE (Table 2, moderate-high GRADE evidence), with the correlation for all, except for two muscles (rectus femoris and vastus lateralis) also being trivial. The general lack of associations between muscle activation and RE could be considered surprising because, from a physiological perspective, higher muscle activation is often considered detrimental to RE as it is believed to reflect a larger number of active cross-bridges and ion pumping and thus higher energy costs [147]. A potential explanation for this finding is that some muscle activation may be required to increase leg and vertical stiffness and improve storage and re-use of elastic energy in tendons, both of which indirectly improve RE despite the higher muscle activation also (directly) resulting in higher energy costs. In direct support of this hypothesis, the rectus femoris and vastus lateralis both play an important role in knee extension and thus vertical stiffness, and higher activation of these muscles showed a (non-significant) moderate magnitude correlation with lower energy costs. This may be because higher activation of these muscles helps increase lower limb stiffness. Indeed, it has previously been suggested that greater pre-activation of the leg extensors increases the sensitivity of the muscle spindle through enhanced alpha-gamma coactivation potentiating stretch reflexes, and this may increase musculotendon stiffness and thereby enhance RE [148]. In further support, one study included in this review found earlier onset of rectus femoris muscle activation was associated with a lower oxygen cost [114]. In contrast, measures of tendon stiffness were not associated with joint stiffness during hopping [149] or joint angles at initial contact during running [108]. Similarly, groups differing in Achilles tendon stiffness showed no significant differences in ankle joint kinematics during running [82]. Such findings further reinforce the importance of muscle activation strategies to joint range of motion and hence more global measures of stiffness such as vertical or leg stiffness.
While several studies also reported co-activation outcomes, these were too dissimilar to include in meta-analysis. Specifically, four studies [86, 98, 101, 102, 114] investigated either the percentage of stance during which muscles were co-activated or the ratio of muscle activation. The duration of the stance phase over which muscles were co-activated showed inconsistent relations with RE, with one study reporting trivial correlations [86] (obtained from individual participant data; see the ‘overview’ tab in the supplementary Excel dataset for all correlations in the ESM), another study reporting generally (very) strong associations between longer co-activation duration and a higher oxygen cost [98], and another study reporting longer co-activation durations relative to stance or swing phase generally being associated with lower oxygen cost [114]. These conflicting findings may reflect differences in methods used to determine co-activation duration and pairs of muscles investigated. A higher ratio of co-activation (i.e., both muscles being activated at the same time to a larger extent relative to their maximum) was associated with a higher energy cost in two studies from the same author group [101, 102].
4.7 Practical Implications for Athletes, Wearable Technology, and Researchers
The findings of this review have several implications for coaches, athletes, researchers, and developers of wearable technology. Most prominently, Fig. 8 depicts a selection of running technique components that were found to be associated with RE in this review. These components may be modified using targeted training interventions in an attempt to improve RE and by extension running performance. A consideration in this regard is that most correlations were small to moderate in magnitude at most (r = 0.2–0.35), which would equate to an explained variance and potential improvement in running economy of (only) 4–12%. However, even a 4% increase is considered relatively large and relevant in shoe comparison studies. Moreover, the magnitude of explained variance may increase when combining different modifications. Nevertheless, to date, targeted training interventions to improve RE have produced mixed results. Specifically, modifying certain components of running technique (e.g., Pose® running or changing footstrike) has been shown to not change RE [109, 150,151,152,153,154,155], or even worsen it [156]. Conversely, changing stride frequency has improved RE [157, 158], with one study specifically training runners to alter their stride frequency towards their most economical (mathematically optimal) stride frequency [158]. Given that most runners produce stride frequencies lower than their mathematical optimal stride frequency [28,29,30, 48, 159] and stride frequency was negatively associated with RE in our meta-analysis, wearables and coaches could target stride frequency increases in an attempt to improve RE. In turn, this higher stride frequency likely reduces vertical oscillation [160, 161], which might also enhance RE according to our findings. It is important to note that more research is required to compare the effectiveness of targeted and unguided training at improving RE. Moore et al. [27], for example, found beginner runners self-optimized during 10 weeks of unguided running training. Specifically, RE improved by 8% and the training resulted in alterations in running biomechanics, with three kinematic variables explaining 94.3% of the change in RE.

Schematic visualization of the most important associations between running economy and running biomechanics from meta-analyses and individual study results. ↓ or ↑ denote statistically significant correlations, or differences in biomechanics between groups differing in running economy, or differences in running economy between groups differing in running biomechanics, with ↑ indicating more economical runners have larger magnitudes for the specific component. ↔ denotes a component that is not significantly different and of trivial magnitude. Oblique arrows depict non-significant trends of at least a small magnitude (r > 0.1). k = number of effect sizes for the specific outcome. Note that for some outcomes, the number of effect sizes in this figure is different from the number of effect sizes in Table 2 as the figure also includes effect sizes from individual (group-comparison) studies, while Table 2 solely reflects correlational studies included in the meta-analysis. COM center of mass, EC energy cost, GRF ground reaction force, IC initial contact, ROM range of motion, TO toe-off
Another observation with potential practical implications was that two studies reported better energy transfer between segments in more economical runners [23, 115]. Similarly, the findings of three studies suggested that intermuscular coordination (e.g., co-contraction duration and magnitude) were associated with RE [98, 101, 102]. Collectively, these findings suggest that exercises which may enhance intermuscular coordination could be beneficial for enhancing RE (e.g., via plyometric training/running drills or certain ballistic strength training exercises). For example, high-velocity multi-joint training (as opposed to single-joint training) may enhance intermuscular coordination and thereby energy transfer [162, 163], while high-velocity (multi-joint) training may reduce co-contraction magnitude during high-velocity tasks such as running (as opposed to an increase in co-contractions observed with heavy resistance training in some studies) [164]. Training interventions are required to confirm if improvements in RE can be produced via changes in intermuscular coordination.
In addition to informing on components that may be modified to improve RE, our results also provide information on components that may not be relevant to modify from an RE perspective such as contact time, flight time, and duty factor. In support of this, acute gait manipulation studies showed that most runners naturally select contact times close to their theoretical optimum value, with ground contact time also exhibiting a narrow optimal range within which runners can operate [30]. However, some components that were not associated with RE may still be relevant to modify if associations are present between running performance and the component, as optimal performance may require gait optimization beyond minimizing energy cost [24]. In support of this, it has recently been demonstrated that individuals adopt a technique that avoids overburdening individual muscles (i.e., minimization of individual muscle fatigue) during walking, despite this leading to a higher overall metabolic cost [165]. This may therefore explain some conflicting findings between our review and studies that compared running biomechanics between groups of runners differing in running performance or training experience [166,167,168,169].
4.8 Limitations and Considerations
This review has several limitations that should be kept in mind when interpreting the results. First, most of the included studies measured males solely or predominantly (Table 1). Running biomechanics have been shown to differ between males and females (e.g., [170]) and further research is therefore required to investigate whether the findings of this review translate to females.
Second, we did not include studies among elderly subjects as it has been shown that older individuals retain their RE, despite biomechanical differences [50], and this could therefore have confounded the correlations between running biomechanics and RE.
Third, while track running and some road races are performed on a predominantly level surface, runners will typically also run in uphill and downhill conditions. However, we limited our review to level running, with a maximum of 1% treadmill inclination as an inclusion criterion. While it is unknown if these findings can be generalized to uphill and downhill conditions, recent research has shown that uphill, level, and downhill RE values are strongly related within individuals, except on steep slopes [40, 171]. Thus, runners who adopt an economical running gait in level running may also adopt an economical gait in sloped running.
A fourth limitation is that most studies that included kinematics focussed on sagittal-plane kinematics, with only two studies including some frontal-plane kinematics [107, 124]. Further research is therefore required on frontal- and transverse-plane kinematics. Related to this, most studies a priori selected discrete outcomes to analyze, thereby potentially ignoring other important variables that were not selected for analysis. Additionally, these discrete outcomes are often considered in isolation and future studies should investigate if a combination of multiple biomechanics improves relations with running economy (e.g., [172]).
Fifth, some studies did not report all information required for meta-analysis and we therefore extracted the required information from figures or estimated the information based on other studies. This likely introduced some error and we therefore urge researchers to improve reporting and provide open data. In line with these suggestions, we have provided all data extracted or provided by authors in the ESM to facilitate further research. Related to this, some studies did not report whether they verified a steady-state oxygen consumption to ensure a submaximal intensity. We excluded some studies (e.g., [100]) or specific speeds within other studies (e.g., 6 m∙s−1 in [108] or 5.83 m∙s−1 in [85]) as these were very likely not at a metabolic steady-state. While for some other included studies/speeds it is unknown if they were performed at a metabolic steady state, we included these studies as they typically used speeds at which similar populations were shown to run at a metabolic steady-state in other studies (e.g., [87, 116, 117, 119, 124]), or because the speed of the RE assessment was slower than the half-marathon speed (5.56 vs 5.86 m∙s−1, respectively) [92], thus likely being at a metabolic steady-state, in particular on the treadmill due to the smaller influence of air drag.
Sixth, some meta-analyses were affected by high levels of heterogeneity and a small number of studies. Although we attempted to explore the causes of the heterogeneity by performing meta-regressions, other factors that were not investigated such as running experience and competition distance may also have contributed to the heterogeneity. Related to this, optimal running biomechanics may be discipline-specific, with the technique for middle-distance athletes (e.g., 1500 m) being different from long-distance (e.g., marathon), although both types of trained athletes are likely more economical than untrained individuals [36]. Since individuals included in each study may have specialized in different distances, this could have confounded the relationship between running biomechanics and RE (e.g., [173, 174]). However, we could not include these factors as a subgroup or in meta-regression because most studies did not clearly specify the participant characteristics (Fig. 2). Similarly, although we attempted to explore the influence of anthropometric characteristics on the obtained correlations, there are numerous anthropometrical factors such as leg length [18] and calcaneus length [175] that may also contribute to differences in the most economical running biomechanics across individuals. It is therefore likely some components of running technique may be unique to a specific individual given their anthropometric characteristics.
Seventh, 15 studies (29.4%) standardized shoe wear while 26 (70.6%) studies did not standardize shoe wear. Non-standardization of shoe wear may introduce bias when associating RE with running biomechanics. For example, while most studies were conducted before the introduction of ‘super shoes’ with carbon plates and special cushioning in 2017, ‘traditional’ racing flat shoes can still enhance RE by ~ 2% as compared with ‘normal’ training shoes [176]. Similarly, differences in aspects such as heel-toe drop and midsole material properties may alter running biomechanics and thus confound the relation between running biomechanics and RE. In partial support of the relevance of shoe standardization, meta-regression showed stronger correlations between vertical displacement and RE when shoe wear was standardized (Supplementary File S5, see ESM).
Finally, 29 studies (58%) expressed RE as the mass specific rate of oxygen required to run at a given speed, while 16 (32%) studies determined the mass specific rate of energy required to run at a given speed (Table 1). Our sensitivity analysis showed that the differences in correlations between running biomechanics and RE expressed as the oxygen or energetic cost were generally small (< 0.03 units) (Supplementary File S3, see ESM), suggesting this had only a trivial impact on our findings. Nevertheless, we urge caution with the use of oxygen cost as it may confound correlations at higher relative speeds (see e.g., Fig. 5 oxygen vs energy cost correlation with change in speed). Related to this, the energetic cost of running can be determined using assumptions about the energy equivalent of oxygen, or equations that each assume different stoichiometry of the substrate used. Our sensitivity analysis showed that the equation used to determine energy cost had a negligible impact on the correlation with running biomechanics (mean difference in correlation of 0.01; Supplementary File S3, see ESM).
5 Conclusion
Our findings show that among spatiotemporal outcomes, ground contact time, flight time, and duty factor showed trivial and non-significant associations with RE, while a higher stride frequency showed a small significant association with a better RE. Lower vertical oscillation and higher vertical and leg stiffness showed small to moderate magnitude correlations with better RE, while joint angles at specific instances of the gait cycle, joint angle range of motion, electromyographic muscle activation, and peak vertical ground reaction forces showed non-significant and often trivial associations with RE. Nevertheless, there were some trends (e.g., peak knee flexion angle, hip range of motion, and vastus lateralis/rectus femoris activation) worth exploring in future studies. Overall, our findings show that biomechanical variables can explain 4–12% of the between-individual variance in running economy when considered in isolation, with this magnitude potentially increasing when combining different variables. Moreover, we also show that some biomechanical variables often considered relevant to RE (e.g., contact time) are not overall associated with RE when assessed at a similar speed for all runners. While coaches, athletes, researchers, and developers of wearable technology may be tempted to use the biomechanical variables identified in this review to improve RE, further research is required to investigate if targeted training to modify these components is more effective than self-optimization. Finally, optimal performance may require optimization of running biomechanics beyond simply minimizing energy cost, thus suggesting that components not significantly associated with RE may still be relevant from a performance or injury preventative perspective.
References
Ingham SA, Whyte GP, Pedlar C, Bailey DM, Dunman N, Nevill AM. Determinants of 800-m and 1500-m running performance using allometric models. Med Sci Sports Exerc. 2008;40(2):345–50. https://doi.org/10.1249/mss.0b013e31815a83dc.
Tanaka K, Matsuura Y. Marathon performance, anaerobic threshold, and onset of blood lactate accumulation. J Appl Physiol Respir Environ Exerc Physiol. 1984;57(3):640–3. https://doi.org/10.1152/jappl.1984.57.3.640.
Foster C, Lucia A. Running economy: the forgotten factor in elite performance. Sports Med. 2007;37(4–5):316–9. https://doi.org/10.2165/00007256-200737040-00011.
McLaughlin JE, Howley ET, Bassett DR Jr, Thompson DL, Fitzhugh EC. Test of the classic model for predicting endurance running performance. Med Sci Sports Exerc. 2010;42(5):991–7. https://doi.org/10.1249/MSS.0b013e3181c0669d.
Tjelta LI, Tjelta AR, Dyrstad SM. Relationship between velocity at anaerobic threshold and factors affecting velocity at anaerobic threshold in elite distance runners. Int J Appl Sports Sci. 2012;24(1):8–17.
Takayama F, Aoyagi A, Nabekura Y. Relationship between classic physiological variables and running performance in recreational runners. Int J Sport Health Sci. 2018;16:33–40.
Morgan DW, Baldini FD, Martin PE, Kohrt WM. Ten kilometer performance and predicted velocity at VO2max among well-trained male runners. Med Sci Sports Exerc. 1989;21(1):78–83.
Conley DL, Krahenbuhl GS. Running economy and distance running performance of highly trained athletes. Med Sci Sports Exerc. 1980;12(5):357–60.
Mooses M, Mooses K, Haile DW, Durussel J, Kaasik P, Pitsiladis YP. Dissociation between running economy and running performance in elite Kenyan distance runners. J Sports Sci. 2015;33(2):136–44. https://doi.org/10.1080/02640414.2014.926384.
Lucia A, Esteve-Lanao J, Olivan J, Gomez-Gallego F, San Juan AF, Santiago C, et al. Physiological characteristics of the best Eritrean runners-exceptional running economy. Appl Physiol Nutr Metab. 2006;31(5):530–40. https://doi.org/10.1139/h06-029.
Lucia A, Olivan J, Bravo J, Gonzalez-Freire M, Foster C. The key to top-level endurance running performance: a unique example. Br J Sports Med. 2008;42(3):172–4. https://doi.org/10.1136/bjsm.2007.040725. (discussion 4).
Hoogkamer W, Kipp S, Spiering BA, Kram R. Altered running economy directly translates to altered distance-running performance. Med Sci Sports Exerc. 2016;48(11):2175–80. https://doi.org/10.1249/MSS.0000000000001012.
Kipp S, Kram R, Hoogkamer W. Extrapolating metabolic savings in running: implications for performance predictions. Front Physiol. 2019. https://doi.org/10.3389/fphys.2019.00079.
Paavolainen L, Häkkinen K, Hämäläinen I, Nummela A, Rusko H. Explosive-strength training improves 5-km running time by improving running economy and muscle power. J Appl Physiol. 1999;86(5):1527–33.
Besson T, Macchi R, Rossi J, Morio CYM, Kunimasa Y, Nicol C, et al. Sex differences in endurance running. Sports Med. 2022;52(6):1235–57. https://doi.org/10.1007/s40279-022-01651-w.
Black MI, Handsaker JC, Allen SJ, Forrester SE, Folland JP. Is there an optimal speed for economical running? Int J Sports Physiol Perform. 2018;13(1):75–81.
Lundby C, Montero D, Gehrig S, Andersson Hall U, Kaiser P, Boushel R, et al. Physiological, biochemical, anthropometric, and biomechanical influences on exercise economy in humans. Scand J Med Sci Sports. 2017;27(12):1627–37. https://doi.org/10.1111/sms.12849.
Laumets R, Viigipuu K, Mooses K, Maestu J, Purge P, Pehme A, et al. Lower leg length is associated with running economy in high level Caucasian distance runners. J Hum Kinet. 2017;56(1):229–39. https://doi.org/10.1515/hukin-2017-0040.
Kyrolainen H, Kivela R, Koskinen S, McBride J, Andersen JL, Takala T, et al. Interrelationships between muscle structure, muscle strength, and running economy. Med Sci Sports Exerc. 2003;35(1):45–9.
Hunter GR, McCarthy JP, Carter SJ, Bamman MM, Gaddy ES, Fisher G, et al. Muscle fiber type, Achilles tendon length, potentiation, and running economy. J Strength Cond Res. 2015;29(5):1302–9. https://doi.org/10.1519/JSC.0000000000000760.
Bosco C, Montanari G, Ribacchi R, Giovenali P, Latteri F, Iachelli G, et al. Relationship between the efficiency of muscular work during jumping and the energetics of running. Eur J Appl Physiol Occup Physiol. 1987;56(2):138–43.
Bohm S, Mersmann F, Santuz A, Arampatzis A. The force-length-velocity potential of the human soleus muscle is related to the energetic cost of running. Proc R Soc B-Biol Sci. 1917;2019(286):20192560. https://doi.org/10.1098/rspb.2019.2560.
Williams KR, Cavanagh PR. Relationship between distance running mechanics, running economy, and performance. J Appl Physiol. 1987;63(3):1236–45. https://doi.org/10.1152/jappl.1987.63.3.1236.
Folland JP, Allen SJ, Black MI, Handsaker JC, Forrester SE. Running technique is an important component of running economy and performance. Med Sci Sports Exerc. 2017;49(7):1412–23. https://doi.org/10.1249/MSS.0000000000001245.
Moore IS. Is there an economical running technique? A review of modifiable biomechanical factors affecting running economy. Sports Med. 2016;46(6):793–807. https://doi.org/10.1007/s40279-016-0474-4.
Moore IS, Jones AM, Dixon SJ. Reduced oxygen cost of running is related to alignment of the resultant GRF and leg axis vector: a pilot study. Scand J Med Sci Sports. 2016;26(7):809–15. https://doi.org/10.1111/sms.12514.
Moore IS, Jones AM, Dixon SJ. Mechanisms for improved running economy in beginner runners. Med Sci Sports Exerc. 2012;44(9):1756–63. https://doi.org/10.1249/MSS.0b013e318255a727.
Cavanagh PR, Williams KR. The effect of stride length variation on oxygen uptake during distance running. Med Sci Sports Exerc. 1982;14(1):30–5. https://doi.org/10.1249/00005768-198201000-00006.
van Oeveren BT, de Ruiter CJ, Beek PJ, van Dieen JH. Optimal stride frequencies in running at different speeds. PLoS ONE. 2017;12(10): e0184273. https://doi.org/10.1371/journal.pone.0184273.
Moore IS, Ashford KJ, Cross C, Hope J, Jones HSR, McCarthy-Ryan M. Humans optimize ground contact time and leg stiffness to minimize the metabolic cost of running. Front Sports Act Living. 2019;1:53. https://doi.org/10.3389/fspor.2019.00053.
Van Hooren B, Goudsmit J, Restrepo J, Vos S. Real-time feedback by wearables in running: current approaches, challenges and suggestions for improvements. J Sports Sci. 2020;38(2):214–30. https://doi.org/10.1080/02640414.2019.1690960.
Ogueta-Alday A, Rodriguez-Marroyo JA, Garcia-Lopez J. Rearfoot striking runners are more economical than midfoot strikers. Med Sci Sports Exerc. 2014;46(3):580–5. https://doi.org/10.1249/MSS.0000000000000139.
Santos-Concejero J, Tam N, Granados C, Irazusta J, Bidaurrazaga-Letona I, Zabala-Lili J, et al. Interaction effects of stride angle and strike pattern on running economy. Int J Sports Med. 2014;35(13):1118–23. https://doi.org/10.1055/s-0034-1372640.
Di Michele R, Merni F. The concurrent effects of strike pattern and ground-contact time on running economy. J Sci Med Sport. 2014;17(4):414–8. https://doi.org/10.1016/j.jsams.2013.05.012.
Gruber AH, Umberger BR, Braun B, Hamill J. Economy and rate of carbohydrate oxidation during running with rearfoot and forefoot strike patterns. J Appl Physiol (1985). 2013;115(2):194–201. https://doi.org/10.1152/japplphysiol.01437.2012.
Morgan DW, Bransford DR, Costill DL, Daniels JT, Howley ET, Krahenbuhl GS. Variation in the aerobic demand of running among trained and untrained subjects. Med Sci Sports Exerc. 1995;27(3):404–9.
Anderson T. Biomechanics and running economy. Sports Med. 1996;22(2):76–89. https://doi.org/10.2165/00007256-199622020-00003.
Saunders PU, Pyne DB, Telford RD, Hawley JA. Factors affecting running economy in trained distance runners. Sports Med. 2004;34(7):465–85. https://doi.org/10.2165/00007256-200434070-00005.
Lussiana T, Patoz A, Gindre C, Mourot L, Hebert-Losier K. The implications of time on the ground on running economy: less is not always better. J Exp Biol. 2019;222(Pt 6):jeb192047. https://doi.org/10.1242/jeb.192047.
Lemire M, Falbriard M, Aminian K, Millet GP, Meyer F. Level, uphill, and downhill running economy values are correlated except on steep slopes. Front Physiol. 2021;12: 697315. https://doi.org/10.3389/fphys.2021.697315.
Hoogkamer W, Kipp S, Frank JH, Farina EM, Luo G, Kram R. A comparison of the energetic cost of running in marathon racing shoes. Sports Med. 2018;48(4):1009–19. https://doi.org/10.1007/s40279-017-0811-2.
Joubert DP, Dominy T, Burns GT. Effects of a highly cushioned racing shoe on running economy at slower running speeds. SportRxiv. 2022. https://doi.org/10.51224/SRXIV.141.
Joubert DP, Jones GP. A comparison of running economy across seven highly cushioned racing shoes with carbon-fibre plates. Footwear Sci. 2022;14(2):1–13.
Chambon N, Delattre N, Gueguen N, Berton E, Rao G. Shoe drop has opposite influence on running pattern when running overground or on a treadmill. Eur J Appl Physiol. 2015;115(5):911–8. https://doi.org/10.1007/s00421-014-3072-x.
Sun X, Lam WK, Zhang X, Wang J, Fu W. Systematic review of the role of footwear constructions in running biomechanics: implications for running-related injury and performance. J Sports Sci Med. 2020;19(1):20–37.
Luedke LE, Heiderscheit BC, Williams DSB, Rauh MJ. Factors associated with self-selected step rate in high school cross country runners. J Strength Cond Res. 2021;35(4):1141–8. https://doi.org/10.1519/JSC.0000000000002891.
Elliott B, Blanksby B. Optimal stride length considerations for male and female recreational runners. Br J Sports Med. 1979;13(1):15.
Cavanagh PR, Kram R. Stride length in distance running: velocity, body dimensions, and added mass effects. Med Sci Sports Exerc. 1989;21(4):467–79.
Van Oeveren B, De Ruiter C, Hoozemans M, Beek P, Van Dieën J. Inter-individual differences in stride frequencies during running obtained from wearable data. J Sports Sci. 2019;37(17):1996–2006.
Beck ON, Kipp S, Roby JM, Grabowski AM, Kram R, Ortega JD. Older runners retain youthful running economy despite biomechanical differences. Med Sci Sports Exerc. 2016;48(4):697–704. https://doi.org/10.1249/MSS.0000000000000820.
Van Hooren B, Lepers R. A physiological comparison of the new-over 70 years of age-marathon record holder and his predecessor: a case report. Front Physiol. 2023;14:1122315. https://doi.org/10.3389/fphys.2023.1122315.
Willy RW, Paquette MR. The physiology and biomechanics of the master runner. Sports Med Arthrosc Rev. 2019;27(1):15–21. https://doi.org/10.1097/JSA.0000000000000212.
Page MJ, McKenzie JE, Bossuyt P, Boutron I, Hoffmann T, Mulrow C, et al. The PRISMA 2020 statement: an updated guideline for reporting systematic reviews. Int J Surg. 2020;88:105906.
Dorn TW, Schache AG, Pandy MG. Muscular strategy shift in human running: dependence of running speed on hip and ankle muscle performance. J Exp Biol. 2012;215(Pt 11):1944–56. https://doi.org/10.1242/jeb.064527.
Clark J, Glasziou P, Del Mar C, Bannach-Brown A, Stehlik P, Scott AM. A full systematic review was completed in 2 weeks using automation tools: a case study. J Clin Epidemiol. 2020;121:81–90. https://doi.org/10.1016/j.jclinepi.2020.01.008.
Clark JM, Sanders S, Carter M, Honeyman D, Cleo G, Auld Y, et al. Improving the translation of search strategies using the Polyglot Search Translator: a randomized controlled trial. J Med Libr Assoc. 2020;108(2):195–207. https://doi.org/10.5195/jmla.2020.834.
Scells H, Zuccon G, editors. searchrefiner: a query visualisation and understanding tool for systematic reviews. In: Proceedings of the 27th ACM international conference on information and knowledge management, 22–26 October 2018, Torino, Italy
Rathbone J, Carter M, Hoffmann T, Glasziou P. Better duplicate detection for systematic reviewers: evaluation of Systematic Review Assistant-Deduplication Module. Syst Rev. 2015;4(1):6. https://doi.org/10.1186/2046-4053-4-6.
Ouzzani M, Hammady H, Fedorowicz Z, Elmagarmid A. Rayyan—a web and mobile app for systematic reviews. Syst Rev. 2016;5(1):210. https://doi.org/10.1186/s13643-016-0384-4.
Rohatgi A. WebPlotDigitizer. 2018. https://automeris.io/WebPlotDigitizer/. Accessed 13 Aug 2018.
Downs SH, Black N. The feasibility of creating a checklist for the assessment of the methodological quality both of randomised and non-randomised studies of health care interventions. J Epidemiol Community Health. 1998;52(6):377–84. https://doi.org/10.1136/jech.52.6.377.
Sterne JAC, Savovic J, Page MJ, Elbers RG, Blencowe NS, Boutron I, et al. RoB 2: a revised tool for assessing risk of bias in randomised trials. BMJ. 2019;366: l4898. https://doi.org/10.1136/bmj.l4898.
Sterne JA, Hernan MA, Reeves BC, Savovic J, Berkman ND, Viswanathan M, et al. ROBINS-I: a tool for assessing risk of bias in non-randomised studies of interventions. BMJ. 2016;355: i4919. https://doi.org/10.1136/bmj.i4919.
Hoy D, Brooks P, Woolf A, Blyth F, March L, Bain C, et al. Assessing risk of bias in prevalence studies: modification of an existing tool and evidence of interrater agreement. J Clin Epidemiol. 2012;65(9):934–9. https://doi.org/10.1016/j.jclinepi.2011.11.014.
Atkins D, Best D, Briss PA, Eccles M, Falck-Ytter Y, Flottorp S, et al. Grading quality of evidence and strength of recommendations. BMJ. 2004;328(7454):1490. https://doi.org/10.1136/bmj.328.7454.1490.
Rupinski MT, Dunlap WP. Approximating Pearson product-moment correlations from Kendall’s tau and Spearman’s rho. Educ Psychol Meas. 1996;56(3):419–29.
Borenstein M, Hedges LV, Higgins JP, Rothstein HR. Introduction to meta-analysis. West Sussex: Wiley; 2009.
Hafdahl AR. Random-effects meta-analysis of correlations: Monte Carlo evaluation of mean estimators. Br J Math Stat Psychol. 2010;63(Pt 1):227–54. https://doi.org/10.1348/000711009X431914.
Hopkins WG. A scale of magnitudes for effect statistics; 2002. newstats.org/effectmag.html. Accessed 1 Mar 2022.
Hedges LV, Tipton E, Johnson MC. Robust variance estimation in meta-regression with dependent effect size estimates. Res Synth Methods. 2010;1(1):39–65.
Tipton E, Pustejovsky JE. Small-sample adjustments for tests of moderators and model fit using robust variance estimation in meta-regression. J Educ Behav Stat. 2015;40(6):604–34. https://doi.org/10.3102/1076998615606099.
Pustejovsky JE, Tipton E. Meta-analysis with robust variance estimation: expanding the range of working models. Prev Sci. 2022;23(3):425–38. https://doi.org/10.1007/s11121-021-01246-3.
Vembye MH, Pustejovsky JE, Pigott TD. Power approximations for overall average effects in meta-analysis with dependent effect sizes. J Educ Behav Stat. 2022;48(1):70–102. https://doi.org/10.3102/10769986221127379.
Viechtbauer W. Conducting meta-analyses in R with the metafor package. J Stat Softw. 2010;36(3):1–48. https://doi.org/10.18637/jss.v036.i03.
Higgins JP, Thompson SG, Deeks JJ, Altman DG. Measuring inconsistency in meta-analyses. BMJ. 2003;327(7414):557–60. https://doi.org/10.1136/bmj.327.7414.557.
Fu R, Gartlehner G, Grant M, Shamliyan T, Sedrakyan A, Wilt TJ, et al. Conducting quantitative synthesis when comparing medical interventions: AHRQ and the Effective Health Care Program. J Clin Epidemiol. 2011;64(11):1187–97. https://doi.org/10.1016/j.jclinepi.2010.08.010.
Stevens JP. Outliers and influential data points in regression analysis. Psychol Bull. 1984;95(2):334.
Viechtbauer W, Cheung MWL. Outlier and influence diagnostics for meta-analysis. Res Synth Methods. 2010;1(2):112–25.
Aguinis H, Gottfredson RK, Joo H. Best-practice recommendations for defining, identifying, and handling outliers. Organ Res Methods. 2013;16(2):270–301.
Ardigo LP, Lafortuna C, Minetti AE, Mognoni P, Saibene F. Metabolic and mechanical aspects of foot landing type, forefoot and rearfoot strike, in human running. Acta Physiol Scand. 1995;155(1):17–22. https://doi.org/10.1111/j.1748-1716.1995.tb09943.x.
Beck ON, Golyski PR, Sawicki GS. Adding carbon fiber to shoe soles may not improve running economy: a muscle-level explanation. Sci Rep. 2020;10(1):1–13.
Arampatzis A, De Monte G, Karamanidis K, Morey-Klapsing G, Stafilidis S, Brüggemann G-P. Influence of the muscle-tendon unit’s mechanical and morphological properties on running economy. J Exp Biol. 2006;209(17):3345–57.
Gomez-Molina J, Ogueta-Alday A, Stickley C, Camara J, Cabrejas-Ugartondo J, Garcia-Lopez J. Differences in spatiotemporal parameters between trained runners and untrained participants. J Strength Cond Res. 2017;31(8):2169–75. https://doi.org/10.1519/Jsc.0000000000001679.
Kyröläinen H, Komi P, Belli A. Mechanical efficiency in athletes during running. Scand J Med Sci Sports. 1995;5(4):200–8.
Santos-Concejero J, Olivan J, Mate-Munoz JL, Muniesa C, Montil M, Tucker R, et al. Gait-cycle characteristics and running economy in elite Eritrean and European runners. Int J Sports Physiol Perform. 2015;10(3):381–7. https://doi.org/10.1123/ijspp.2014-0179.
Lussiana T, Gindre C, Hebert-Losier K, Sagawa Y, Gimenez P, Mourot L. Similar running economy with different running patterns along the aerial-terrestrial continuum. Int J Sports Physiol Perform. 2017;12(4):481–9. https://doi.org/10.1123/ijspp.2016-0107.
Vercruyssen F, Tartaruga M, Horvais N, Brisswalter J. Effects of footwear and fatigue on running economy and biomechanics in trail runners. Med Sci Sports Exerc. 2016;48(10):1976–84. https://doi.org/10.1249/MSS.0000000000000981.
Heise GD, Martin PE. Are variations in running economy in humans associated with ground reaction force characteristics? Eur J Appl Physiol. 2001;84(5):438–42. https://doi.org/10.1007/s004210100394.
Heise GD, Martin PE. “Leg spring” characteristics and the aerobic demand of running. Med Sci Sports Exerc. 1998;30(5):750–4. https://doi.org/10.1097/00005768-199805000-00017.
Heise GD, Smith JD, Martin PE. Lower extremity mechanical work during stance phase of running partially explains interindividual variability of metabolic power. Eur J Appl Physiol. 2011;111(8):1777–85. https://doi.org/10.1007/s00421-010-1793-z.
Seminati E, Nardello F, Zamparo P, Ardigò LP, Faccioli N, Minetti AE. Anatomically asymmetrical runners move more asymmetrically at the same metabolic cost. PLoS ONE. 2013;8(9): e74134.
Santos-Concejero J, Tam N, Coetzee DR, Olivan J, Noakes TD, Tucker R. Are gait characteristics and ground reaction forces related to energy cost of running in elite Kenyan runners? J Sports Sci. 2017;35(6):531–8. https://doi.org/10.1080/02640414.2016.1175655.
Willis SJ, Gellaerts J, Mariani B, Basset P, Borrani F, Millet GP. Level versus uphill economy and mechanical responses in elite ultratrail runners. Int J Sports Physiol Perform. 2019;14(7):1001–5.
Barnes KR, McGuigan MR, Kilding AE. Lower-body determinants of running economy in male and female distance runners. J Strength Cond Res. 2014;28(5):1289–97. https://doi.org/10.1519/JSC.0000000000000267.
Besson T, Pastor FS, Varesco G, Berthet M, Kennouche D, Dandrieux P-E, et al. Elite vs. experienced male and female trail runners: comparing running economy, biomechanics, strength, and power. J Strength Cond Res. 2022;37(7):1470–8.
Bohm S, Mersmann F, Santuz A, Arampatzis A. Enthalpy efficiency of the soleus muscle contributes to improvements in running economy. Proc Biol Sci. 1943;2021(288):20202784. https://doi.org/10.1098/rspb.2020.2784.
Man HS, Lam WK, Lee J, Capio CM, Leung AKL. Is passive metatarsophalangeal joint stiffness related to leg stiffness, vertical stiffness and running economy during sub-maximal running? Gait Posture. 2016;49:303–8.
Moore IS, Jones AM, Dixon SJ. Relationship between metabolic cost and muscular coactivation across running speeds. J Sci Med Sport. 2014;17(6):671–6. https://doi.org/10.1016/j.jsams.2013.09.014.
Patoz A, Lussiana T, Breine B, Gindre C, Hebert-Losier K. There is no global running pattern more economic than another at endurance running speeds. Int J Sports Physiol Perform. 2022;17(4):659–62. https://doi.org/10.1123/ijspp.2021-0345.
Santos-Concejero J, Granados C, Irazusta J, Bidaurrazaga-Letona I, Zabala-Lili J, Tam N, et al. Differences in ground contact time explain the less efficient running economy in North African runners. Biol Sport. 2013;30(3):181–7. https://doi.org/10.5604/20831862.1059170.
Tam N, Santos-Concejero J, Coetzee DR, Noakes TD, Tucker R. Muscle co-activation and its influence on running performance and risk of injury in elite Kenyan runners. J Sports Sci. 2017;35(2):175–81. https://doi.org/10.1080/02640414.2016.1159717.
Tam N, Tucker R, Santos-Concejero J, Prins D, Lamberts RP. Running economy: neuromuscular and joint stiffness contributions in trained runners. Int J Sports Physiol Perform. 2019;14(1):1–22. https://doi.org/10.1123/ijspp.2018-0151.
Tartaruga MP, Peyré-Tartaruga LA, Coertjens M, De Medeiros MH, Kruel LFM. The influence of the allometric scale on the relationship between running economy and biomechanical variables in distance runners. Biol Sport. 2009;26(3):263–73. https://doi.org/10.5604/20831862.894791.
Zhang Q, Nassis GP, Chen S, Shi Y, Li F. Not lower-limb joint strength and stiffness but vertical stiffness and isometric force-time characteristics correlate with running economy in recreational male runners. Front Physiol. 2022;13: 940761. https://doi.org/10.3389/fphys.2022.940761.
Adelson W, Yaggie JA, Buono MJ. The vertical component of the ground reaction force and running economy. Clin Kinesiol (Online). 2005;59(1):20–4.
Li F, Newton RU, Shi Y, Sutton D, Ding H. Correlation of eccentric strength, reactive strength, and leg stiffness with running economy in well-trained distance runners. J Strength Cond Res. 2021;35(6):1491–9. https://doi.org/10.1519/JSC.0000000000003446.
Sinclair J, Taylor PJ, Edmundson CJ, Brooks D, Hobbs SJ. The influence of footwear kinetic, kinematic and electromyographical parameters on the energy requirements of steady state running. Mov Sport Sci. 2013;80(2):39–49. https://doi.org/10.1051/sm/2012025.
Tanji F, Ohnuma H, Ryosuke A, Ikeda T, Suzuki Y. Long ground contact time enhances running economy at high-intensity running: 3148 board# 17 June 2 8:00 AM–9:30 AM. Med Sci Sports Exerc. 2018;50(5S):772.
Craighead DH, Lehecka N, King DL. A novel running mechanic’s class changes kinematics but not running economy. J Strength Cond Res. 2014;28(11):3137–45. https://doi.org/10.1519/JSC.0000000000000500.
Howe CCF, Swann N, Spendiff O, Kosciuk A, Pummell EKL, Moir HJ. Performance determinants, running energetics and spatiotemporal gait parameters during a treadmill ultramarathon. Eur J Appl Physiol. 2021;121(6):1759–71. https://doi.org/10.1007/s00421-021-04643-2.
Kyröläinen H, Belli A, Komi PV. Biomechanical factors affecting running economy. Med Sci Sports Exerc. 2001;33(8):1330–7. https://doi.org/10.1097/00005768-200108000-00014.
Seki K, Kyrolainen H, Sugimoto K, Enomoto Y. Biomechanical factors affecting energy cost during running utilising different slopes. J Sports Sci. 2020;38(1):6–12. https://doi.org/10.1080/02640414.2019.1676527.
Hansen CE, Stensvig M, Wienecke J, Villa C, Lorentzen J, Rasmussen J, et al. Factors correlated with running economy among elite middle- and long-distance runners. Physiol Rep. 2021;9(20):e15076. https://doi.org/10.14814/phy2.15076.
Heise C, Morgan D, Hough H, Craib M. Relationships between running economy and temporal EMG characteristics of bi-articular leg muscles. Int J Sports Med. 1996;17(02):128–33.
Martin PE, Heise GD, Morgan D. Interrelationships between mechanical power, energy transfers, and walking and running economy. Med Sci Sports Exerc. 1993;25(4):508–15.
Muniz-Pardos B, Sutehall S, Gellaerts J, Falbriard M, Mariani B, Bosch A, et al. Integration of wearable sensors into the evaluation of running economy and foot mechanics in elite runners. Curr Sports Med Rep. 2018;17(12):480–8.
Nummela A, Keranen T, Mikkelsson LO. Factors related to top running speed and economy. Int J Sports Med. 2007;28(8):655–61. https://doi.org/10.1055/s-2007-964896.
Pastor FS, Besson T, Berthet M, Varesco G, Kennouche D, Dandrieux P-E, et al. Elite Road vs. trail runners: comparing economy, biomechanics, strength, and power. J Strength Cond Res. 2023;37(1):181–6.
Rogers SA, Whatman CS, Pearson SN, Kilding AE. Assessments of mechanical stiffness and relationships to performance determinants in middle-distance runners. Int J Sports Physiol Perform. 2017;12(10):1329–34. https://doi.org/10.1123/ijspp.2016-0594.
Storen O, Helgerud J, Hoff J. Running stride peak forces inversely determine running economy in elite runners. J Strength Cond Res. 2011;25(1):117–23. https://doi.org/10.1519/JSC.0b013e3181b62c8a.
Fletcher JR, Esau SP, Macintosh BR. Economy of running: beyond the measurement of oxygen uptake. J Appl Physiol (1985). 2009;107(6):1918–22. https://doi.org/10.1152/japplphysiol.00307.2009.
Jeukendrup AE, Wallis GA. Measurement of substrate oxidation during exercise by means of gas exchange measurements. Int J Sports Med. 2005;26(Suppl 1 (S 1)):S28–37. https://doi.org/10.1055/s-2004-830512.
Weir JB. New methods for calculating metabolic rate with special reference to protein metabolism. J Physiol. 1949;109(1–2):1–9. https://doi.org/10.1113/jphysiol.1949.sp004363.
Tartaruga MP, Brisswalter J, Peyre-Tartaruga LA, Avila AOV, Alberton CL, Coertjens M, et al. The relationship between running economy and biomechanical variables in distance runners. Res Q Exerc Sport. 2012;83(3):367–75. https://doi.org/10.1080/02701367.2012.10599870.
Lieberman DE, Warrener AG, Wang J, Castillo ER. Effects of stride frequency and foot position at landing on braking force, hip torque, impact peak force and the metabolic cost of running in humans. J Exp Biol. 2015;218(Pt 21):3406–14. https://doi.org/10.1242/jeb.125500.
Chang YH, Kram R. Metabolic cost of generating horizontal forces during human running. J Appl Physiol (1985). 1999;86(5):1657–62. https://doi.org/10.1152/jappl.1999.86.5.1657.
Beck ON, Gosyne J, Franz JR, Sawicki GS. Cyclically producing the same average muscle-tendon force with a smaller duty increases metabolic rate. Proc Biol Sci. 1933;2020(287):20200431. https://doi.org/10.1098/rspb.2020.0431.
Roberts TJ, Konow N. How tendons buffer energy dissipation by muscle. Exerc Sport Sci Rev. 2013;41(4):186–93. https://doi.org/10.1097/JES.0b013e3182a4e6d5.
Mooses M, Haile DW, Ojiambo R, Sang M, Mooses K, Lane AR, et al. Shorter ground contact time and better running economy: evidence from female Kenyan runners. J Strength Cond Res. 2021;35(2):481–6.
Patoz A, Lussiana T, Thouvenot A, Mourot L, Gindre C. Duty factor reflects lower limb kinematics of running. Appl Sci. 2020;10(24):8818.
Grospretre S, Gimenez P, Thouvenot A, Patoz A, Lussiana T, Mourot L. Different plantar flexors neuromuscular and mechanical characteristics depending on the preferred running form. J Electromyogr Kinesiol. 2021;59: 102568. https://doi.org/10.1016/j.jelekin.2021.102568.
Joubert DP, Guerra NA, Jones EJ, Knowles EG, Piper AD. Ground contact time imbalances strongly related to impaired running economy. Int J Exerc Sci. 2020;13(4):427–37.
Arellano CJ, Kram R. Partitioning the metabolic cost of human running: a task-by-task approach. Oxford: Oxford University Press; 2014.
Moore IS, Jones A, Dixon S. The pursuit of improved running performance: can changes in cushioning and somatosensory feedback influence running economy and injury risk? Footwear Sci. 2014;6(1):1–11.
Divert C, Mornieux G, Freychat P, Baly L, Mayer F, Belli A. Barefoot-shod running differences: shoe or mass effect? Int J Sports Med. 2008;29(6):512–8. https://doi.org/10.1055/s-2007-989233.
Ferris DP, Louie M, Farley CT. Running in the real world: adjusting leg stiffness for different surfaces. Proc Biol Sci. 1998;265(1400):989–94. https://doi.org/10.1098/rspb.1998.0388.
Dixon SJ, Collop AC, Batt ME. Surface effects on ground reaction forces and lower extremity kinematics in running. Med Sci Sports Exerc. 2000;32(11):1919–26. https://doi.org/10.1097/00005768-200011000-00016.
Kerdok AE, Biewener AA, McMahon TA, Weyand PG, Herr HM. Energetics and mechanics of human running on surfaces of different stiffnesses. J Appl Physiol (1985). 2002;92(2):469–78. https://doi.org/10.1152/japplphysiol.01164.2000.
McMahon TA, Valiant G, Frederick EC. Groucho running. J Appl Physiol (1985). 1987;62(6):2326–37. https://doi.org/10.1152/jappl.1987.62.6.2326.
Anderson DE, Madigan ML, Nussbaum MA. Maximum voluntary joint torque as a function of joint angle and angular velocity: model development and application to the lower limb. J Biomech. 2007;40(14):3105–13.
Warrener A, Tamai R, Lieberman DE. The effect of trunk flexion angle on lower limb mechanics during running. Hum Mov Sci. 2021;78: 102817. https://doi.org/10.1016/j.humov.2021.102817.
Ishikawa M, Pakaslahti J, Komi PV. Medial gastrocnemius muscle behavior during human running and walking. Gait Posture. 2007;25(3):380–4. https://doi.org/10.1016/j.gaitpost.2006.05.002.
Cochrum RG, Conners RT, Caputo JL, Coons JM, Fuller DK, Frame MC, et al. Visual classification of running economy by distance running coaches. Eur J Sport Sci. 2020. https://doi.org/10.1080/17461391.2020.1824020.
Swinnen W, Hoogkamer W, Delabastita T, Aeles J, De Groote F, Vanwanseele B. Effect of habitual foot-strike pattern on the gastrocnemius medialis muscle-tendon interaction and muscle force production during running. J Appl Physiol (1985). 2019;126(3):708–16. https://doi.org/10.1152/japplphysiol.00768.2018.
Burns GT, Tam N, Santos-Concejero J, Tucker R, Zernicke RF. Assessing spring-mass similarity in elite and recreational runners. Front Physiol. 2023. https://doi.org/10.3389/fphys.2023.1224459.
Williams KR. The relationship between mechanical and physiological energy estimates. Med Sci Sports Exerc. 1985;17(3):317–25.
Fletcher JR, MacIntosh BR. Running economy from a muscle energetics perspective. Front Physiol. 2017;8(433):433. https://doi.org/10.3389/fphys.2017.00433.
Santos-Concejero J, Tam N, Granados C, Irazusta J, Bidaurrazaga-Letona I, Zabala-Lili J, et al. Stride angle as a novel indicator of running economy in well-trained runners. J Strength Cond Res. 2014;28(7):1889–95. https://doi.org/10.1519/JSC.0000000000000325.
Kubo K, Morimoto M, Komuro T, Tsunoda N, Kanehisa H, Fukunaga T. Influences of tendon stiffness, joint stiffness, and electromyographic activity on jump performances using single joint. Eur J Appl Physiol. 2007;99(3):235–43. https://doi.org/10.1007/s00421-006-0338-y.
Clansey AC, Hanlon M, Wallace ES, Nevill A, Lake MJ. Influence of tibial shock feedback training on impact loading and running economy. Med Sci Sports Exerc. 2014;46(5):973–81. https://doi.org/10.1249/MSS.0000000000000182.
Ekizos A, Santuz A, Arampatzis A. Short- and long-term effects of altered point of ground reaction force application on human running energetics. J Exp Biol. 2018;221(Pt 15):jeb.176719. https://doi.org/10.1242/jeb.176719.
Roper JL, Doerfler D, Kravitz L, Dufek JS, Mermier C. Gait retraining from rearfoot strike to forefoot strike does not change running economy. Int J Sports Med. 2017;38(14):1076–82. https://doi.org/10.1055/s-0043-110225.
Messier SP, Cirillo KJ. Effects of a verbal and visual feedback system on running technique, perceived exertion and running economy in female novice runners. J Sports Sci. 1989;7(2):113–26. https://doi.org/10.1080/02640418908729830.
Fletcher G, Bartlett R, Romanov N, Fotouhi A. Pose® method technique improves running performance without economy changes. Int J Sports Sci Coach. 2008;3(3):365–80. https://doi.org/10.1260/174795408786238506.
Petray CK, Krahenbuhl GS. Running training, instruction on running technique, and running economy in 10-year-old males. Res Q Exerc Sport. 1985;56(3):251–5.
Dallam GM, Wilber RL, Jadelis K, Fletcher G, Romanov N. Effect of a global alteration of running technique on kinematics and economy. J Sports Sci. 2005;23(7):757–64. https://doi.org/10.1080/02640410400022003.
Quinn TJ, Dempsey SL, LaRoche DP, Mackenzie AM, Cook SB. Step frequency training improves running economy in well-trained female runners. J Strength Cond Res. 2019. https://doi.org/10.1519/JSC.0000000000003206. (Epub ahead of print).
Morgan D, Martin P, Craib M, Caruso C, Clifton R, Hopewell R. Effect of step length optimization on the aerobic demand of running. J Appl Physiol (1985). 1994;77(1):245–51. https://doi.org/10.1152/jappl.1994.77.1.245.
de Ruiter CJ, Verdijk PW, Werker W, Zuidema MJ, de Haan A. Stride frequency in relation to oxygen consumption in experienced and novice runners. Eur J Sport Sci. 2014;14(3):251–8. https://doi.org/10.1080/17461391.2013.783627.
Gullstrand L, Halvorsen K, Tinmark F, Eriksson M, Nilsson J. Measurements of vertical displacement in running, a methodological comparison. Gait Posture. 2009;30(1):71–5. https://doi.org/10.1016/j.gaitpost.2009.03.001.
Slawinski JS, Billat VL. Difference in mechanical and energy cost between highly, well, and nontrained runners. Med Sci Sports Exerc. 2004;36(8):1440–6. https://doi.org/10.1249/01.Mss.0000135785.68760.96.
Leirdal S, Roeleveld K, Ettema G. Coordination specificity in strength and power training. Int J Sports Med. 2008;29(3):225–31. https://doi.org/10.1055/s-2007-965128.
Dalen T, Welde B, van den Tillaar R, Aune TK. Effect of single vs. multi joint ballistic resistance training upon vertical jump performance. Acta Kinesiologiae Universitatis Tartuensis. 2013;19:86–97. https://doi.org/10.12697/akut.2013.19.08.
Janusevicius D, Snieckus A, Skurvydas A, Silinskas V, Trinkunas E, Cadefau JA, et al. Effects of high velocity elastic band versus heavy resistance training on hamstring strength, activation, and sprint running performance. J Sports Sci Med. 2017;16(2):239–46.
McDonald KA, Cusumano JP, Hieronymi A, Rubenson J. Humans trade off whole-body energy cost to avoid overburdening muscles while walking. Proc R Soc B. 1985;2022(289):20221189.
Preece SJ, Bramah C, Mason D. The biomechanical characteristics of high-performance endurance running. Eur J Sport Sci. 2019;19(6):784–92. https://doi.org/10.1080/17461391.2018.1554707.
García-Pinillos F, García-Ramos A, Ramírez-Campillo R, Latorre-Román PÁ, Roche-Seruendo LE. How do spatiotemporal parameters and lower-body stiffness change with increased running velocity? A comparison between novice and elite level runners. J Hum Kinet. 2019;70(1):25–38.
da Rosa RG, Oliveira HB, Gomeñuka NA, Masiero MPB, da Silva ES, Zanardi APJ, et al. Landing-takeoff asymmetries applied to running mechanics: a new perspective for performance. Front Physiol. 2019;10:415. https://doi.org/10.3389/fphys.2019.00415.
Fadillioglu C, Möhler F, Reuter M, Stein T. Changes in key biomechanical parameters according to the expertise level in runners at different running speeds. Bioengineering. 2022;9(11):616.
Clermont CA, Benson LC, Osis ST, Kobsar D, Ferber R. Running patterns for male and female competitive and recreational runners based on accelerometer data. J Sports Sci. 2019;37(2):204–11. https://doi.org/10.1080/02640414.2018.1488518.
Breiner TJ, Ortiz ALR, Kram R. Level, uphill and downhill running economy values are strongly inter-correlated. Eur J Appl Physiol. 2019;119(1):257–64. https://doi.org/10.1007/s00421-018-4021-x.
van Oeveren BT, de Ruiter CJ, Beek PJ, van Dieen JH. The biomechanics of running and running styles: a synthesis. Sports Biomech. 2021. https://doi.org/10.1080/14763141.2021.1873411.
Cunningham R, Hunter I, Seeley MK, Feland B. Variations in running technique between female sprinters, middle, and distance runners. Int J Exerc Sci. 2013;6(1):6.
Burns GT, Gonzalez R, Zendler JM, Zernicke RF. Bouncing behavior of sub-four minute milers. Sci Rep. 2021;11(1):1–15.
Raichlen DA, Armstrong H, Lieberman DE. Calcaneus length determines running economy: implications for endurance running performance in modern humans and Neandertals. J Hum Evol. 2011;60(3):299–308.
Hébert-Losier K, Finlayson SJ, Driller MW, Dubois B, Esculier J-F, Beaven CM. Metabolic and performance responses of male runners wearing 3 types of footwear: Nike Vaporfly 4%, Saucony Endorphin racing flats, and their own shoes. J Sport Health Sci. 2022;11(3):275–84.
Acknowledgements
None.
Funding
None.
Author Contributions
BVH conceived the article and wrote the first draft of the manuscript. IM and IJ helped conceptualize the article and with writing of the first draft. Further author contributions to each of the steps of the systematic review are detailed in Sect. 2. All authors edited and revised the manuscript and approved the final version of the manuscript.
Conflict of Interest
All authors declare that they have no conflict of interest.
Data Availability
All data collected as part of this study are available from the Open Science Framework at https://osf.io/293nd/ (https://doi.org/10.17605/OSF.IO/293ND).
Author information
Authors and Affiliations
Corresponding author
Supplementary Information
Below is the link to the electronic supplementary material.
Rights and permissions
Open Access This article is licensed under a Creative Commons Attribution 4.0 International License, which permits use, sharing, adaptation, distribution and reproduction in any medium or format, as long as you give appropriate credit to the original author(s) and the source, provide a link to the Creative Commons licence, and indicate if changes were made. The images or other third party material in this article are included in the article's Creative Commons licence, unless indicated otherwise in a credit line to the material. If material is not included in the article's Creative Commons licence and your intended use is not permitted by statutory regulation or exceeds the permitted use, you will need to obtain permission directly from the copyright holder. To view a copy of this licence, visit http://creativecommons.org/licenses/by/4.0/.
About this article

Cite this article
Van Hooren, B., Jukic, I., Cox, M. et al. The Relationship Between Running Biomechanics and Running Economy: A Systematic Review and Meta-Analysis of Observational Studies. Sports Med 54, 1269–1316 (2024). https://doi.org/10.1007/s40279-024-01997-3
Accepted:
Published:
Issue Date:
DOI: https://doi.org/10.1007/s40279-024-01997-3