
Abstract
Chicory (Cichorium intybus var. foliosum) roots are an agricultural residue and a low cost feedstock for the production of the platform chemical 5-Hxdroxymethylfurfural (HMF). In a first step, inulin and fructose have to be extracted from the roots. The resulting aqueous extract represents the starting material for the HMF production. In the reaction to HMF, inulin has to be hydrolyzed first to fructose. For this reason, two methods to increase the fructose content in these extracts before the reaction were investigated. This was conducted within the framework of integrating acid hydrolysis into a biorefinery process for HMF production. The first method (one-step process) was acid-assisted extraction to directly hydrolyze inulin in the course of the extraction process. Chicory roots were extracted at 60 and 80 °C at pH 2 and 4 using buffer solutions. The second approach (two-step process) was aqueous extraction at neutral pH followed by nitric acid hydrolysis of the extract at 60 and 80 °C under reduced pH. It was found that in the first approach, the pH of 2 led to a fivefold increase in the fructose content of the extract, resulting from inulin hydrolysis and corresponding to 56% of theoretical fructose yield. For the second approach, it was possible to achieve complete hydrolysis at pH below 2.5 and at 80 °C. Separating extraction and hydrolysis was found to be more suitable in terms of including this process step into a biorefinery concept for HMF production. It was possible to reduce the initial inulin content by 95%.
1 Introduction
The production of biobased materials from agricultural residues is an indispensable component of the transformation of a fossil-based to a biobased economy. Zero-waste approaches can lead to a reduction in worldwide CO2 emissions and material cycles can be closed. For this purpose, residual materials are processed in biorefineries, which are part of a well-functioning bioeconomy.
Chicory roots (Cichorium intybus var. foliosum) are an agricultural residue. After field cultivation, these are harvested and then stored up to several months at low temperatures [1]. After storage, etiolated buds (chicons) are produced in dark forcing chambers for 21 days at 15–20 °C [2]. The chicons are sold as salad; the roots are, from this point, an agricultural waste with only low-value application like biogas production. But also the unforced roots that represent the fraction of rejected roots after harvest, which do not match the standards for forcing, are of interest. They can be also be a starting material for the production of the platform chemical 5-hydroxymethylfurfural (HMF) [3]. For this purpose, it is necessary to extract sugars from the roots. Here, inulin and fructose are of particular importance. Inulin is a storage carbohydrate in plants and primarily consists of a varying number of β-2-1 glycosidically linked fructose molecules [4]. For this reason, inulin can also be called polyfructose. The length of inulin chains is expressed by the degree of polymerization (DP). It normally ranges from 2 to 60, but the average DP (DPa) in chicory is normally between 10 and 15 or even lower [5]. In general, inulin with a DP < 10 is named short-chained or low-molecular weight inulin [6].
The extraction of inulin from chicory roots can be conducted with water at elevated temperatures. Generally, inulin is extracted from fresh roots as oven drying reduces the yield [7]. About 80–90% of the soluble sugars can be extracted within 15 min at 80–90 °C [8] in a batch process or, at slightly reduced temperatures, in continuous processes using pretreatments like pulsed electric fields [9]. However, the extractability depends strongly on the chicory roots and on the specific surface of the feedstock. During cultivation, harvest, storage and forcing, the composition of the sugar changes. During cultivation, more long-chained inulin and only a small proportion of monosaccharides can be found in the roots [10]. At the time of storage and forcing, these chains are broken down causing an increase in monosaccharides, mainly fructose [11].
HMF is produced via dehydration from fructose. It can also be produced from sucrose [12], glucose (via isomerization) and inulin, which has to be hydrolyzed first to fructose. This can lead to higher reaction times and lower yields. Hydrolysis of the chicory inulin could lead to high fructose concentrations in the extracts that enable high conversion rates to HMF. Inulin hydrolysis has been studied earlier, mainly with regard to the production of fructose for different applications, like the production high fructose syrup [13] or for ethanol production [14]. In general, there are two ways to conduct hydrolysis of inulin. The first way is enzymatic hydrolysis. This can be conducted with the enzymes exo- and endoinulinase. The exoinulinase breaks the molecules from the end of the chain whereas the endoinulinase acts on the internal linkages [15]. The optimum temperature of different inulinase strains covers a range of 30 to 60 °C [15]. Therefore, the combination with the commonly performed process (chicory extraction at, preferably, 80 °C) is difficult. A relevant disadvantage for the biorefinery process, however, would be the long reaction times in enzymatic inulin hydrolysis [16]. As enzymatic hydrolysis is, in addition, very expensive, the second method, which is acid hydrolysis, is more suitable. A disadvantage that is mentioned in literature [17] is that acid hydrolysis leads to undesirable coloring of the hydrolysate and less sweetness due to the formation of difructose anhydrides, which both does not matter for this paper. The research here is done within the framework of developing a process unit for a biorefinery plant where the extracts should be used for HMF production. Therefore, color changes and sweetness do not matter. Acid hydrolysis was conducted earlier, mainly using Jerusalem artichoke inulin [18, 19]. It is stated to be easy to realize at mild pH and temperature conditions and it leads to the production of the free sugars fructose, glucose, and sucrose [20].
This study presents two methods for the extraction and hydrolysis of sugars from chicory roots. A one-step approach, combining extraction and hydrolysis in one process by using water (pH 6) and buffer solutions at two pH (2 and 4), is compared to a two-step approach, in which extraction and hydrolysis are separated process units. The aim of this study is to work out a first approach to produce fructose-enriched extracts from chicory root in the framework of an HMF-biorefinery unit.
2 Material and methods
2.1 Material—chicory roots
For all the experiments, unforced chicory roots (Cichorium intybus var. foliosum) of the cultivar “Flexine,” received from Nationale Proeftuin voor Witloof (Herent, Belgium), were used. These roots were sown on May 2018. Harvest date was November 2018. In Belgium, the roots were stored at − 1 °C for 2 months, followed by storage at − 20 °C in a freezer after receipt. The dry matter content (Table 1) of the chicory roots was determined in a drying cabinet according to DIN 12880 for 24 h at 105 °C. The chicory that was taken for sugar analysis was freeze-dried with an Alpha 2-4 LSCplus model from Martin Christ Gefriertrocknungsanlagen GmbH (Osterode, Germany) as high drying temperatures can lead to caramelization of the sugars.
The composition of inulin and fructose varies strongly depending on the production state, storage time etc. For this reason, unforced roots were used for the experiments, as these have a higher content of inulin. For the experiments, a total amount of 5 kg of the roots was cut into julienne shape (3 mm thickness and approximately 6 cm length) with an industrial food cutter (GSH300, GGM Gastro International GmbH, Ochtrup, Germany).
The roots were not peeled before cutting as this would require an additional process step. Fractions of 100 grams were frozen in plastic bags at − 20 °C, in order to ensure the comparability among different experiments.
2.2 Methods
Two approaches were investigated (see Fig. 1). The first one was acid-assisted extraction using buffer solutions at pH 2, 4 and 6, respectively. Deionized water was used to produce reference experiments, which were the basis for the two-step approach, in which hydrolysis with nitric acid was initiated after the neutral extraction.
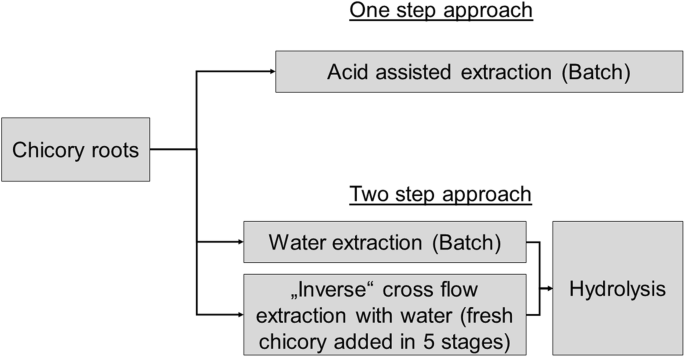
Overview of different processing methods
2.2.1 One-step approach: extraction experiments with adjusted pH
The extraction experiments were all performed in triplicate. The following parameters were varied: pH value (2; 4; 6) and temperature (60 °C, 80 °C and 100 °C) (see Table 2). The parameters for the pH range were chosen after literature values. According to Gliboswki et al. [21], the difference between pH 1 and 2 for intensive inulin hydrolysis is low, which is why no experiments were conducted below pH 2. The temperature range was chosen as 80 °C extraction temperature is state of the art [8, 9, 22]. The higher and lower temperatures were investigated to see if acid has a beneficial effect in view of lowering the extraction temperature. 100 °C is known to be the temperature where inulin is completely hydrolyzed at reduced pH [16].
The solid-to-liquid ratio was kept at 1:10 w/w as determined earlier [8]. The amount of chicory was calculated in fresh matter. According to the chicory composition in Table 1, the input of inulin, sucrose, glucose and fructose was 10.6 g, 3.7 g, 0.1 g and 1.2 g, respectively, for each experiment. The pH value of 6 represents the set of experiments without acid addition, so only deionized water (with a pH of 5.8) was used. For adjustment of the other pH values, buffer solution (citric acid/sodium hydroxide/hydrogen chloride) traceable to standard reference material from NIST-Standard (Merck Chemicals, UK) was used. The buffer solutions were at pH 2 and 4, respectively. In pretrials, 1 M nitric acid was used to adjust the pH, but due to the addition of chicory and the subsequent extraction, the pH was not stable, also due to the gradual increase of water from the chicory pieces and potentially buffering components in the extract. By reason of that, buffer was used to keep the pH stable over the duration of the extraction.
The extraction solvent (1 L for 100 g biomass) was preheated in a 2 L glass beaker to the desired temperature on a heating plate (IKA, RCT basic, Staufen, Germany). To avoid heat and evaporation losses, the beaker was covered and wrapped in aluminum foil. After reaching the temperature, the chicory pieces were added to the solvent. The speed of the magnetic stirrer was kept at 350 rpm in order to ensure that all the chicory was flowing in the resulting water current. The time was recorded from the addition of chicory. All the samples were directly filtered using 0.45 μm polypropylene filters and were cooled down in an ice bath to stop any reactions that might have occurred during the extraction. Additionally, the samples from the extraction at pH 2 and pH 4 were neutralized using some drops of 5 M NaOH (VWR Chemicals, Radnor, USA). After the extraction, chicory and water were separated using a sieve (3 mm mesh size). The extracts were then directly filtered using 0.45 μm polypropylene filters. The final extract was stored in polypropylene tubes at − 20 °C in a freezer for further analyses. Before analysis, the extract was heated again to 60, 80 °C and 100 °C, respectively, to dissolve potentially precipitated inulin.
2.2.2 Two-step approach: acid hydrolysis of chicory extracts
Step 1: Extraction
The trials for the acid hydrolysis were conducted in triplicate with the final extract (75 min extraction) of experiment number 8 (E8, pH 6, 80 °C, Table 2, hereinafter “Unconcentrated extract”). Additionally, a concentrated extract was produced. As it was found that the hydrolysis of the unconcentrated extract occurs rather fast, the concentrated extract was prepared to enable higher sugar concentrations to gain better visibility of the hydrolytic processes. It was also used to show what happens if the sugar concentrations are higher, if, for example, the extracts are produced in a countercurrent process. The concentrated extract was prepared with the same conditions, using a five-stage “inverse” cross-flow extraction. Usually in cross-flow extraction, fresh solvent is used in each stage. Here, fresh chicory feedstock was extracted, and the solvent was used again in the next stage. The extraction was conducted in a glass beaker on a heating plate with continuous stirring at 350 rpm. 100 g of fresh matter chicory were used for each stage and the solid-to-liquid ratio was 1:10 w/w. The same chicory as for the acid extraction experiments was used and deionized water was used as extraction solvent. After 15 min, the extraction was stopped and chicory and water were separated using a sieve (3 mm mesh size). The volume of the extract was measured. Fresh chicory was then added to the extraction solvent, again in solid-to-liquid ratio 1:10, and the extraction was conducted again. This procedure was repeated five times as, after this time, the equilibrium of sugar concentration in the solution was reached and no additional sugar was transferred to the extraction solvent. As this final extract was very turbid, it was first centrifuged at 14000 rpm for 10 min (Z 326 K, Hermle Labortechnik GmbH, Wehingen, Germany) and then filtered using 0.45 μm polypropylene filters. The extract was frozen at − 20 °C for further analyses and for the hydrolysis. For analysis of solids in the extract, the dry matter content of the extract was determined as described under 2.1 for the chicory roots.
Step 2: Hydrolysis
The acid hydrolysis for both unconcentrated and concentrated extract was carried out in triplicate in a water bath. The hydrolysis was, same as for the extraction experiments, conducted at 60 °C and 80 °C at pH 2, 2.5, 3 and pH 4 (Table 3). A total of 2 mL of extract was added to the bottom of glass reagent tubes that were covered to avoid evaporation. The tubes were then preheated to the desired temperature.
After preheating, the pH was adjusted by using 1 M nitric acid. The tubes were mixed thoroughly and put directly back to the water bath. Single reagent tubes were taken after 5, 10, 30, 60, 90, 120, 150 and 180 min. The reagent tubes were directly cooled down in an ice bath to avoid further hydrolysis. Additionally, the solution was neutralized with NaOH after cooling.
2.3 Analysis
2.3.1 Sugar and extract analysis
The sugar content in the extracts was determined by using different enzyme test kits from Megazyme (Bray, Ireland): The test kit “K-SUCGL” was used for measuring the sucrose content of the extracts. There, sucrose is hydrolyzed to glucose and fructose. The glucose content in the samples is then measured by converting it to a quinoneimine dye compound [23]. Fructose and glucose were determined by using “K-FRUGL.” For the inulin content, “K-FRUCHK” was used, the procedure follows AOAC Method 999.03 and AACC method 32.32.01. The error was below 2% for each test.
For the determination of the sugar content of solid samples, a dried sample was first grinded in a CryoMill (Retsch, Haan, Germany). Ten stainless steel balls (7 mm Ø) were used for each charge. Bead milling was conducted for 5 min at 30 Hz frequency. 0.2 g of sample was dissolved in 100 mL of distilled water for 30 min at 80 °C. The sample was filtered with a 0.45 μm polypropylene filter. Afterwards, it was measured with the enzyme kits the same way as the extract samples. To validate the results, the samples were additionally measured by HPLC (Shimadzu 20 AD, Shimadzu, Canby, USA, equipped with an Aminex HPX-87H column and an UV-vis detector (SPD-20A, Shimadzu) and a refractive index detector (RID-10A, Shimadzu)). The eluent was 0.004 mol/L sulfuric acid solution at a flow rate of 0.65 mL/min. The separation in the column was carried out at 25 °C. For the analysis of the results, the extraction yield of sugars from the chicory roots was calculated by using Eq. 1.
yE is the extraction yield, c is the concentration of the respective sugar, and i represents the type of sugar (e.g. inulin or fructose). The initial content represents the content of the biomass input; the extracted content represents what is found in the extract after the reaction time.
Hydrolysis yields for both approaches were expressed in fructose yield (yF). This was calculated similar to Eq. 1.
The following values were used to obtain the theoretically achievable fructose content: For the one-step approach and the two-step approach with the unconcentrated extract, the final yields of experiment E3 (Table 2) were used, for the second two-step approach, the concentrated extract was hydrolyzed under pH 2 (adjusted with nitric acid as described under section 2.2.2) for 1 h at 100 °C. In both ways, the maximum possible inulin hydrolysis is achieved [16].
Statistical analysis for the final fructose yield was performed with the ANOVA tool from OriginPro 2017. The letters in the output diagram, which indicates significant differences among the treatments, are obtained based on pairwise mean comparisons following a Student t test procedure (significance level 5%).
As a mixture of 5 kg roots was prepared, it can be assumed that the error of the sugar concentrations within the biomass was below 1%. The error of the pipettes was, on average, 0.05% and every enzyme test has an error below 2%. Therefore, it can be assumed that the highest error resulted from the analytics with the enzyme test.
2.3.2 Kinetic modeling of experimental data and inulin hydrolysis
Previous studies have demonstrated that the experimental data from extraction experiments accurately fit to Eq. 3 [24,25,26], which is the analytical solution for the system of differential equations in Eqs. 4 and 5. In there, it is assumed that the relationship between unextracted (A) and extracted (B) sugars can be described in terms of a first-order mechanism.
A0 is the starting concentration of A. It can further be noted that C represents the sum of the starting concentration of A and B (Eq. 6).
B0 is the starting concentration of B. In analogy of applying Eq. 3 to extraction data, the concept was also used to describe model lines for the hydrolysis experiments. On the other hand, B represents the concentration of the hydrolyzed substance, which is fructose in this study. The parameters C, A0 and k were fitted by non-linear regression using OriginPro 2017.
3 Results and discussion
The content of the respective sugars in the chicory root biomass is presented in Table 1. In comparison with our previous studies [8, 27], where the sugar extraction from forced chicory roots was studied, it is again confirmed that it is difficult to achieve matching results in case of using a heterogeneous biomass. The content of inulin, mono- and disaccharides in chicory roots is highly dependent on numerous parameters like cultivar, growth, harvest time and storage [10, 11, 28].
Unlike in previous publications [8, 27], unforced roots were used instead of forced roots in this paper. As already mentioned in the materials section, the higher inulin content of unforced roots facilitates studying hydrolysis processes. In the framework of a sustainable bioeconomy, forced roots would be preferred as they are an agricultural residue. However, it has to be noted that chicory cultivation itself generates numerous amounts of roots, which do not match the quality standards of the forcing facility. Therefore, these roots are also considered unforced roots and represent another major potential that should be addressed in future work.
3.1 One-step approach: extraction with adjusted pH
3.1.1 Influence of pH and temperature
For the experiments conducted at pH 6, the extraction yield (obtained by Eq. 1) of total sugars (inulin, glucose, fructose, sucrose) was 92.3% (± 3.7 %), resulting in a content of 14 g/L in the extract. The fructose yield for E8 (87.0%) is similar to the fructose yield from our first study (89.5%) [8], where the same parameters, but another chicory cultivar was used. The inulin extraction yield was 85.1% at 80 °C and 77.5% at 60 °C (E8 and E7, see Table 2). Similar results have been found by Negro et al. [29]. The authors extracted Jerusalem artichoke tubers, but they also reported inulin recovery to be around 80% at temperatures between 60 and 80 °C. According to them, 100% of the theoretical inulin extraction yield was achieved in boiling water. At neutral pH, the equilibrium concentration in the extract was reached after 6, 8, 6 and 15 min for fructose, glucose, sucrose, and inulin, respectively. The reason why these plateaus are reached faster in comparison with our other study [8] (where 10 min was the minimum time) is that the roots used in this paper were frozen. This probably caused a cracking of the cell walls. An advantage of freezing the roots before doing the extraction is that the consistency changes noticeably so the pieces can soak up water much better. Freezing and thawing can therefore be seen as a pretreatment as a disintegration of cell walls and tissue occurs [30].
It is most important to pay attention to fructose, which is the main product of hydrolysis of inulin under these conditions. If the fructose content increases during the extraction, it can be indicated that hydrolysis occurs at the same time or that the cells are, due to the lowered pH, destroyed, which enables a better transport of the sugars into the solvent. Although the yield remained similar within most of the experiments, significant changes can be seen at pH 2 (Fig. 2). At lower temperature (Fig. 2a), pH 2 did not have such a strong effect as for the higher extraction temperature. This was also described earlier by Matusek et al. [31] who studied the degradation of fructooligosaccharides at pH 2.7–3.3. According to them, the hydrolysis at 60 °C is insignificant and increases starting from 70 °C in this pH range. Lower temperatures are rather suitable for enzymatic hydrolysis due to the low thermostability of the enzymes [16].

Fructose extraction yield at 60 °C extraction temperature (a), 80 °C extraction temperature (b), and 100 °C extraction temperature (c) under different pH (pH 2 = black; pH 4 = blue; pH 6 = red) of extraction solvent. The yield (yF) represents the percentage of theoretical achievable fructose during hydrolysis. Extraction experiments were conducted batchwise at 1:10 solid-to-liquid ratio. Relative error bars are obtained and calculated from the three experimental repetitions (< 5%). Model lines are derived by Eq. 3
It is clearly visible that pH 2 increased the content of fructose in the extract by using 80 °C and 100 °C as extraction temperature. 100 °C led to a complete hydrolysis of inulin. At 80 °C and pH 2, 56.5% of this theoretical fructose yield was achieved (obtained by Eq. 2). This means that, in comparison to the same experiment conducted at pH 6, additional 47% were achieved through inulin hydrolysis. These lower yields as compared to 100 °C can be explained by the decomposition of the biomass. At pH 2 and 100 °C, the chicory biomass is almost completely destroyed. This is why all the cells are accessible. At 80 °C, a disintegration of the structure also occurs, but the single pieces basically remain in their original shape. It can be assumed that, by using freeze-dried and grinded material, the yields at 80 °C can be increased as observed by Glibowski and Bukowska [21]. However, this was not done in this paper, as the research here was focused on the work with chicory fresh matter in order to adapt the experiments to the biorefinery process. Grinding the biomass is also not state of the art in conventional inulin extraction from chicory [7], also generally known from the production of table sugar from sugar beet [32]. The use of julienne or cossette shape facilitates separation processes. Figure 3 shows the percentage amount of fructose in the final extracts (after 75 min of extraction) over all experiments. It can be seen that pH 2 was the only condition that led to appreciable hydrolysis and a resulting increase in fructose concentration. As shown in Fig. 3, the fructose yields of pH 4 and 6 are not significantly different. At pH 6, the concentrations remained similar for all investigated temperatures. This shows that for the conduction of an effective hydrolysis, it is not enough to only increase the temperature; the pH has to be below 4 to initiate hydrolytic processes.

Fructose yield over the experiments. Yield (yF) represents the percentage of theoretical achievable fructose during hydrolysis. All experiments were conducted at 1:10 solid-to-liquid ratio. Relative error bars are obtained and calculated from the experimental repetitions (< 3%). Bars that have the same letter are not significantly different (pairwise mean comparisons by t test (5%))
Glibowski and Bukowska [21] state that intensive hydrolysis only occurs in strong acidic environment at this rather low temperature. They also found high contribution of inulin hydrolysis at or above pH 3, whereas starting from pH 4, only weak or no hydrolysis was measured. In summary, it can be said that decreasing the pH of the extraction solvent leads to higher amounts of fructose as hydrolysis product. The amount can be further increased by increasing the extraction temperature or the extraction time as it can be confirmed by the experiment conducted at 100 °C and pH 2. As discussed above, pH 4 had no significant effects on the hydrolysis during the extraction. For further investigations, it might be possible to observe an effect during a long-term experiment, because the hydrolysis might be so slow that an effect is not visible in the data presented in this paper.
The concentrations of the respective sugars for extraction at pH 2 and 80 °C are presented in Fig. 4. The concentration of fructose and glucose increased while the inulin content decreased after 20–30 min. The initial increase in inulin concentration is a result of the extraction process. As explained above, the sugars are first transferred from the easily accessible cells and the cutting surfaces into the solvent. The highest inulin concentration reached was 6.2 g/L after 15 min (Fig. 4). Except from this peak, it is difficult to monitor the extraction processes for the further course, when hydrolysis occurs at the same time. Sucrose, glucose and fructose are not only extractable substances, but also hydrolysis products, thus making it difficult to attribute their concentration profile to either hydrolysis or extraction.

Concentrations of carbohydrates over the extraction time. The extraction was conducted at 80 °C and pH 2. Error bars are in the range of the symbol size and therefore not shown here (see Fig. 2)
In Fig. 4, an accelerated increase of the fructose concentration can be seen after about 20 min. This is reflected in the decreasing inulin concentration. This shows that first, by hydrolysis within the inulin chain, more fructosyl ends are produced, which results later in a high fructose production rate. The hydrolysis of the glucosyl-fructosyl bond, which, in most inulin molecules, represents the starting molecule sucrose, is the limiting step in the total hydrolysis of inulin, which was also observed in previous studies [20, 33]. It can be assumed that the kinetics of the inulin hydrolysis are not dependent on the average chain length. In the case of chicory, the average chain length is normally rather low [5]. It was found that at low average DP, the kinetic constant of inulin degradation is only slightly dependent on the chain length [19].
3.2 Two-step approach: acid hydrolysis of chicory extracts
For the hydrolysis of the extracts, the main focus in the following section will be on the fructose yield as this is the main hydrolysis product. This section is intended to serve as an approach – there are numerous studies on the hydrolysis and stability of inulin [21, 33, 34], but not on the hydrolysis of an extract from chicory biomass containing a mixture of sugars. It has to be noted that parts of all the hydrolysis products (sucrose, fructose and glucose) were already present in the extract before hydrolysis. The hydrolysis was not conducted below pH 2 as there, the dehydration of fructose is most noticeable at elevated temperatures [18].
3.2.1 Hydrolysis of unconcentrated extract
Figure 5a and b shows the hydrolysis of the unconcentrated extract under different temperature and pH. The percentage results are based on total hydrolysis at 100 °C of the respective extract which represents the value of 100%. The combination of elevated temperature (80 °C) and low pH (below 3) led to a rapid hydrolysis of inulin and sucrose. The same effect as for fructose was observed for glucose, which is why it is not presented in a separate figure. Compared to the results of the one-step approach (extraction with adjusted pH) described above (Fig. 2), it is interesting to see that for the extraction at pH 2, it was not possible to reach an equilibrium during 45 min whereas for the extract hydrolysis (two-step approach) at the same pH, the fructose equilibrium was reached rapidly after 10 min (Fig. 5b). In the two-step approach, hydrolysis occurs much faster than in the one-step approach. The reason for that could be that the sugars are already dissolved, which means that they are available in the solution, from the beginning. In the one-step approach, they first have to be extracted from the chicory root cells. The structure of the cells has to be destroyed first to enable a transfer of the sugars to the solvent. Another reason could be the temperature transfer. The extraction was conducted in a beaker on a heating plate, the hydrolysis in a reagent tube in a water bath – the temperature transfer might be better in the water bath. It took longer at pH 3 (30 min), for pH 4, an equilibrium can be assumed after approximately 180 min. Also at lower temperature (Fig. 5a), the same fructose concentration was achieved for pH 2, 2.5 and 3, while it was lower for pH 4. The measurements at 60 °C were stopped after 180 min, but according to the data points, it can be assumed that the fructose concentration at pH 4 increases, but very slow. The small hydrolysis rate at pH 4 was reported earlier [21].

Hydrolysis of the unconcentrated extract (obtained from one-step approach experiment E7, obtained by single stage batch extraction at 80 °C) at 60 °C (a) and 80 °C (b) with HNO3 and hydrolysis of concentrated extract (obtained from five-stage countercurrent extraction) at 80 °C) at 60 °C (c) and 80 °C (d) with HNO3. The yield (yF) represents the percentage of theoretical achievable fructose during hydrolysis. Relative error bars are obtained and calculated from the experimental repetitions (< 6%). Model lines are derived by using Eq. 3
3.2.2 Hydrolysis of concentrated extract
As the hydrolysis of the unconcentrated extract was fast, it was difficult to see the effects between the different pH at the chosen temperatures, especially 2 and 2.5. To show the effects more clearly and to study the effect of the initial sugar concentration, the hydrolysis was also conducted by using the concentrated extract. It was produced with the same roots than the unconcentrated extract. After the five stages of extraction, it was possible to achieve a total concentration of 75.1 g/L sugars. These were, in detail, 2.8% glucose, 10.9% fructose, 28.4% sucrose and 57.8% inulin. As described above, this extract contained an appreciable amount of solids. These were, in detail, 90.3 g/L (± 0.4) solids, which means that, apart from the sugars, about 15 g/L of other solids are dissolved. It is assumed that these are adhesions to the root peel like small remaining dirt particles. These also cause a dark and “dirty” coloration of the extract. Filtration was almost impossible and only viable by using a centrifuge at high speed. Further investigations on this have to clarify how this might affect the following processes like the HMF production. It is not clear if solid byproducts in the extract have an impact on the HMF formation. From Fig. 5c and d, it can be seen that also for the high initial sugar concentration, with above 94%, almost the maximum yield for fructose (defined as yF = 100%) was achieved at pH < 4 at 80 °C (Fig. 5d) and 75% were achieved at pH 2 at 60 °C (Fig. 5c). The time until complete hydrolysis at pH 2 (approximately 30 min) was similar to the results of Pekic et al. [18]. The hydrolysis of the unconcentrated extract at 80 °C did not show changes between pH 2 and 2.5. Here, for the concentrated extract, it can be seen that this 0.5 pH increase changes the rate of hydrolysis.
3.2.3 Comparison and kinetics of the hydrolysis of both extracts
Comparisons between unconcentrated and concentrated extract were made on the basis of the carbon balance (Fig. 6), which, in contrast to the mass balance (the mass balance is altered by water addition during hydrolysis reactions), remains constant during the experiment.
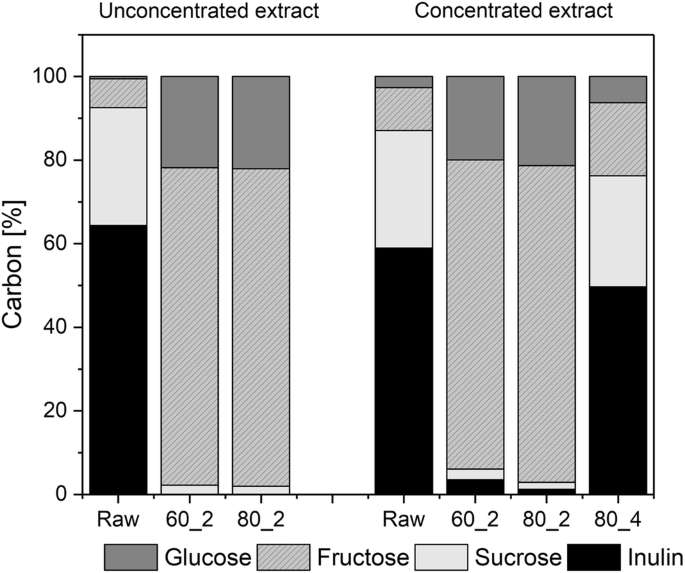
Carbon balance of the extract hydrolysis. 60_2 = 60 °C and pH 2; 80_2 = 80 °C and pH 2; 80_4 = 80 °C and pH 4; Raw = extract before hydrolysis
For the unconcentrated extract, the carbon share of fructose increased from 7.0% to 76.0% after hydrolysis. For the concentrated extract, the increase was from 10.3% to 75.0% (Fig. 6). At pH 4 (concentrated extract), the highest increase was up to 17.4%. In this experiment, 83.3% of the initial inulin remained in the hydrolyzed extract and the content of sucrose almost remained unchanged. It can be assumed that this is also due to the fact that fructosyl-fructosyl bonds are broken down faster than glucosyl-fructosyl bonds [19]. It was possible to close all balances to 97.5% (± 2.9). The fact that it was not closed to 100% can be traced back to the analytical error.
The kinetics of the two-step approach for both extracts were also compared. Table 4 displays the parameter k obtained by fitting Eq. 3 to the concentration profile of fructose; it can therefore be regarded as a “fructose production rate constant.” The rate constant is increasing with temperature and with decreasing pH, as expected.
This effect in the rate constants in combination with temperature and pH was also described by L’homme et al. [33] who studied the kinetics and hydrolysis of fructooligosaccharides. The highest rate constants were recorded for the unconcentrated extract at 80 °C, the lowest for the concentrated extract at pH 4. Independently from temperature and pH, one can see that the rate constant for the unconcentrated extract is always higher compared to the concentrated one, which is an indicator for different reactions orders for the two cases. This means that, unlike proposed for inulin hydrolysis [35], the experiments with the concentrated extract show that the hydrolysis is slowed down. This is probably a result of a shortage or lack of water molecules that changes the reaction order from pseudo-first order to second order. Formally, this leads to a decrease and concentration dependence of k. Therefore, it follows for the second order approach:
and for the pseudo-first-order approach (under the assumption that [H2O] ≈ constant):
3.3 Evaluation of process steps (one-step and two-step approach) regarding the application in a biorefinery concept for HMF production
For the one-step approach, it was shown that 100 °C led to maximum hydrolysis of the inulin and an extract with high fructose concentration. However, these high temperatures are, for the biorefinery process concerned, out of question since they lead to changes in the material, which will become pulp-like. In terms of process engineering, this would cause problems in the design of the plant components, mainly with solid-liquid separation. The benefit of using fresh matter biomass in julienne or cossette shape was already discussed above. Elevated temperatures (> 100 °C) can yield in the formation of side products like HMF or levulinic acid.
The hydrolysis of chicory extracts has a high potential. It can be noted that such fructose-rich extracts are not only interesting for the production of 5-HMF. The results presented in this paper may also be of interest for other applications as, for example, high fructose syrup. Normally, this is named high fructose corn syrup as it is produced from corn. To yield a high fructose content, it is necessary to use a multienzymatic process as the conversion is via starch and glucose. By using inulin as a starting material, it is possible to use a single-step process which produces a fructose yield that is 2-folds higher than from starch [36]. However, the quality is better when using enzymatic hydrolysis [37], but which quality is necessary depends on the application.
Figure 7 presents an overview of the different approaches for a scenario using 100 g fresh matter chicory input at 80 °C extraction and hydrolysis temperature. It shows the amount of carbon that is found in fructose and inulin for the input biomass and the respective approaches. It can be seen that the two-step approach is more efficient in terms of inulin hydrolysis and fructose production. With the two-step approach at pH 2, it was possible to reduce the initial inulin content by 97.0%, while with the one-step approach at pH 2, the reduction was only 59.1%.

Fructose and inulin content (expressed in respective carbon content) comparison over all the approaches for an experiment with 100 g fresh matter chicory input at 80 °C (Chicory input = solid, approaches = extracts). Standard deviation is derived from experimental repetitions (n = 3)
Even though the two-step approach yields a higher fructose content in the extract, further investigations and a techno-economic assessment of both approaches is needed. The economic point of view is important to find out which process is more suitable. The benefit of using a two-step approach is that acid resistance does not have to be taken into account for the construction of an extraction unit. The fact that the two-step approach is more flexible in terms of pH and temperature offers many possibilities for the process design and optimization. It is also interesting for the use of different biomass types in one biorefinery plant. Further studies could deal with the thermodynamics of this process during storage or transport—for temporary storage or transport of the extract, it might be even possible that the hydrolysis takes place during cooling down from 80 °C extracting temperature.
4 Conclusion
In this paper, two different approaches of acid-assisted extraction were successfully investigated and evaluated. Fructose-enriched extracts were produced in both approaches. It can be assumed that they are suitable for the production of HMF. A one-step approach led to 56% of maximum possible fructose yield at temperatures of 80 °C and pH 2 in the context of the investigated conditions. However, a two-step approach, where the extract is produced with water and, by means of nitric acid, hydrolyzed in a second step at pH 2 and 80 °C, can decrease the initial inulin content in the biomass by more than 95%. For further investigations, a techno-economic assessment is needed to see if this approach is also practical from an economic point of view.
Data availability
Not applicable
References
Bais HP, Ravishankar GA (2001) Cichorium intybus L-cultivation, processing, utility, value addition and biotechnology, with an emphasis on current status and future prospects. J Sci Food Agric 81:467–484. https://doi.org/10.1002/jsfa.817
Wonneberger C, Keller F, Bahnmüller H et al (2004) Gemüsebau. Eugen Ulmer GmbH & Co., Stuttgart
Menegazzo F, Ghedini E, Signoretto M (2018) 5-Hydroxymethylfurfural (HMF) production from real biomasses. Molecules 23. https://doi.org/10.3390/molecules23092201
Quemener B, Thibault J-F, Coussement P (1994) Determination of inulin and oligofructose in food products, and integration in the AOAC method for measurement of total dietary fibre. LWT Food Sci Technol 27:125–132. https://doi.org/10.1006/fstl.1994.1028
Vergauwen R (2003) Properties of fructan:fructan 1-fructosyltransferases from chicory and globe thistle, two asteracean plants storing greatly different types of inulin. Plant Physiol 133:391–401. https://doi.org/10.1104/pp.103.026807
Kelly G (2008) Inulin-type prebiotics—a review: part 1. Altern Med Rev 13:315–329
Gupta AK, Kaur N, Kaur N (2003) Preparation of inulin from chicory roots. J Sci Ind Res:916–920
Stökle K, Kruse A (2019) Extraction of sugars from forced chicory roots. Biomass Conv Bioref 3:699–708. https://doi.org/10.1007/s13399-019-00374-9
Zhu Z, Bals O, Grimi N, Vorobiev E (2012) Pilot scale inulin extraction from chicory roots assisted by pulsed electric fields. Int J Food Sci Technol 47:1361–1368. https://doi.org/10.1111/j.1365-2621.2012.02981.x
Ernst M, Chatterton NJ, Harrison PA (1995) Carbohydrate changes in chicory (Cichorium intybus L. var. foliosum) during growth and storage. Sci Hortic 63:251–261. https://doi.org/10.1016/0304-4238(95)00815-B
Ende WIM, Mintiens A, Speelers H et al (1996) The metabolism of fructans in roots of Cichorium intybus during growth, storage and forcing. New Phytol 132:555–563. https://doi.org/10.1111/j.1469-8137.1996.tb01874.x
Steinbach D, Kruse A, Sauer J, Vetter P (2018) Sucrose is a promising feedstock for the synthesis of the platform chemical hydroxymethylfurfural. Energies 11:645. https://doi.org/10.3390/en11030645
Baston O, Barna O (2016) Optimisation of fructose production by enzymatic hydrolysis of chicory fructans. PAKJAS 53:455–460. https://doi.org/10.21162/PAKJAS/16.1562
Kim K, Hamdy MK (1986) Acid hydrolysis of Jerusalem artichoke for ethanol fermentation. Biotechnol Bioeng 28. https://doi.org/10.1002/bit.260280124
Ricca E, Calabrò V, Curcio S, Iorio G (2007) The state of the art in the production of fructose from inulin enzymatic hydrolysis. Crit Rev Biotechnol 27:129–145. https://doi.org/10.1080/07388550701503477
Trivedi S, Divecha J, Shah T, Shah A (2015) Rapid and efficient bioconversion of chicory inulin to fructose by immobilized thermostable inulinase from Aspergillus tubingensis CR16. Bioresour Bioprocess 2:596. https://doi.org/10.1186/s40643-015-0060-x
Kochhar A, Gupta AK, Kaur N (1999) Purification and immobilisation of inulinase from Aspergillus candidus for producing fructose. J Sci Food Agric 79:549–554. https://doi.org/10.1002/(SICI)1097-0010(19990315)79:4<549:AID-JSFA216>3.0.CO;2-0
Pekic B, Slavica B, Lepojevic Z et al (1985) Effect of pH on the acid hydrolysis of Jerusalem artichoke inulin. Food Chem 17:169–173
Heyraud A, Rinaudo M, Taravel FR (1984) Isolation and characterization of oligosaccharides containing d-fructose from juices of the Jerusalem artichoke. Kinetic constants for acid hydrolysis. Carbohydr Res 128:311–320. https://doi.org/10.1016/0008-6215(84)85338-0
Blecker C, Fougnies C, van Herck J-C, Chevalier JP, Paquot M (2002) Kinetic study of the acid hydrolysis of various oligofructose samples. J Agric Food Chem 50:1602–1607. https://doi.org/10.1021/jf010905b
Glibowski P, Bukowska A (2011) The effect of pH, temperature and heating time on inulin chemical stability. Acta scientiarium polonorum. Technologia Alimentaria 10:189–196
Loginova KV, Shynkaryk MV, Lebovka NI, Vorobiev E (2010) Acceleration of soluble matter extraction from chicory with pulsed electric fields. J Food Eng 96:374–379. https://doi.org/10.1016/j.jfoodeng.2009.08.009
Megazyme (2020) Sucrose/D-glucose assay procedure. https://www.megazyme.com/documents/Booklet/K-SUCGL_DATA.pdf. Accessed 07 Sep 2020
Simeonov E, Tsibranska I, Minchev A (1999) Solid–liquid extraction from plants—experimental kinetics and modelling. Chem Eng J 73:255–259. https://doi.org/10.1016/S1385-8947(99)00030-3
Minchev A, Minkov S (1984) A model for determination of the coefficient of effective diffusion with the aid of a standard function. J Appl Chem USSR: 665–667
Chilev C, Koleva V, Simeonov E (2014) A new empirical model for calculation the effective diffusion coefficient for solid–liquid extraction from plants. Ind Eng Chem Res 53:6288–6296. https://doi.org/10.1021/ie402473r
Stökle K, Hülsemann B, Steinbach D, Cao Z, Oechsner H, Kruse A (2019) A biorefinery concept using forced chicory roots for the production of biogas, hydrochar, and platform chemicals. Biomass Conv Bioref 11:447. https://doi.org/10.1007/s13399-019-00527-w
Koch K, Andersson R, Rydberg I et al (1999) Influence of harvest date on inulin chain length distribution and sugar profile for six chicory (Cichorium intybus L) cultivars. J Sci Food Agric 79:1503–1506. https://doi.org/10.1002/(SICI)1097-0010(199908)79:11<1503:AID-JSFA394>3.0.CO;2-9
Negro MJ, Ballesteros I, Manzanares P, Oliva JM, Sáez F, Ballesteros M (2006) Inulin-containing biomass for ethanol production carbohydrate extraction and ethanol fermentation. ABAB 132:922–932. https://doi.org/10.1385/ABAB:132:1:922
Meyer HW, Richter W (2001) Freeze-fracture studies on lipids and membranes. Micron 32:615–644. https://doi.org/10.1016/S0968-4328(00)00050-0
Matusek A, Merész P, Le TKD et al (2009) Effect of temperature and pH on the degradation of fructo-oligosaccharides. Eur Food Res Technol 228:355–365. https://doi.org/10.1007/s00217-008-0941-8
Schneider F, Reinefeld E, Schliephake D (1963) Grundlagen und technische Durchführung der Zuckerextraktion aus Rübenschnitzeln. Chem Ing Tech 35:567–576. https://doi.org/10.1002/cite.330350805
L’homme C, Arbelot M, Puigserver A et al (2003) Kinetics of hydrolysis of fructooligosaccharides in mineral-buffered aqueous solutions: influence of pH and temperature. J Agric Food Chem 51:224–228. https://doi.org/10.1021/jf0204699
Eskandari Nasab E, Habibi-Rezaei M, Khaki A et al (2009) Investigation on acid hydrolysis of inulin: a response surface methodology approach. Int J Food Eng 5:1676. https://doi.org/10.2202/1556-3758
Barclay T, Ginic-Markovic M, Johnston MR, Cooper PD, Petrovsky N (2012) Analysis of the hydrolysis of inulin using real time 1H NMR spectroscopy. Carbohydr Res 352:117–125. https://doi.org/10.1016/j.carres.2012.03.001
Singh RS, Chauhan K, Pandey A, Larroche C (2018) Biocatalytic strategies for the production of high fructose syrup from inulin. Bioresour Technol 260:395–403. https://doi.org/10.1016/j.biortech.2018.03.127
Fleming SE, GrootWassink JW (1979) Preparation of high-fructose syrup from the tubers of the Jerusalem artichoke (Helianthus tuberosus L. CRC Crit Rev Food Sci Nutr 12: 1–28. https://doi.org/10.1080/10408397909527271
Acknowledgments
We would like to thank the Nationale Proeftuin voor Witloof (Herent, Belgium) for providing the chicory roots.
Funding
Open Access funding enabled and organized by Projekt DEAL. Katrin Stökle was supported by the FNR (Fachagentur Nachwachsende Rohstoffe e.V.) within the framework of the project “KEFIP” (FKZ 22000318).
Author information
Authors and Affiliations
Contributions
Katrin Stökle conducted the experimental work and wrote the manuscript. Dennis Jung contributed on writing the kinetics section, performed the statistical analysis, and revised the manuscript. Andrea Kruse acquired the funding, supervised the work and revised the manuscript.
Corresponding author
Ethics declarations
Conflict of interest
The authors declare that they have no conflict of interest.
Code availability
Not applicable
Additional information
Publisher’s Note
Springer Nature remains neutral with regard to jurisdictional claims in published maps and institutional affiliations.
Rights and permissions
Open Access This article is licensed under a Creative Commons Attribution 4.0 International License, which permits use, sharing, adaptation, distribution and reproduction in any medium or format, as long as you give appropriate credit to the original author(s) and the source, provide a link to the Creative Commons licence, and indicate if changes were made. The images or other third party material in this article are included in the article's Creative Commons licence, unless indicated otherwise in a credit line to the material. If material is not included in the article's Creative Commons licence and your intended use is not permitted by statutory regulation or exceeds the permitted use, you will need to obtain permission directly from the copyright holder. To view a copy of this licence, visit http://creativecommons.org/licenses/by/4.0/.
About this article

Cite this article
Stökle, K., Jung, D. & Kruse, A. Acid-assisted extraction and hydrolysis of inulin from chicory roots to obtain fructose-enriched extracts. Biomass Conv. Bioref. 13, 159–170 (2023). https://doi.org/10.1007/s13399-020-01108-y
Received:
Revised:
Accepted:
Published:
Issue Date:
DOI: https://doi.org/10.1007/s13399-020-01108-y