
Abstract
The tribulations of water quality have become more serious than the quantity, as the environmental evils are getting more severe day by day in different parts of the world. Large number of components like soil, geology, sewage disposal, effluents and other environmental conditions in which the water tends to reside or move and interact with ground and biological characteristics, greatly persuade the groundwater quality. Therefore, hydrochemical study has been carried out graphically and spatially in GIS environment in part of Bundelkhand Massif. The hydrochemical study exposes the water quality by measuring the concentration of parameters and comparing them with the drinking water and irrigation standards. Groundwater samples have been collected and analysed for physiochemical characteristics in order to understand the hydrochemistry of the water. The results revealed that ground water is alkaline in nature and total hardness observed in all samples falls under moderately hard to very hard category. At some places higher concentration of Cl− could be dangerous from health point of view. Major hydrochemical facies were identified using Piper Trilinear diagram and Durov diagrams, etc. Analysis of different determinations such as sodium adsorption ratio, residual sodium carbonate and per cent sodium revealed that most of the samples are unsuitable for irrigation. It was also observed that the quality of groundwater was not suitable for drinking purpose in industrial and irrigation area. In the area, few sampling sites showed unsuitability because of influences of urban and industrial waste discharge, aquifer material mineralogy, other anthropogenic activities and increased human interventions.
Introduction
One of the most valuable natural resource is Groundwater, which supports human health, socio-economic development and functioning of ecosystems (Humphreys 2009; Steube et al. 2009); besides, it forms one of the primary resources for development activities. Groundwater quality is one of the most important aspects in water resource studies. In recent times, there has been tremendous demand for fresh water due to population growth and intensive agricultural activities. The chemical parameters (Ca2+, Mg2+, Cl−, HCO3−, Na+, K+ and SO −24 ) of groundwater play a significant role in classifying and assessing water quality. Assessment of groundwater quality requires determination of ion concentrations which decide the suitability for drinking, domestic, agricultural and industrial uses. The water quality may yield information about the environments through which the water has circulated. Accordingly, groundwater quality is a function of its physical and chemical parameters which in turn are highly influenced by geological formations, climatic conditions and anthropogenic activities in any area (Ramkumar et al. 2012; Subramani et al. 2005a, b). Moreover, the use of pesticides and fertilizers enhances the agriculture production but they result in direct and negative impact on water quality (Carpenter et al. 1998; Matson et al. 1997; Kolpin 1997; Griffith 2001). According to Vasanthavigar et al. (2010), periodic changes in groundwater quality are caused by the constitution of the recharged water, hydrologic and human factors.
The Water pollution or water chemistry change not only affects water quality but also threatens human health, economic development and social prosperity (Milovanovic 2007). The quality of groundwater has particularly received immense attention since water of high quality is required for domestic and irrigation needs. The groundwater resources are not only the most important resources for drinking purposes but the groundwater exclusively fulfils agricultural, domestic and industrial water demands in India. Knowledge on hydrochemistry is important to assess the quality of groundwater for understanding its suitability for domestic, irrigation and industrial needs. Until recently, hydrochemical assessment of groundwater was based on laboratory investigation, but nowadays, geosciences research is carried out in different fields using geospatial techniques having advantage of observing and integrating various thematic layers with ease, accuracy and in time effective manner (Ali 2000; Ali and Piresteh 2004; Ali and Ali 1983, Ali and Ali 1984; Piresteh and Ali 2004; Ali et al. 2003a, b; Ali and Piresteh 2005; Pirasteh et al. 2007; Ali 1988; Ali and Khan 2013a, b; Ali and Tesgaya 2010; Ali and Ali 2014, 2015). The main objective of this study was to assess the spatial distribution of hydrochemical parameters, chemical variations in groundwater under various natural and anthropogenic activities. In this study, suitability of groundwater quality for various purposes like drinking, domestic, agriculture and industrial use in future was also analysed.
Description of study area
The present study is carried out in Lakheri river basin Jhansi district, Uttar Pradesh, India (Fig. 1). It covers an area of 390.03 km2 and is situated between 79°00′00″–79°15′00″E longitude and 25°15′00″–25°30′00″N latitude. The average annual rainfall is 850.1 mm. The climate is sub-humid and is characterized by a hot dry summer and cold winter. About 91% of rainfall takes place from June to September. In monsoon season, the availability of more surface water on percolation recharges and enhances the groundwater in the area. January is the coldest month of the year when the mean daily maximum temperature is 24.1 °C and the mean daily minimum temperature is 9.2 °C, May is the hottest month with mean daily maximum temperature is 42.6 °C and means daily minimum temperature is 28.8 °C. The mean monthly maximum temperature is 32.6 °C and means minimum temperature is 19.2 °C.

Location map of the area
Geologically, the massif is mostly dominated by Palaeoproterozoic granitoids known as Bundelkhand Granitoids, which are described as pink granite, grey granite, biotite granite and granite porphyry (Singh et al. 2010). Singh et al. (2007), reviewed the geology of Bundelkhand and suggested that the Bundelkhand Gneissic Complex (BnGC) is the oldest component that comprises high-grade metamorphics reaching up to granulite facies (Singh and Dwivedi 2009) that is followed by low-grade metamorphic rocks of green schist facies of the Basement metamorphic complex, known as the Bundelkhand metasedimentaries and metavolcanics (BMM). These low- and high-grade metamorphites have angular relationships with each other and are characterized by polyphase deformation. Physiographically, the area has been divided into two units, i.e. Southern Bundelkhand Pediplane Province and Northern Highly Eroding Composite Plain Province.
-
A.
North block (Jhansi–Lalitpur) comprises vast area with inclusion of metasediments and has regional Precambrian granite.
-
B.
The South block (south of Lalitpur) consists of Bundelkhand granitoid flanked in south by medium and low-grade metasedimentary of Mehroni group and sedimentary sequence of Bijawars. The study area is part of block ‘B’ (Fig. 2).
Fig. 2 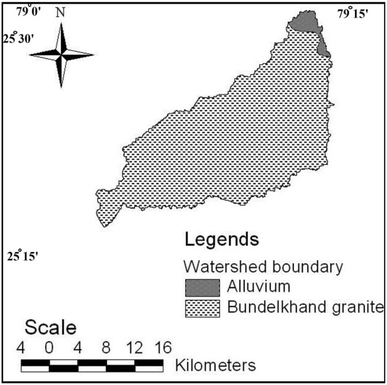
Geology of the study area

Materials and methods
For the present study, groundwater samples were collected at equally distributed locations to cover the entire study area. For collecting groundwater samples, plastic bottles were first washed by distilled water. The bottles containing groundwater samples were closed in field and were transported without any spillage. The chemical analysis of all the groundwater samples was carried out using standard methods recommended by American Public Health Association (APHA 1998). Some of the parameters of groundwater such as Temperature, ph and EC (Electrical Conductivity) were measured on spot in the field. Chemical analysis of all the samples for Na+, K+, Ca2+, Mg2+, F−, Cl−, NO3− and SO42− was carried out and were compared with standard values recommended by BIS. Moreover, the chemical parameters like PH, Hardness, TDS, Na+, K+, Ca2+, Cl− and SO42− were selected separately for generation of spatial distribution maps using point data analysis in GIS environment. Survey and India (SOI) Topo sheets, ERDAS Imagine 9.1, Arc GIS 10.2, Rockworks15 softwares were used for this spatial analysis and other diagrammatical representations of chemical data. For spatial analysis, point feature is prepared using the location data showing the position of water sample locations with the help of GPS technology to enhance spatial accuracy. The data obtained from chemical analysis for each groundwater sample are stored in excel format and is added to each point spatially drawn in Arc GIS 10.2 for the entire study area. These spatial and non-spatial data bases are jointly applied for generation of spatial distribution maps for analysing variation in hydrochemical parameters. The approach used to delineate the anomalous areas with respect to drinking, domestic and irrigation purpose from spatial distribution maps is Kriging and Inverse Distance weighted (IDW) spatial interpolation techniques.
Results and discussion
Physicochemical parameters of groundwater
The groundwater quality analysis is important in determining its suitability for different purposes. Physical and chemical parameters including statistical measures, such as minimum, maximum, mean and standard deviation are reported in (Tables 1, 2). The following water quality parameters were selected and their respective maps were prepared: pH, EC, TDS, TH, Cl−, SO42−, NO3−, Na+, Ca2+,Mg2+ and K; using point data spatial analysis of Arc GIS 10.2.
Hydrogen ion concentration (pH)
The pH value indicates the acidic or alkaline material present in the water. When substance dissolve in water they produced charged molecules called ions. Hydrogen (H+) ions are found more in acidic water whereas Hydroxyl (OH−) ions are in basic water. The pH scale ranges from 0 to 14, with 7 being neutral for pure water. Acidic water has pH values less than 7, with 0 being the most acidic; likewise the basic water has value greater than 7, with 14 being the most basic. A change in pH from 7 to 6 indicates that there is a tenfold increase in hydrogen ion concentration. Similarly, a change in pH from 7 to 8 indicates a tenfold increase in the hydroxyl ion. In the area, the pH of water samples range from 8.14 to 9.14 (Fig. 3a) with an average of 8.615 which indicates that groundwater of this area is generally alkaline in nature. The pH value in some parts of the study area was found to be 9.0 which is beyond the permissible limit as per Bureau of Indian Standards, due to the seepage of effluent and domestic sewage. If pH is not within the permissible limit, it damages mucous membrane present in nose, mouth, eye, abdomen and anus in human beings.

Spatial distribution map of PH, Hardness, TDS and Calcium
Total dissolved solids (TDS)
Water used for irrigation can vary greatly in quality depending upon type and quantity of dissolved salts. They originate from dissolution or weathering of the rocks and soil, including dissolution of lime, gypsum and other slowly dissolving soil minerals. These salts are carried with the water wherever it is used. In case of irrigation, the salts are mixed with the water and remain behind in the soil as water evaporates or is used by the crop. Salinity problem exists if salt accumulates in the crop root zone to a concentration that causes a loss in yield. Water with TDS up to 500 mg/l is considered desirable for drinking, 500–1000 mg/l is permissible for drinking, up to 3000 mg/l is useful for irrigation and the greater than 3000 mg/l is unsuitable for drinking and irrigation purposes (Davis and DeWiest 1966). The Total dissolved solids (TDS) observed for this area are between 1140 and 1960 mg/l and it reveals that water has moderate quality because TDS ranges around 1000–2000 mg/l (Fig. 3c). The TDS in the area may be due to influence of anthropogenic sources such as domestic sewage, industrial waste, septic tanks, agricultural activities and influence of rock–water interaction. Generally, the higher TDS causes gastro-intestinal irritation to the human beings and the prolonged intake of water with the higher TDS can also cause kidney stones and heart diseases (Garg et al. 2009).
Total hardness
Total hardness (TH) is caused primarily by the presence of cations such as calcium and magnesium and anions such as carbonate, bicarbonate, chloride and sulphate in water. Water hardness has no known adverse effects; however, some evidences indicate its role in heart diseases (Schroeder 1960) and hardness of 150–300 mg/l and above may cause kidney problems and kidney stone formation (Jain 1998), as it causes unpleasant taste and reduce ability of soap to produce lather. Total hardness is an important parameter of water for its use in domestic purpose. The acceptable limits for domestic use are 75 mg/l. Hard water is unsuitable for domestic use. In this area, the total hardness varies between 72 and 344 mg/l (Fig. 3b) with an average of 173.26 mg/l, which reveals that most of the samples are moderately hard to very hard water given in Table 3 (Sawyer and Mc Carty 1967). The ill effects of excess hardness are its undesirability mostly for economic or aesthetic reasons.
Magnesium (Mg2+) and Calcium (Ca2+)
Magnesium content of water is considered as one of the most important qualitative criteria in determining the quality of water for irrigation (Table 4). Calcium, magnesium and total hardness in the groundwater are inter-related. Generally, calcium and magnesium maintain a state of equilibrium in most waters. More magnesium in water will adversely affect crop yields as the soils become more alkaline. Calcium (Ca2+) is an important element to develop proper bone growth. It is found alkaline in nature. Calcium content is very common in groundwater, because they are abundantly available in most of the rocks and also due to its higher solubility. However, the range of its availability depends on the solubility of calcium carbonate and sulphate. In the present study, the magnesium content in water of Lakheri river averages 31.39 mg/l which reveals that water is suitable for irrigation purpose in terms of magnesium content. The calcium concentration in water samples collected from the study area ranged from 3.2064 to 46.4928 mg/l (Fig. 3d) and with an average value of 20.41971 mg/l. Thus, all the samples on the basis of calcium content fall in desirable limit for drinking purposes.
Magnesium (Mg2+) usually occurs in lesser concentration than calcium due to the fact that the dissolution of magnesium-rich minerals is slow process and that of calcium is more abundant in the earth’s crust. If the concentration of magnesium in drinking water is more than the permissible limit, it gives unpleasant taste to the water. Magnesium is an essential ion for functioning of cells in enzyme activation, but at higher concentrations it is considered as laxative agent (Garg et al. 2009), while deficiency may cause structural and functional changes in human beings. The acceptable limit is 30 mg/l as per standards (BIS 1991). In this area, the magnesium level in the water samples ranged from 1.949179 to 65.29751 mg/l with an average 31.39205. Therefore, the Mg2+ content exceeds the desirable limit in most of the water sample locations in the area.
Sodium (Na+)
Sodium concentration is important in classifying irrigation water because sodium reacts with soil to reduce its permeability. Excess sodium in waters produces undesirable effects by changing soil properties and reducing soil permeability. Hence, the assessment of sodium concentration is of utmost importance while considering the suitability of irrigation water. In all natural waters per cent of sodium content is a parameter to evaluate its suitability for agricultural purposes (Wilcox 1948); sodium combining with carbonate can lead to the formation of alkaline soils, while sodium combining with chloride forms saline soils. Both these soils do not help for the growth of plants. Sodium content is usually expressed in terms of per cent sodium (%Na) and Sodium (Na+) occurs as a major cation in the water samples obtained by the following equation:
where ionic concentrations are in epm. The calculated values of per cent sodium range 10.13–53.83 ml/l (Fig. 4a) with an average of 30.7.

Shows spatial distribution map of Sodium
The chemical quality of groundwater samples was studied from plots of percentage of sodium and electrical conductivity on the Wilcox diagram. Wilcox diagram revealed that out of 19 samples in the study area 82 per cent belongs to permissible to doubtful category, followed by 18 per cent samples belonging to good to permissible category for irrigation (Table 5). The agricultural crop yields are generally low in lands irrigated with waters belonging to permissible to doubtful category. This is probably due to the presence of excess sodium salts, which causes osmotic effects on soil plant system. When the concentration of sodium is high in irrigation water, sodium ions tend to be adsorbed by clay particles, displacing Mg and Ca ions. This exchange process of Na in water for Ca and Mg in soil reduces the permeability and eventually results in soil with poor internal drainage. Hence, air and water circulation is restricted during wet conditions and such soils are usually hard when dry (Collins and Jenkins 1996; Saleh et al. 1999). Also the sodium concentration more than 50 mg/l makes the water unsuitable for domestic use because it causes severe health problems like hypertension (Patnaik et al. 2002). The higher concentration of sodium may pose a risk to persons suffering from cardiac, renal and circulatory diseases (Haritash et al. 2008).
Potassium (K+)
Generally the behaviour of potassium (K+) is similar to the sodium content in the water but not found in the concentration as much as the sodium in groundwater. It maintains fluids in balance stage in the human body. In present investigation, potassium concentration ranged from 4 to 80 mg/l (Fig. 4b) with an average value of 23.526. The permissible limit of potassium is 10 mg/l (BIS 1991) and in study area, 12 water sampling sites exceed the permissible limit. Thus, the excess amount of potassium present in the water sample may lead to nervous and digestive disorder (Tiwari and Mishra 1985). The higher values in the area may be contributed due to the effluent discharged by industries and domestic sewages. However, excessive fertilizer usage may also increase its concentration in groundwater.
Chloride (Cl−)
Chloride (Cl−) is a widely distributed element in all types of rocks in one or the other form. Therefore, its concentration is high in groundwater where the temperature is high and rainfall is less. Mostly, the chlorides are found in the form of sodium chloride in the groundwater. Soil porosity and permeability also has a key role in building up the chloride concentration. Chloride imparts a salty taste and some times higher consumption causes hypertension, risk for stroke, left ventricular hypertension, osteoporosis, renal stones and asthma in human beings (McCarthy 2004). Although the chloride plays an important role in balancing level of electrolyte in blood plasma, higher concentration can produce some physical disorders. In the area, the chloride concentration showed variation from 8.52 to 193.12 mg/l (Fig. 5a) with an average of 59.64. The limit of Cl− (mg/l) concentration is 250–1000 (BIS standard), 200 is maximum acceptable limit and 600 is maximum allowable limit for drinking water specification (WHO 1984).

Spatial distribution map of chloride and sulphate
Spatial distribution shows few places with higher concentration, which could be dangerous from health point of view. The high chloride may be attributed to industrial, domestic wastes, leaching from upper soil layers in dry climates and natural geochemical activities in the area.
Sulphate (SO4 2−)
The sulphate (SO42−) ion one of the important anions present in natural water that produce catharsis, dehydration and gastrointestinal irritation effect upon human beings when it is present in excess of 150 mg/l. It is mainly derived from gypsum on oxidation of pyrites. The sulphide minerals add the soluble sulphate into the groundwater through oxidation process. In the present investigation, the sulphate concentration ranged from 82.3 to 411.5 mg/l with an average of 190.59 shown in spatial distribution diagram (Fig. 5b). In the area, seven places are having sulphate ion concentration more than 200 and the higher sulphate content may be contributed due to biochemical, anthropogenic sources and industrial process, etc.
Residual sodium carbonate (RSC)
Residual sodium carbonate (RSC) can be used as a criterion for assessing the suitability of irrigation waters. The water having higher carbonate and bicarbonate concentration than the alkaline earth mainly calcium and magnesium concentration, diminishes the water quality and affects agriculture unfavourably (Eaton 1950; Richards 1954). RSC can be computed using the following formula, where ions were expressed in meq/l:
If RSC < 1.25 meq/l, the water is considered safe. If RSC lies between 1.25 and 2.5 meq/l, the water is of marginal quality. If RSC > 2.5 meq/l, the water is unsuitable for irrigation. The RSC variation was drawn using (Richards 1954) as good, medium and bad categories.
The classification of groundwater for irrigation purpose according to the RSC values indicates that about eighty per cent of the water samples are of unsuitable category, ten per cent samples are marginal and safe irrigation purposes. Continued usage of high residual sodium carbonate water affects the yields of crops.
The concentration of bicarbonate and carbonate also influences the suitability of water for irrigation purpose. One of the empirical approaches is based on the assumption that all Ca2+ and Mg2+ precipitate as carbonate. Considering this hypothesis, (Eaton 1950), proposed the concept of residual sodium carbonate (RSC) for the assessment of high carbonate waters. The water with high RSC has high pH and land irrigated with such water becomes infertile owing to deposition of sodium carbonate; as known from black colour of the soil. According to U.S. Salinity Laboratory, an RSC value less than 1.25 meq/l is safe for irrigation. A value between 1.25 and 2.5 meq/l is of marginal quality and value more than 2.5 meq/l is unsuitable for irrigation. In the present study, RSC values range between 0.26 and 15.64 meq/l with an average value 4.99. Only the location 9 (Rippa Dhamna) is considered excellent for irrigation in Table 6. Thus, water of Lakheri river cannot be considered safe for irrigation purpose as mentioned according to above considerations. Besides, bicarbonate is a major element in human body, which is necessary for digestion. The bicarbonate has no known adverse effects on human health; if it exceeds 300 mg/l in the drinking water, it may lead to kidney stones in the presence of higher concentration of Ca, especially in dry climatic conditions.
Permeability index (PI)
The soil permeability is affected by long-term use of irrigation water and is influenced by sodium, calcium, magnesium and bicarbonate contents of the soil. The permeability index (PI), as developed by (Doneen 1964), indicates the suitability of groundwater for irrigation. It is defined as follows:
PI = [(Na+ + √HCO3−)/(Ca2+ + Mg2+ + Na+)] 100 (All value are expressed in epm)
Sodium, calcium, magnesium and bicarbonate content of the soil influence it. Doneen (1964), evolved a criterion for assessing the suitability of water for irrigation based on the permeability index. In the present study, the minimum value of PI is 6.06 and maximum is 32.04 and the average value is 13.42.
Salinity
The EC and Na concentrations are important in classifying irrigation water. The electrical conductivity values range from 780 to 1540 μS/cm with an average of 1189 μS/cm given in Table 7. A high salt content (high EC) in irrigation water leads to formation of saline soil. This affects the salt intake capacity of the plants through their roots. On the basis of electrical conductivity values, Richards (1954) classified irrigation water into four groups. As per Richards classification, all 19 samples are fair. Groundwater samples falling in medium salinity hazard can be used, if a moderate amount of leaching occurs. High salinity waters cannot be used on soil with restricted drainage. Excess salinity reduces the osmotic activity of plants and thus interferes with the absorption of water and nutrients from the soil (Saleh et al. 1999).
Hydro-chemical facies
As water flows through an aquifer, it assumes a characteristic chemical composition as a result of interaction with the lithologic framework. The term hydro-chemical facies is used to describe the bodies of groundwater in an aquifer that differs in their chemical composition. The facies are a function of the lithology, solution kinetics and flow patterns of the aquifer. Hydro-chemical facies can be classified on the basis of dominant ions using the Piper’s trilinear diagram. The concentrations of major ionic constituents of groundwater samples were plotted in the Piper Trilinear diagram (Piper 1944) to determine the water type (Fig. 6). The classification for cation and anion facies, in terms of major-ion percentages and water types, is according to the domain in which they occur on the diagram segments. From the cationic and anionic triangular fields of Piper diagram, it is observed that 100% of groundwater samples fall into the no dominant type; conversely, 35% of these groundwater samples fall into the bicarbonate type and other 20% into the no dominant type and 45% into the sulphate type in anion facies. The diamond shaped field between the two triangles is used to represent the composition of water with respect to both cations and anions. The points for both the cations and anions are plotted on the appropriate triangle diagrams. The positions of the points are projected parallel to the magnesium and sulphate axes, respectively, until they intersect in the centre field. The plot of chemical data on diamond shaped trilinear diagram reveals that majority of groundwater samples fall in the fields of 1 and indicates that alkaline earth exceeds alkalies and alkalies exceeds alkaline earth. From the data plots (Fig. 6), it is apparent that the total hydrochemistry is dominated by alkaline earths.

Piper diagram for describing the hydro-chemical facies variation
The ion concentration of sample of all locations is also shown by Durov Diagram (1948), which is alternative to the Piper diagram. In the Durov diagram, two triangles are used for ploting major ions as percentage of milliequavalent. The square grid which lies perpendicular to the third axis in each triangle, is used to project the data points from two triangles. According to the Durov diagram (Fig. 7), it can be found that sodium ion is high in each sample while as Cl and CO3 are two equally dominant ions in the water samples of the study area.

Durov diagram of water samples
Groundwater for irrigation purpose
The water quality used for irrigation is essential for the crop yield and quantity, maintenance of soil productivity and protection of the environment. The quality of irrigation water is very much influenced by the land constituents of the water source. The important parameters affecting the suitability of groundwater for irrigation purposes are: Electrical Conductivity (EC), Sodium adsorption ratio (SAR), Sodium percentage (Na %) and Residual sodium carbonate (RSC).
The most influential water quality guideline on crop productivity is the water salinity hazard as measured by electrical conductivity (Ec). The primary effect of high Ec water on crop productivity is the inability of the plant to compete with ions in the soil solution for water (physiological drought). The higher the Ec, the less water is available to plants, even though the soil may appear wet. Because plants can only transpire “pure” water, usable plant water in the soil solution decreases dramatically as Ec increases. Water with Ec less than 250 μs/cm is considered good and that with greater than 750 μs/cm is unsuitable for irrigation in Table 8. The minimum Ec was recorded 780 μs/cm in the Mauranipur area. The maximum Ec was recorded 1540 μs/cm in the Markua area. The large variation in EC is mainly due to lithologic composition and anthropogenic activities prevailing in this region. It is observed that in some samples the EC values increase with the increasing amounts of sulphate, chloride, bicarbonate and hardness as CaCO3.
Sodium adsorption ratio (SAR)
Although sodium contributes directly to the total salinity, the main problem with a high sodium concentration is its effect on the physical properties of soil. The water with high salt (EC) leads to formation of saline soil while as high sodium (SAR) leads to development of an alkaline soil. This Na enriched water causes soil aggregates to disperse, reducing its permeability (Tijani 1994). The sodium hazard is typically expressed as sodium adsorption ratio (SAR). This index quantifies the proportion of sodium to calcium and magnesium ions in a water sample. Sodium hazard of irrigation water can be well understood by knowing SAR. Sodium Adsorption Ratio (SAR) is most commonly used to assess suitability of irrigation water. The SAR measures sodicity in terms of the relative concentration of sodium ions to the sum of calcium and magnesium ions in a water sample. Sodium concentration in water effects deterioration of the soil properties reducing permeability (Richards 1954). SAR is calculated using the following formula:
SAR = Na+/√[(Ca2+ + Mg2+)/2], where the ionic concentrations are expressed in meq/l.
Excess sodium in waters produces the undesirable effects of changing soil properties and reducing soil permeability. Hence, the assessment of sodium concentration is necessary while considering the suitability for irrigation. The degree to which irrigation water tends to enter into cation-exchange reactions in soil can be indicated by the sodium adsorption ratio. Sodium replacing adsorbed calcium and magnesium is a hazard, as it causes damage to the soil structure. It becomes compact and impervious. SAR is an important parameter for the determination of suitability of irrigation water because it is responsible for the sodium hazard. The waters were classified in relation to irrigation based on the range of SAR values. Water with SAR ranging from 0 to 3 is considered good and with greater than 9 is considered unsuitable for irrigation purpose. In the present study, SAR was found in the range of 1.69–26.10 with an average value of 8.97. The high value of SAR for Lakheri river water cannot be categorized as water of excellent category. It cannot be used for irrigation on almost all soil types. The plot for SAR vs EC (Fig. 8) values when lesser than 10 indicates low SAR with medium salinity, high salinity, very high salinity and values greater than 10 requires careful management by application of gypsum, which makes water feasible and increases soil permeability (Goel 2000). Na is important cation which in excess deteriorates the soil structure and reduces crop yield (Srinivasamoorthy et al. 2009). When the concentration of Na is high in irrigation water, Na tends to be adsorbed by clay particles displacing Mg and Ca ions. This exchange process of Na in water for Ca and Mg in soil reduces the permeability and results in soil with poor internal drainage. Hence, air and water circulation is restricted during wet conditions and become hard when dry (Collins and Jenkins 1996). Na causes an increase in the hardness of soil as well as reduction in its permeability (Tijani 1994).

US salinity diagram for classification of irrigation waters (after Richards 1954)
There is a significant relationship between sodium adsorption ratio of irrigation water and the extent to which sodium is absorbed by the soils. If water used for irrigation is high in sodium and low in calcium content, then exchangeable calcium in soil may replace sodium by Base Exchange reaction in water. This can destroy the soil structure owing to dispersion of the clay particles. The analytical data plotted on the U. S. Salinity Laboratory Diagram (Richards 1954) illustrates that most of the groundwater samples fall in the field of C3S1 (High salinity with low sodium), C3S2 (high salinity with medium sodium), C3S3 (high salinity with high sodium) and one sample fall in (high salinity with very high sodium) waters, which cannot be used for irrigation on almost all types of soil with little danger of exchangeable sodium.
The Stiff diagram (Fig. 9) is also used for investigation of cation and anion dominance at different locations. Sample wise composition is also shown by Stiff diagram which is in common cations and anions, with concentration represented in electrical equivalents. Analysis of Stiff diagram shows highest concentration of (Na + K) followed by Mg among the cations, whereas, in the area, anions (Cl, SO4, CO3) showed unequal dominance at different locations but Cl and CO3 concentration is more at some locations in the study area. The highest concentration of Na and CO3 may possibly increase pH, electrolyte conductivity (EC) and SAR of the soil.

Stiff diagram showing cation and anion concentration in all samples separately
According to (Wilcox 1955) diagram Fig. 10, relating sodium percentage and total concentration, indicates that most of samples of the groundwater fall in the field of good to permissible suitability and five samples are unsuitable for irrigation, respectively. The agricultural yields are, generally, very low in the lands irrigated with the water of unsuitable category due to the presence of excess sodium salts. This causes osmotic effects on soil–plant system. In addition to the SAR and Na%, the excess sum of carbonate and bicarbonate in groundwater over the sum of calcium and magnesium also influences the unsuitability of groundwater for irrigation. This is termed as residual sodium carbonate (RSC) (Richards 1954). The RSC is calculated using the formula given below: RSC = (HCO3− + CO32−) − (Ca2+ + Mg2+), where the concentrations are expressed in meq/l. If RSC < 1.25 meq/l, the water is considered safe and is only for Rippa dhamna area. If RSC lies between 1.25 and 2.5 meq/l, the water is of marginal quality and is for Markua, Gursarai, Kotra and Dogra. If RSC > 2.5 meq/l, the water is unsuitable for irrigation. In the study area, most of the samples fall in RSC > 2.5 meq/l category which indicates water is not suitable for irrigation. The RSC variation was drawn using (Richards 1954) as good, medium and bad categories.

The Wilcox diagram of water samples
Conclusion
Groundwater quality of an area was analysed to understand its suitability for drinking, domestic and irrigation purposes. The average pH of groundwater is 8.615 which indicates alkaline nature and an average hardness of 173.26 mg/l which reveals that most of the samples are moderately hard to very hard water. The TDS observed ranges between 1140 and 1960 mg/l indicate that water is of moderate quality. From the cationic and anionic triangular fields of Piper diagram, it is observed that 100% of groundwater samples fall into the no dominant type; conversely, 35% of these groundwater samples fall into the bicarbonate type, and other 20% into the no dominant type and 45% into the sulphate type in anion facies. The concentration of physiochemical constituents in the water samples was compared with the Bureau of Indian Standards (BIS) to know the suitability of water for drinking. Based on the analysis, most of the area at many locations in industrial area falls in moderately polluted to severely polluted, making the water unsuitable for drinking purposes. Various determinations such as sodium adsorption ratio (SAR), per cent sodium (Na%) and residual sodium carbonate (RSC) revealed that most of the samples are also unsuitable for irrigation. According to the quality classification of irrigation water proposed by Wilcox and US salinity classification, most samples fall in the permissible to doubtful range for irrigation purpose. It was observed that the quality of groundwater was not suitable for drinking purpose in industrial area. Ground water at some sampling sites is unsuitable because of influence of urban and industrial waste discharge, aquifer mineralogy and with other anthropogenic activities and increased intervention of humans in deteriorating the groundwater quality of the area. All these hydro -geochemical characteristics were spatially analysed so that it will be easily understood and beneficial to human society.
References
Ali SA (1988) Morphometric analysis of the Hiyunl River Basin at Rishikesh, Garhwal Himalayas, India. In Proceedings of the IX Asian conference on remote sensing, Bangkok, 23–29 November, B-9-1to B-9-8
Ali SA (2000) Trend surface analysis of microlineaments in Parsoli-Bichor area of Vindhyan Basin, Rajasthan. Indian J Pet Geol 9(2):37–48
Ali I, Ali SA (1984) Photocharacters of Vindhyan sedimentaries in parts of Chittorgarh District, Rajasthan. Photonirvachak J Indian Soc Photointerpret Remote Sens 12(2):27–32
Ali U, Ali SA (2014) Analysis of drainage morphometry and watershed prioritization of Romushi - Sasar Catchment, Kashmir Valley, India using Remote Sensing and GIS Technology. Int J Adv Res 2(12):5–23
Ali SA, Ali U (2015) Litho-structural mapping of Sind catchment (Kashmir Basin), NW Himalaya, using Remote Sensing & GIS Techniques. Int J Sci Res 4(7):1325–1330
Ali SA, Khan N (2013a) Evaluation of morphometric analysis- a remote sensing & GIS based approach. Open J Mod Hydrol 3(1):20–27
Ali SA, Khan N (2013b) Hydrochemistry and quality assessment of groundwater in Banas river basin, Rajasthan, India. J Environ Res Dev 8(2):280–290
Ali SA, Piresteh S (2004) Geological applications of Landsat Enhenced Thematic Mapper (ETM) imagery and Geographic Information System (GIS): Mapping & Structural Interpretation in Zagros Structural Belt (ZSB) SW, Iran. Int J Remote Sens 25(21):4715–4727
Ali SA, Piresteh S (2005) Evaluation of ground water potential zones in parts of Pabdeh Anticline, Zagros Fold Belt, SW Iran. Water Ethiop J Water Sci Technol 9(1):92–97
Ali SA, Tesgaya D (2010) Landuse and landcover change detection between 1985–2005 in parts of highland of eastern Ethiopia using remote sensing and GIS techniques. Int J Geoinf 6(2):35–40
Ali SA, Rangzan K, Piresteh S (2003a) Remote sensing and GIS study of Tectonics and net erosion rates in the Zagros Structural Belt, Southwestern Iran. Map Sci Remote Sens 40(4):253–262
Ali SA, Rangzen K, Pirasteh S (2003b) Use of digital elevation model for study of drainage morphometry and identification of stability and saturation zones in relations to landslide assessments in parts of Shahbazan Area, Zagros Belt, SW Iran. Cartography 32(2):162–169
APHA (1998) Standard methods for the examination of water and wastewater, 21st edn. Am Public Health Assoc, Washington DC
BIS (1991) Indian standards specifications for drinking water, Bureau of Indian Standards, IS:10500
Carpenter SR, Caraco NF, Correll DL, Howarth RW, Sharpley AN, Smith VH (1998) Nonpoint pollution of surface waters with phosphorus and nitrogen. Ecol Appl 8(3):559–568
Collins R, Jenkins A (1996) The impact of agricultural land use on stream chemistry in the middle Hills of Himalaya, Nepal. J Hydrol 185(71):86
Davis SN, DeWiest RJ (1966) Hydrogeology. Wiley, New York
Doneen LD (1964) Notes on water quality in agriculture, water science and engineering. 4001, University of California, Davis
Durov SA (1948) Natural waters and graphical representation of their composition. Dokl Akad Nauk SSSR 59:87–90
Eaton EM (1950) Significance of carbonate in irrigation water. Soil Sci 69:123–133
Garg VK, Suthar S, Singh S, Sheoran A, Garima M, Jai S (2009) Drinking water quality in villages of southwestern Haryana, India: assessing human health risks associated with hydrochemistry. Environ Geol 58:1329–1340
Goel PK (2000) Water pollution-causes, effects and control, New Delhi, New Age Int. (P) Ltd
Griffith AJ (2001) Geographic techniques and recent applications of remote sensing to landscape-water quality studies. Water Air Soil Pollution 138:181–197
Haritash AK, Kaushik CP, Kanal A, Kumar YA (2008) Suitability assessment of groundwater for drinking, irrigation and industrial use in some North Indian Villages. Environ Monit Assess 145:397–406
Humphreys WF (2009) Hydrogeology and groundwater ecology: does each inform the other. Hydrogeol J 17(1):5–21
Iqbaluddin Ali, Ali SA (1983) Landscape evolution in the Vindhyan Basin of Rajasthan. Photonirvachak J Indian Soc Photointerpret Remote Sens 11(1):15–22
Jain PK (1998) Hydrology and quality of groundwater around Hirapur district, Sagar (M.P)—a case study of protozoic rocks. Pollut Res 17(1):91–94
Kolpin D (1997) Agricultural chemicals in groundwater of the Midwestern United States: relations to land use. J Environ Qual 26:1025–1037
Matson P, Parton J, Power A, Swift M (1997) Agricultural intensification and ecosystem properties. Science 277:504–509
McCarthy MF (2004) Should we restrict chloride rather than sodium. Med Hypotheses. 63:138–148
Milovanovic M (2007) Water quality assessment and determination of pollution sources along the Axios/Vardar River, Southeastern Europe. Desalination 213:159–173
Patnaik KN, Sathanarayan SV, Rout SP (2002) Water Pollution from major industries in Pradip Area—a case study. Indian J Environ Health 44(3):203–211
Piper AM (1944) A graphical procedure in the geochemical interpretation of water. Am Geophys Union Trans 25:914–928
Pirasteh S, Ali SA, Hussaini HS (2007) Morphmetric and structural analysis in Zagros Mountains, Southwest Iran-an application of geo-information technology. J Geomat 1(2):39–44
Piresteh S, Ali SA (2004) Lithostratigraphical study from Dezful to Brojerd-Dorood area SW Iran using digital topography, remote sensing and GIS. Indian J Pet Geol 13(2):13–23
Ramkumar T, Venkarramanan S, Anithamary I, Ibrahim SM (2012) Evaluation of hydrogeochemical parameters and quality assessment of the groundwater in Kottur blocks, Tiruvarur district, Tamilnadu, India. Arab J Geosci 6:101–108
Richards LA (1954) Diagnosis and improvement of saline and alkali soils. Agriculture Handbook 60, Department of Agricultural, Washington DC: US
Sadashivaiah C, Ramakrishnaiah CR, Ranganna G (2008) Hydrochemical analysis and evaluation of groundwater quality in Tumkur taluk, Karnataka state. India. Int J Environ Res Publ. 5(3):158–164
Saleh A, AL-RUwaih F, Shehata M (1999) Hydrogeochemical processes operating within the main aquifers of Kuwait. J Arid Environ 42:195–209
Sarma VVJ, Narayanaswamy A (1981) Groundwater quality in Visakhapatnam Basin. India. Water Air Soil Pollut 16(3):317–329
Sawyer CN, McCarty PL (1967) Chemistry for sanitary engineers, 2nd edn. McGraw-Hill, New York
Schroeder HA (1960) Relations between hardness of water and death rates from certain chronic and degenerative diseases in the United States. J Chronic Dis 12:586–591
Singh SP, Dwivedi SB (2009) Garnet–sillimanite–cordierite–quartz bearing assemblages from early Archean supracrustal rocks of Bundelkhand Massif, Central India. Curr Sci 97:103–107
Singh SP, Singh MM, Srivastava GS, Basu AK (2007) Crustal evolution in Bundelkhand area, Central India. J Himal Geol 28(2):79–101
Singh SP, Balaram V, Satyanarayanan M, Anjaiah KV, Kharia A (2010) Platinum group elements in basic and ultrabasic rocks around Madawara, Bundelkhand Massif, Central India. Curr Sci 99(3):375–383
Srinivasamoorthy K, Chidambaram S, Vasanthavigar M (2009) Application of multivariate statistical techniques in elucidation of hydrogeochemical data: a case study. Inter J Ecol Environ Stat 14(S09):98–109
Steube C, Richter S, Griebler C (2009) First attempts towards an integrative concept for the ecological assessment of groundwater ecosystems. Hydrogeol J 17(1):23–35
Subramani T, Elango L, Damodarasamy SR (2005a) Groundwater quality and its suitability for drinking and agricultural use Chithar River Basin, Tamil Nadu, India. Environ Geol 47:1099–1110
Subramani T, Elango L, Damodarasamy SR (2005b) Groundwater quality and its suitability for drinking and agricultural use in Chithar River basin, Tamil Nadu, India. J Environ Geol 47:1099–1110
Tijani MN (1994) Hydrochemical assessment of groundwater in Moro area, Kwara State, Nigeria. Environ Geol 24:194–202
Tiwari TK, Mishra MA (1985) A preliminary assignment of water quality index of major Indian rivers. Indian J Environ Prot 5:276–279
Vasanthavigar M, Srinivasamoorthy K, Vijayaragavan K, Rajiv Ganthi R, Chidambaram S, Anandhan P, Manivannan R, Vasudevan S (2010) Application of water quality index for groundwater quality assessment: thirumanimuttar sub-basin, Tamilnadu, India. Environ Monit Assess 171:595–609
WHO (1984) Guideline of drinking quality. World Health Organization, Washington DC, pp. 333–335
Wilcox LV (1948) The quality water for irrigation use. US Dept, Agric Bull, p 40
Wilcox LV (1955) Classification and use of irrigation waters. USDA, Washington DC, USA
Acknowledgements
Our special thanks are due to the Council of Science and Technology U.P. India for sanctioning the project for this research. Chairperson, Department of Geology, A.M.U. Aligarh, India thanked for providing laboratory facilities.
Publisher’s Note
Springer Nature remains neutral with regard to jurisdictional claims in published maps and institutional affiliations.
Author information
Authors and Affiliations
Corresponding author
Rights and permissions
Open Access This article is distributed under the terms of the Creative Commons Attribution 4.0 International License (http://creativecommons.org/licenses/by/4.0/), which permits unrestricted use, distribution, and reproduction in any medium, provided you give appropriate credit to the original author(s) and the source, provide a link to the Creative Commons license, and indicate if changes were made.
About this article

Cite this article
Ali, S.A., Ali, U. Hydrochemical characteristics and spatial analysis of groundwater quality in parts of Bundelkhand Massif, India. Appl Water Sci 8, 39 (2018). https://doi.org/10.1007/s13201-018-0678-x
Received:
Accepted:
Published:
DOI: https://doi.org/10.1007/s13201-018-0678-x