
Abstract
Alzheimer’s disease (AD) is a chronic, irreversible brain disorder, no effective cure for it till now. However, available medicines can delay its progress. Therefore, the early detection of AD plays a crucial role in preventing and controlling its progression. The main objective is to design an end-to-end framework for early detection of Alzheimer’s disease and medical image classification for various AD stages. A deep learning approach, specifically convolutional neural networks (CNN), is used in this work. Four stages of the AD spectrum are multi-classified. Furthermore, separate binary medical image classifications are implemented between each two-pair class of AD stages. Two methods are used to classify the medical images and detect AD. The first method uses simple CNN architectures that deal with 2D and 3D structural brain scans from the Alzheimer’s Disease Neuroimaging Initiative (ADNI) dataset based on 2D and 3D convolution. The second method applies the transfer learning principle to take advantage of the pre-trained models for medical image classifications, such as the VGG19 model. Due to the COVID-19 pandemic, it is difficult for people to go to hospitals periodically to avoid gatherings and infections. As a result, Alzheimer’s checking web application is proposed using the final qualified proposed architectures. It helps doctors and patients to check AD remotely. It also determines the AD stage of the patient based on the AD spectrum and advises the patient according to its AD stage. Nine performance metrics are used in the evaluation and the comparison between the two methods. The experimental results prove that the CNN architectures for the first method have the following characteristics: suitable simple structures that reduce computational complexity, memory requirements, overfitting, and provide manageable time. Besides, they achieve very promising accuracies, 93.61% and 95.17% for 2D and 3D multi-class AD stage classifications. The VGG19 pre-trained model is fine-tuned and achieved an accuracy of 97% for multi-class AD stage classifications.
Introduction
The most common cause of dementia is Alzheimer’s disease (AD) because 60–80% of dementia cases account for it [1, 2]. In a neurodegenerative form of dementia, AD starts with mild cognitive impairment (MCI) and gradually gets worse. It affects brain cells, induces memory loss, thinking skills, and hinders performing simple tasks [3, 4]. Therefore, AD is a progressive multi-faceted neurological brain disease. The persons with MCI are more likely to develop AD than others [5, 6]. People observe the effects of AD only after years of changes in the brain because it initiates two decades or more before the symptoms are detected. Alzheimer’s disease International (ADI) reports that more than 50 million people worldwide are dealing with dementia. By 2050, this percentage is projected to increase to 152 million people, which means that every 3 s, people develop dementia.
The estimated annual cost of dementia is expected to be $1 trillion and is predicted to double by 2030 [7]. Depending on the age, the proportion of people affected by AD varies. Figure 1 shows 5.8 million Americans in the United States (US) aged 65 and older with AD in 2020. And by 2050, it is expected to reach 13.8 million [5].

A proportion of people affected by AD according to ages in the United States [5]
The biggest challenge facing Alzheimer’s experts is that no reliable treatment available for AD so far [8, 9]. Despite this, the current AD therapies can relieve or slow down the progression of symptoms. So, the early detection of AD at its prodromal stage is critical [10, 11]. Computer-Aided System (CAD) is used for accurate and early AD detection to avoid AD patients’ high care costs, which are expected to rise dramatically [12]. In the early AD diagnosis, traditional machine learning techniques typically take advantage of two types of features [13], namely, region of interest (ROI)-based features and voxel-based features. More specifically, they rely heavily on basic assumptions, such as regional cortical thickness, hippocampal volume, and gray matter volume, regarding structural or functional anomalies in the brain [14, 15].
Traditional methods depend on manual feature extraction, which relies heavily on technical experience and repetitive attempts, which appears to be time-consuming and subjective. As a result, deep learning especially convolutional neural networks (CNNs) is an effective way to overcome these problems [16]. CNN can boost efficiency further, has shown great success in AD diagnosis, and it does not need to do handcrafted features extraction as it extracts the features automatically [17, 18].
In this study, an end-to-end Alzheimer’s disease early detection and classification (E2AD2C) framework is established focused on deep learning approaches and convolutional neural networks (CNN). Four stages of AD such as (I) Clinically Stable or Normal Control (NC), (II) Early Mild Cognitive Impairment (EMCI), (III) Late Mild Cognitive Impairment (LMCI), and (IV) Alzheimer’s disease (AD) are multi-classified. Besides, separate binary medical image classifications are implemented between each two-pair class of AD stages. This medical image classification is applied using two methods. The first method uses simple CNN architectures that deal with 2D and 3D structural brain scans from the ADNI dataset based on 2D and 3D convolution. The second method applies the transfer learning principle to take advantage of the pre-trained models for medical image classifications, such as the VGG19 model. In addition to that, using the final qualified architectures, Alzheimer’s checking web application is proposed. It helps doctors and patients to check AD remotely, determines the AD stage, and advises the patient according to its AD stage.
The remainder of this paper is organized as follows: in the “Related Work” section, the relevant works are reviewed. The “Problem Statement and Plan of Solution” section outlines the major issues and the aims of this study. In the “Methods and Materials” section, the methods and materials are discussed. In the “Experimental Results and Model Evaluation” section, the experiments and the results are assessed. The “Conclusion” section summarizes the paper.
Related Work
AD detection has been widely studied, and it involves several issues and challenges. A sparse autoencoder and 3D convolutional neural networks were used by Payan et al. [19]. They built an algorithm that detects an affected person’s disease status based on a magnetic resonance image (MRI) scan of the brain. The major novelty was the usage of 3D convolutions, which gave a better performance than 2D convolutions. The convolutional layer had been pre-trained with an auto-encoder, but it had not fine-tuned. Performance is predicted to improve with fine-tuning [20].
Sarraf et al. [21] used a commonly used CNN architecture, LeNet-5, to classify AD from the NC brain (binary classification). Hosseini et al. [22] developed the work presented in [19]. They predicted the AD by a Deeply Supervised Adaptive 3D-CNN (DSA-3D-CNN) classifier. Three stacked 3D Convolutional Autoencoder (3D-CAE) networks were pre-trained using CAD-Dementia dataset with no skull stripping preprocessing. The performance was measured using ten-fold cross-validation.
Korolev et al. [23] proved that an equivalent performance could be realized. When the residual network and plain 3D CNN architectures were applied on 3D structural MRI brain scans, the results showed that the two networks’ depth was very long, and the complexity was high. They did not achieve high performance as expected.
An eight-layer CNN structure was studied by Wang et al. [24]. Six layers served the feature extraction process in convolutional layers and two fully connected layers in classification. The results showed that max-pooling and Leaky Rectified Linear unit (LReLU) gave a high performance. Khvostikov et al. [25] used a 3D Inception-based CNN for the AD diagnosis. The method depended on Structural Magnetic Resonance Imaging (SMRI) and Diffusion Tensor Imaging (DTI) modalities fusion on hippocampal Regions of Interest (RoI). They compared the performance of that approach with the AlexNet-based network. Higher performance was reported by 3D Inception than by AlexNet.
A HadNet architecture was proposed to study Alzheimer’s spectrum MRI by Sahumbaiev et al. [26]. The dataset of MRI images is spatially normalized by Statistical Parametric Mapping (SPM) toolbox and skull-stripped for better training. It is projected that when the HadNet architecture improved, sensitivity and specificity would improve as well.
The model of Apolipoprotein E expression level4 (APOe4) was suggested by Spasov et al. [27]. MRI scans, genetic measures, and clinical evaluation were used as inputs for the APOe4 model. Compared with pre-trained models such as AlexNet [28] and VGGNet [29], the model minimized computational complexity, overfitting, memory requirements, prototyping speed, and a low number of parameters.
A novel CNN framework was proposed based on a multi-modal MRI analytical method using DTI or Functional Magnetic Resonance Imaging (fMRI) data by Wang et al. [30]. The framework classified AD, NC, and amnestic mild cognitive impairment (aMCI) patients. Although it achieved high classification accuracy, it is expected that using 3D convolution instead of 2D convolution would give better performance.
A shallow tuning of a pre-trained model such as Alex net, Google Net, and ResNet50 was suggested by Khagi et al. [31]. The main objective was to find the effect of each section of the layers in the results in the natural image and medical image classification. PFSECTL mathematical model was proposed by Jain et al. [32] based on CNN and VGG-16 pre-trained models. It worked as a feature extractor for the classification task. The model supported the concept of transfer learning.
Ge et al. [33] developed a 3D multi-scale CNN (3DMSCNN) model. For AD diagnosis, 3DMSCNN was a new architecture. Additionally, they proposed an enhancement strategy and feature fusion for multi-scale features. Graph Convolutional Neural Network (GCNN) classifier was proposed by Song et al. [34] based on the Graph-theoretic tools. They trained and validated the network using structural connectivity graphs representing a multi-class model to classify the AD spectrum into four categories.
For the detection of AD, Liu et al. [35] used speech info. The features of the spectrogram were extracted and obtained from elderly speech data. The system relied on methods for machine learning. Among the tested models, the logistic regression model gave the best results. Besides, a multi-model deep learning framework was proposed by Liu et al. [36]. Automatic hippocampal segmentation and AD classification were jointed based on CNN using structural MRI data. The learned features from the multi-task CNN and the 3D Densely Connected Convolutional Networks (3D DenseNet) models were combined to classify the disease status.
A protocol was introduced by Impedovo et al. [37]. This protocol offered a “cognitive model” for evaluating the relationship between cognitive functions and handwriting processes in healthy subjects and cognitively impaired patients. The key goal was to establish an easy-to-use and non-invasive technique for neurodegenerative dementia diagnosis and monitoring during screening and follow-up. A 3D CNN architecture is applied to 4D FMRI images for classifying four AD stages (AD, EMCI, LMCI, NC) by Harshit et al.[38]. In addition to that, other CNN structures that deal with 3D MRI for different AD stage classification are suggested by Silvia et al. [39] and Dan et al. [40]. A 3D Densely Connected Convolutional Networks (3D DenseNets) is applied in 3D MRI images for 4-way classification by Juan Ruiz et al. [41].
Problem Statement and Plan of Solution
Recently, numerous architectures that can accommodate AD detection and medical image classification have been proposed in the literature, as seen in the “Related Work” section. However, most of them lack applying transfer learning techniques, multi-class medical image classification, and applying Alzheimer’s disease checking web service to check AD stages and advise patients remotely. These issues have not been sufficiently discussed in the literature. So, the novelties of this study, according to other state-of-the-art techniques reviewed in the “Related Work” section, can be organized as follows:
• An end-to-end framework is applied for the early detection of Alzheimer’s disease and medical image classification.
• Medial image classification is applied using two methods as follows:
-
The first method is based on simple CNN architectures that deal with 2D and 3D structural brain MRI. These architectures are based on 2D and 3D convolution.
-
The second method uses transfer learning to take advantage of the pre-trained models such as the VGG19 model.
• The main challenges for medical images are the small number of the dataset. So, data augmentation techniques are applied to maximize the dataset’s size and prevent the overfitting problem.
• Resampling methods are used, such as “oversampling, downsampling” to overcome collected imbalanced dataset classes.
• Three multi-class medical image classification and 12 binary medical image classification have experimented with four AD stages.
• The experimental results give high performance according to nine performance metrics.
• Due to the COVID-19 pandemic, it is difficult for people to go to hospitals periodically to avoid gatherings and infections. Thus, Alzheimer’s disease checking web service for doctors and patients is proposed to check AD and determine its stage remotely. Then, it advises according to the specified AD stage.
Methods and Materials
Early detection of Alzheimer’s disease plays a crucial role in preventing and controlling its progress. Our goal is to propose a framework for the early detection and classification of the stages of Alzheimer’s disease. There will be a comprehensive explanation of the proposed E2AD2C framework workflow, the preprocessing algorithms, and medical image classification methods in the next sub-sections.
The Proposed E2AD2C Framework
The proposed E2AD2C framework comprises six steps, which are as follows:
Step 1—Data Acquisition Step: All trained data is collected from the ADNI dataset in 2D, T1w MRI modality. It includes medical image descriptions such as Coronal, Sagittal, and Axial in the DICOM format. The dataset consists of 300 patients divided into four classes AD, EMCI, LMCI, and NC. Each class has 75 patients with a total number of images of 21 and 816 scans. AD class contains 5764 images, EMCI has 5817 images, LMCI includes 3460 images, and NC has 6775 images. All medical data were derived with a size of 256 × 256 in 2D format. Table 1 depicts demographic data for 300 subjects from the ADNI dataset. It gives an overview of the data, such as the number of patients in each class, the ratio of male or female patients in each class, and the mean of ages with the standard deviation (STD). Figure 2 shows three slices in a two-dimensional format. The slices were extracted from an MRI scan in MR Accelerated Sagittal MPRAGE view, MR Axial Field Mapping view, and MR 3 Plane Localizer view.

Slices of MR images: Accelerated Sagittal MPRAGE view, Axial Field Mapping view, and 3 Plane. Localizer view from left to right of AD patient
Step 2—Preprocessing Step: The collected dataset suffers from imbalanced classes. To overcome this problem, we resampling the dataset using two methods (oversampling and undersampling). Oversampling means coping instances for the under-represented class, and undersampling means deleting instances from the over-represented class. We apply oversampling method on AD, EMCI, and LMCI. Also, the undersampling method is utilized for the NC class. All AD classes after resampling methods become 6000 MRI images. As a result, the dataset becomes 24,000 images. The dataset is then processed, normalized, standardized, resized, denoised, and converted to a suitable format. The data is denoised by a non-local means algorithm for blurring an image to reduce image noise.
Step 3—Data Augmentation Step: Due to the scarcity of medical datasets, the dataset is augmented using traditional data augmentation techniques such as rotation and reflection (flipping) that flips images horizontally or vertically. So, the dataset’s size becomes 48,000 images divided into 12,000 images for each class. The major reasons for using data augmentation techniques are to (i) maximize the dataset and (ii) overcome the overfitting problem.
The balanced augmented dataset of 48,000 MRI images is then shuffled and split into training, validation, and test set with a split ratio of 80:10:10 on a random selection basis for each class. Table 2 summarizes the resulting training, validation, and test set sizes for 4-way classification (AD vs. CN vs. EMCI vs. LMCI) as well as 2-way classification or multi-class and binary classifications.
Step 4—Medical Image Classification Step: In this step, four stages of AD spectrum (I) NC, (II) EMCI, (III) LMCI, and (IV) AD are multi-classified. Besides, separate binary classifications are implemented between each two-pair class. This medical image classification is done via two methods. The first method depends on simple CNN architectures that deal with 2D, 3D structural brain MRI scans based on 2D, 3D convolutions. The CNN architectures are built from scratch. The second method uses transfer learning techniques for medical image classification, such as VGG 19 model, to benefit from the pre-trained weights.
Step 5—Evaluation Step: The two methods and the CNN architectures are evaluated according to nine performance metrics.
Step 6—Application Step: Based on the proposed qualified models, an AD checking web application is proposed. It helps doctors and patients to check AD remotely, determines the Alzheimer’s stage of the patient based on the AD spectrum, and advises the patient according to its AD stage. The full pipeline of the proposed framework is shown in Fig. 3.

The proposed framework E2AD2C architecture
Preprocessing Techniques
Data Normalization
Data normalization is the process that changes the range of pixel or voxel intensity values. It aims to remove some variations in the data, such as different subject pose or differences in image contrast, to simplify subtle difference detection. Zero-mean, unit variance normalization, [−1, 1] rescaling, and [0, 1] rescaling are examples of the data normalization methods. The last method is applied in the current study. The difference between these normalization methods appears in Fig. 4. It illustrates an original image and its output shape based on applying the different data normalization methods.
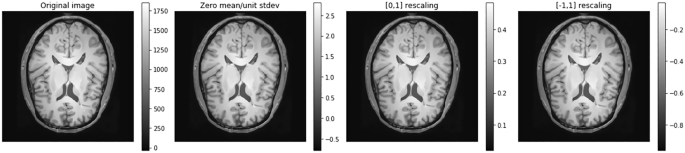
Example of the normalization methods applied on MRI image
Proposed Classification Methods and Techniques
Feature extraction, feature reduction, and classification are three essential stages where traditional machine learning methods are composed. All these stages are then combined in standard CNN. By using CNN, there is no need to make the feature extraction process manually. Its initial layers’ weights serve as feature extractors, and their values are improved by iterative learning. CNN gives higher performance than other classifiers. It consists of three layers: (i) the convolution layer performs the feature extraction process, (ii) the pooling layer performs the dimensionality reduction, and (iii) the fully connected layer performs the classification and converts from the two-dimensional matrices into a one-dimensional vector [42].
The convolutional layer represents a learnable filter that extracts features from an input image. For a 3D image with size H × W × C where H is the height, W is the width, and C is the number of channels. Using a 3D filter-sized FH × FW × FC where FH is the filter height, FW is the filter width, and FC is the number of filter channels. Therefore, the output activation map should be with a size of AH × AW, where AH is the activation height and AW is the activation width. The values of AH and AW can be obtained using Eqs. 1 and 2.
P represents the padding and S is the stride; n filters may exist, so the activation map size should become AH × Aw × n, as illustrated in Fig. 5.

Illustration of the convolutional operation
Non-linearity in the network is handled by the activation function, making a non-linear transformation to the neuron’s inputs. For the proposed binary classifier, we apply the sigmoid function in the output layer. It gives the probabilities of a data point belonging to a particular class in values between 0 and 1, calculated by Eq. 3. The Rectified Linear Unit (ReLU) activation function is applied for all hidden layers because of sigmoid drawbacks, as it gives zero results for the negative input values. So, the neuron is not activated, and only a definite number of neurons are activated, which accelerates the computation and training, calculated by Eq. 4. An improved version of the ReLU activation function is called the Leaky rectified linear layer (LReLU), calculated by Eq. 5. The difference between the three activation functions is depicted in Fig. 6.

The difference among the sigmoid, Relu, and LRelu activation functions [24]
For the proposed multi-classifier, the SoftMax function is used [32], which returns the probability for a data point belonging to each class, calculated from Eq. 6.
where x is the input vector, \({e}^{{x}_{i}}\) is the standard exponential function for the input vector, k is the number of classes in the multi-class classifier, and \({e}^{{x}_{j}}\) is the standard exponential function for the output vector.
For medical image classification and AD stage detection, we use two methods. The first method uses simple CNN architectures built from scratch. These architectures are a competitive tool for Multi-class medical image classification (M2IC) and binary medical image classification (BMIC) that deal with 2D, 3D MRI based on 2D, 3D convolution. So, we called these architectures (2D-M2IC, 3D-M2IC, 2D-BMIC, and 3D-BMIC). The 2D-M2IC model uses three convolutional layers in a two-dimensional format by convolutional kernels (sized: 3 × 3), with 3 max-pooling kernels (sized: 2 × 2). After that, there are two dropout layers followed by a flatten layer and 2 FC layers. Rectified linear layer (ReLU) is the activation function of the hidden layers. Eventually, a final FC layer with a softmax activation function is used to handle the four stages of Alzheimer’s disease. The dataset format in this model is the 2D format with a size of (100 × 100) pixels for MRI images. The architecture of the 2D-M2IC model is shown in Fig. 7.

The 2D-M2IC model architecture
The 3D-M2IC model has the same structure as the 2D-M2IC model, but it uses 3D convolutional layers. It comprises three convolution layers, three max-pooling, and 2 FC layers, followed by a softmax output layer. All 3D convolution kernels are sized 3 × 3 × 3 with a stride value of 1 in all three dimensions. All pooling kernels are sized 2 × 2 × 2. The 2D MRI medical images’ processing is performed to convert them to the 3D format with size (50 × 30 × 20) voxels to be more suitable to this model, as shown in Fig. 8. The number of trainable parameters is 875.588 and 1,654,468 for 2D-M2IC and 3D-M2IC, respectively. The number of non-trainable parameters is zero for the two architectures. The Adam optimization algorithm is also used in the proposed models to improve the weights with a learning rate = “0.0001” to optimize the loss function.

The 3D-M2IC model architecture
The second method uses the transfer learning principle for medical image classification. Transfer learning is a deep learning procedure whereby a neural network model is first trained on a problem similar to the issue being solved. Transfer learning’s key benefit is that (i) it benefits from the pre-trained weights resulting from the training of millions of images from the ImageNet database. (ii) It decreases the training time for a learning model. (iii) Its ability to reduce generalization errors. Therefore, we use the VGG-19 pre-trained model for MRI multi-class classification. VGG-19 is a convolutional neural network that has 19 layers in its architecture. A basic fine-tuning is applied to the final layer of VGG19 to be optimal for the proposed medical image classification problem. The trainable parameter for fine-tuned VGG19 is 25,433,540, and the non-trainable parameter is zero. The tuning applied in the VGG 19 model is shown in Table 3.
Experimental Results and Model Evaluation
The proposed models take into consideration different conditions. The experimental results are analyzed in terms of nine performance metrics: accuracy, loss, confusion matrix, F1 Score, recall, precession, the receiver operating characteristic curve (ROC), True Positive Rate (Sensitivity), Area under Curve (AUC), and Matthews Correlation Coefficient. The summarization of the applied performance metrics is shown in Table 4.
Methods and Model Evaluation
For multi-class and binary medical image classification methods applied, we propose simple CNN architecture models called 2D-M2IC, 3D-M2IC, 2D-BMIC, 3D-BMIC, and fine-tuned VGG19 model. According to the accuracy metric, these models will be evaluated by comparing their performance to other state-of-the-art models, as shown in Table 5.
Table 5 shows that for multi-class medical image classification of AD stages (AD, EMCI, LMCI, NC), the proposed fine-tuned vgg19 achieved the highest accuracy of 97%. The proposed 3D-M2IC achieved the second-highest accuracy of 95.17%. The proposed 2D-M2IC achieved the third-highest accuracy of 93.6%. Harshit et al. [38] get the fourth-highest accuracy value of 93%, and Juan Ruiz et al. [41] get the lowest accuracy of 66.7%. Therefore, from the empirical results, it is proved that the proposed architectures are suitable simple structures that reduce computational complexity, memory requirements, overfitting, and provide manageable time. They also achieve very promising accuracy for binary and multi-class classification.
Figure 9 shows the comparison of the proposed models (2D-M2IC, 3D-M2IC, and fine-tuned VGG19 model) with other state-of-the-art models for multi-class medical image classification.

The comparison of the proposed models with other models for multi-class medical image classification
The comparison among the proposed models (2D-M2IC, 3D-M2IC, 2D-BMIC, 3D-BMIC, and fine-tuned VGG19 model) with one another for multi-class and binary medical image classifications for four stages of Alzheimer’s disease is shown in Fig. 10. It shows three multi-class medical image classifications and 12 binary medical image classifications for the AD spectrum.

The comparison among the proposed models (2D-M2IC, 3D-M2IC, 2D-BMIC, 3D-BMIC, and fine-tuned VGG19 model) with one another
The performance metrics, such as precision, recall, and F1 Score of the models (2D-M2IC model, 3D-M2IC model) on the test set after 25 epochs of learning, are shown in Table 6.
When evaluating the models (2D-M2IC model, 3D-M2IC model) by training and validation accuracy and the training and validation loss, it is noticed that the accuracy increases and the loss is decreased for the models, as shown in Figs. 11 and 12, respectively.

Training and validation accuracy and loss for 2D-M2IC

Training and validation accuracy and loss for 3D-M2IC
The confusion matrix shows the number of patients diagnosed as NC and classified as AD and vice versa, the number of patients diagnosed as NC and classified as LMCI and vice versa, the number of patients diagnosed as LMCI and classified as EMCI and vice versa, and so on. The confusion matrix and normalized confusion matrix for the models (2D-M2IC model, 3D-M2IC model) are shown in Table 7.
The ROC-AUC for the models (2D-M2IC model, 3D-M2IC model) where class 0 refers to AD, class 1 refers to EMCI, class 2 refers to LMCI, and class 3 refers to NC, shown in Figs. 13 and 14, respectively. Besides, when applying the MCC metric for evaluating the proposed models, MCC = 92.51134% for 2D-M2IC and 94.3247% for 3D-M2IC for medical image multi-class classifications.

The ROC-AUC of the proposed 2D-M2IC

The ROC-AUC of the proposed 3D-M2IC
Alzheimer Checking Web Service
Because of the COVID-19 pandemic, it is difficult for people to go to hospitals periodically to avoid gatherings and infections. Thus, a web service based on the proposed CNN architectures is established. It aims to support patients and doctors in diagnosing and checking Alzheimer’s disease remotely. It also determines in which Alzheimer’s stage the patient suffers from based on the AD spectrum. The application is created using the python programing language. Python is used to program the back-end of the website. Besides, HTML, CSS, JavaScript, and Bootstrap languages are used for the design of the website. The website is divided into sections. The first contains information about Alzheimer’s disease. It also includes the causes that lead to it. The second contains the stages of Alzheimer’s and the features in each AD stage. The third is a dynamic application that works as a virtual doctor. The patients or doctors can upload the MRI images for the brain. The application then checks if that MRI has the disease or not and to which stage the MRI images belong. After that, the application advises the patient according to the AD stage diagnosed, as appeared in Fig. 15. Figure 15 shows how the Alzheimer Checking Web Service is tested using random MRI images from the ADNI dataset for different stages of Alzheimer’s disease. After the patient uploads the MRI image, the program classifies the MRI as belonging to one of the phases of Alzheimer’s disease (AD, EMCI, LMCI, and NC). Moreover, the application guides the patient with advice relied on the classified stage.

The AD stage prediction for MRI medical images
Conclusion
In this paper, the E2AD2C framework for medical image classification and Alzheimer’s disease detection is proposed. The proposed framework is based on deep-learning CNN architectures. Four AD stages are multi-classified. Besides, separate binary classifications are implemented between each two-pair class. This medical image classification is applied using two methods. The first method uses simple CNN architectures that deal with 2D and 3D structural brain scans from the ADNI dataset based on 2D and 3D convolution. The second method applies the transfer learning principle to take advantage of the pre-trained models. So, the VGG19 model is fine-tuned and used for multi-class medical image classifications. Moreover, Alzheimer’s checking web application is proposed using the final qualified proposed architectures. It helps doctors and patients to check AD remotely, determines the Alzheimer’s stage of the patient based on the AD spectrum, and advises the patient according to its AD stage.
Nine performance metrics are used in the evaluation and comparison between the two methods. The experimental results prove that the proposed architectures are suitable simple structures that reduce computational complexity, memory requirements, overfitting, and provide manageable time. They also achieve very promising accuracy, 93.61% and 95.17% for 2D and 3D multi-class AD stage classifications. The VGG19 pre-trained model is fine-tuned and achieved an accuracy of 97% for multi-class AD stage classifications. In the future, it is planned to apply other pre-trained models such as EfficientNet B0 to B7 for multi-class AD stage classifications and check the performance. Furthermore, the dataset is augmented by simple data augmentation techniques. It is intended to use the DCGAN technique. In addition to that, it is planned to apply MRI segmentation to emphasize Alzheimer’s features before AD stage classifications.
References
Singh SP, Wang L, Gupta S, Goli H, Padmanabhan P, Gulyás B. 3D Deep learning on medical images: a review, 2020;1–13.
Jo T, Nho K, Saykin AJ. Deep learning in Alzheimer’s disease: diagnostic classification and prognostic prediction using neuroimaging data, Frontiers in Aging Neuroscience. 2019;11.
Wen J, et al. Convolutional neural networks for classification of Alzheimer’s disease: overview and reproducible evaluation, Medical Image Analysis. 2020;63:101694.
Altinkaya E, Polat K, Barakli B. Detection of Alzheimer ’ s disease and dementia states based on deep learning from MRI images: a comprehensive review. 2020;39–53.
Physicians PC. 2020 Alzheimer’s disease facts and figures. Alzheimer’s Dement. 2020;16(3):391–460.
Yang Y, Li X, Wang P, Xia Y, Ye Q. Multi-Source transfer learning via ensemble approach for initial diagnosis of Alzheimer’s disease, IEEE J Transl Eng Heal Med. 2020;1–10.
Adelina C. The costs of dementia: advocacy, media, and stigma. Alzheimer’s Dis Int World Alzheimer Rep. 2019;2019:100–1.
Pulido MLB, Hernández JBA, Ballester MAF, González CMT, Mekyska J, Smékal Z. Alzheimer’s disease and automatic speech analysis: a review, Expert Syst Appl.2020;150.
Irankhah E. Evaluation of early detection methods for Alzheimer’s disease. 2020;4(1):17–22.
He Y, et al. Regional coherence changes in the early stages of Alzheimer’s disease: a combined structural and resting-state functional MRI study. Neuroimage. 2007;35(2):488–500.
Vemuri P, Jones DT, Jack CR. Resting-state functional MRI in Alzheimer’s disease. Alzheimer’s Res Ther. 2012;4(1):1–9.
Bron EE, et al. Standardized evaluation of algorithms for computer-aided diagnosis of dementia based on structural MRI: the CADDementia challenge. Neuroimage. 2015;111:562–79.
Klöppel S, et al. Accuracy of dementia diagnosis — a direct comparison between radiologists and a computerized method. Brain. 2008;131(11):2969–74.
Segato A, Marzullo A, Calimeri F, De Momi E. Artificial intelligence for brain diseases: a systematic review, APL Bioeng. 2020;4;4.
Yamanakkanavar N, Choi JY, Lee B. MRI segmentation and classification of the human brain using deep learning for diagnosis of Alzheimer’s disease: a survey. Sensors (Switzerland). 2020;20(11):1–31.
Noor MBT, Zenia NZ, Kaiser MS, Al Mamun S, Mahmud M. Application of deep learning in detecting neurological disorders from magnetic resonance images: a survey on the detection of Alzheimer’s disease, Parkinson’s disease, and schizophrenia, Brain Informatics, 2020;7(1):11.
Li F, Tran L, Thung K-H, Ji S, Shen D, Li J. A robust deep model for improved classification of AD/MCI patients. IEEE J Biomed Heal informatics. 2015;19(5):1610–6.
Voulodimos A, Doulamis N, Doulamis A, Protopapadakis E. Deep learning for computer vision: a brief review. Comput Intell Neurosci. 2018;2018:1–13.
Payan A, Montana G. Predicting Alzheimer’s disease: a neuroimaging study with 3D convolutional neural networks. 2015;1–9.
Jarrett K, Kavukcuoglu K, Ranzato MA, LeCun Y. What is the best multi-stage architecture for object recognition?, Proc IEEE Int Conf Comput Vis pp. 2146–2153, 2009.
Sarraf S, Tofighi G. Classification of Alzheimer’s disease structural MRI data by deep learning convolutional neural networks. 2016;8–12.
Hosseini-asl E, Keynton R, El-baz A. Alzheimer’s disease diagnostics by adaptation of 3d convolutional network Electrical and Computer Engineering Department, University of Louisville, Louisville, KY, USA, Proc. - Int Conf Image Process ICIP. 2016;(502).
Korolev S, Safiullin A, Belyaev M, Dodonova Y. Residual and plain convolutional neural networks for 3d brain MRI classification Sergey Korolev Amir Safiullin Mikhail Belyaev Skolkovo Institute of Science and Technology Institute for Information Transmission Problems, 2017 IEEE 14th Int. Symp. Biomed. Imaging (ISBI 2017). 2017;835–838.
Wang SH, Phillips P, Sui Y, Liu B, Yang M, Cheng H. Classification of Alzheimer’s disease based on an eight-Layer convolutional neural network with leaky rectified linear unit and max pooling. J Med Syst. 2018;42(5):85.
Khvostikov A, Aderghal K, Krylov A. 3D Inception-based CNN with sMRI and MD-DTI data fusion for Alzheimer’s disease diagnostics. no. July 2018.
Sahumbaiev I, Popov A, Ram J, Górriz JM, Ortiz A. 3D - CNN HadNet classification of MRI for Alzheimer’s disease diagnosis. 2018;3–6.
Spasov SE, et al. A Multi-modal convolutional neural network framework for the prediction of Alzheimer’s disease. 2018;1271–1274.
Kahramanli H. A modified cuckoo optimization algorithm for engineering optimization. Int J Futur Comput Commun. 2012;1(2):199.
Simonyan K, Zisserman A. Very deep convolutional networks for large-scale image recognition, 3rd Int Conf Learn Represent ICLR 2015 - Conf. Track Proc. 2015;1–14.
Wang Y, et al. A novel multimodal MRI analysis for Alzheimer’s disease based on convolutional neural network. 2018 40th Annu Int Conf IEEE Eng Med Biol Soc 2018;754–757.
Khagi B, Lee B. CNN models performance analysis on MRI images of OASIS dataset for the distinction between healthy and Alzheimer’s patient. 2019 Int Conf Electron Information Commun. 2019;1–4.
Jain R, Jain N, Aggarwal A, Hemanth DJ. ScienceDirect Convolutional neural network-based Alzheimer’s disease classification from magnetic resonance brain images. Cogn Syst Res. 2019;57:147–59.
Ge C, Qu Q. Multiscale deep convolutional networks for characterization and detection of Alzheimer’s disease using MR images Dept. of Electrical Engineering, Chalmers University of Technology, Sweden Inst. of Neuroscience and Physiology, Sahlgrenska Academy. 2019 IEEE Int Conf Image Process. 2019;789–793.
Song T, et al. Graph convolutional neural networks for Alzheimer’s disease. 2019 IEEE 16th Int Symp Biomed Imaging (ISBI 2019), no. Isbi. 2019;414–417.
Liu L, Zhao S, Chen H, Wang A. A new machine learning method for identifying Alzheimer’s disease. Simul Model Pract Theory. 2020;99:102023.
Liu M, et al. A multi-model deep convolutional neural network for automatic hippocampus segmentation and classification in Alzheimer’s disease. Neuroimage. 2018;208(August):2020.
Impedovo D, Pirlo G, Vessio G, Angelillo MT. A handwriting-based protocol for assessing neurodegenerative dementia. Cognit Comput. 2019;11(4):576–86.
Parmar H, Nutter B, Long R, Antani S, Mitra S. Spatiotemporal feature extraction and classification of Alzheimer’s disease using deep learning 3D-CNN for fMRI data. J Med Imaging. 2020;7(05):1–14.
Basaia S, et al. Automated classification of Alzheimer’s disease and mild cognitive impairment using a single MRI and deep neural networks. Neuro Image Clin. 2019;21(2018):101645.
Pan D, Zeng A, Jia L, Huang Y, Frizzell T, Song X. Early detection of Alzheimer’s disease using magnetic resonance imaging: a novel approach combining convolutional neural networks and ensemble learning. Front Neurosci. 2020;14(May):1–19.
Vassanelli S, Kaiser MS, Eds NZ, Goebel R. 3D DenseNet ensemble in the 4-way classification of Alzheimer’s disease. Series Editors. 2020.
Mahmud M, Kaiser MS, McGinnity TM, Hussain A. Deep learning in mining biological data. Cognit Comput. 2021;13(1):1–33.
Author information
Authors and Affiliations
Corresponding author
Ethics declarations
Ethics Approval
This article does not contain any studies with human participants or animals performed by any of the authors. The authors certify that they have no affiliations with or involvement in any organization or entity with any financial interest or non-financial interest in the subject matter or materials discussed in this manuscript.
Additional information
Publisher's Note
Springer Nature remains neutral with regard to jurisdictional claims in published maps and institutional affiliations.
Rights and permissions
About this article

Cite this article
Helaly, H.A., Badawy, M. & Haikal, A.Y. Deep Learning Approach for Early Detection of Alzheimer’s Disease. Cogn Comput 14, 1711–1727 (2022). https://doi.org/10.1007/s12559-021-09946-2
Received:
Accepted:
Published:
Issue Date:
DOI: https://doi.org/10.1007/s12559-021-09946-2