
Abstract
In view of the great impact of urban flooding disasters on residents, traffic and urban infrastructure in recent years, we aim at finding high-risk events and loopholes in emergency plans at low cost, and simulate the emergency rescue process. According to the principles of wargame and the disaster theory, combining GIS technology and decision tree, we have established dynamic models for game pieces, rainstorm rules, visual maps and models of wargame, and demonstrated the process of urban flooding emergency rescue. Results showed that, under a 5-year rainstorm scenario and 18 deduction rounds, among the two emergency rescue action plans, our action 1 could complete the emergency rescue, but with a very high probability of loss, while action 2 could complete the emergency flooding rescue, with a small probability of loss. The application of wargame method in rescuing during urban flooding can precisely rollout the practicability of emergency plans. The results of such studies are of great significance to the training of emergency department in commanding ability, emergency management ability and decision-making ability in emergency response.
Introduction
Through a deeper understanding of historical data, wargame researchers attempt to infer the future. Wargame is also a “game”, is in essence an interdisciplinary field between the historical data and science (Ye et al. 2011; Shi and Liu 2012). With the accelerated process of urbanization, natural disasters occur frequently, and disaster emergency response has become a major issue affecting urban security. Due to the belief that “disaster relief is a combat”, the wargame deduction system has been gradually applied to the disaster emergency rescue research, as an important tool for preparation, imagination and stipulation of emergency rescue, before a disaster (Liu et al. 2012; Darken et al. 2005). The United States Federal Emergency Management Agency (FEMA) has introduced the wargame method in management of economic affairs of important development projects that require crisis management (Li and Yao 2012). The Taiwan Society for Environment and Disaster Policy, with reference to the experience of FEMA of the United States, constructed a wargame system suitable for Taiwan’s environment and disaster, and simulated action and resource allocation process for disaster response departments to deal with disasters. In urban disaster emergency rescue research, existing studies have established the time as the standard evaluation system and simulation rules, and simulated urban disaster emergency management (Li and Ji 2009). Using statistics, game theory, probability theory and other scientific methods, researchers have realized disaster numerical simulation and personnel behavior numerical simulation, imitated the occurrence and development of disasters, and various actions people may take in a disastrous environment (Cheng et al. 2014; Li 2012). With the rapid development of computers, based on programming technologies, geographic information system, the emergency exercise platform (Ma et al. 2013) has been synthetically constructed, in which wargame rules, mapping and exercises have been tested. With low-cost, wargame simulation has been used in assessment and discovery of loopholes in emergency plans, provided references for improvement and decision-making in urban disaster management (Chen et al. 2011; Perla 2012; Xu 2012). In China, research in urban flooding disaster is in the initial stage. Wargame simulation has been applied to urban flooding and emergency management evaluation model. Researchers have evaluated the results of urban flooding emergency management process, and provided solutions for the deficiency in current urban emergency management and urban flooding (Chen et al. 2016).
In summary, the application of wargame simulation in urban flood disaster research, previous research on one hand attempted to establish the simulation rules and simulation system qualitatively. On the other hand, these studies evaluated the emergency management and simulation results, but did not provide quantitative models and methods for urban flooding scenarios. Therefore, in order to overcome this problem, this paper describes the construction of numerical models, the rainstorm rule calculation method and the visual maps of the emergency rescue for urban flooding. The basic principle is to use the board as the city disaster space, the round as the evolution time of the flooding, game pieces as the flooding status, the disposal of power and uncertainty and complexity. Based on the preset scenario, the game rolls out the movement, the confrontation between men and flood. Through ruling, a continuous, dynamic urban waterlogging disaster situation is formed, reflecting the urban flooding disaster process. The goal of simulation is to train emergency department command capability, management capacity and decision-making ability.
Summary of Researched Area
Ha-Erbin is the capital city of HeiLongjiang province in China, it is located at 125°42′–130°10′ east longitude and 44°04′–46°40′ north latitude (Fig. 1). The city is the center of politics, economy, culture and transportation in Northeastern China, it has the largest metropolitan area in the region and is also the second largest provincial capital city in terms of expanse and population and one of the top 10 largest cities in China. The city has an area over 53.1 thousand square km, consisting of eight districts and 10 counties (suburbs). The total population is 10.635 million people, and downtown residents are over 5.879 million people. The average annual rainfall precipitation is 569.1 mm, summer is hot and humid with frequent rains. Major precipitation occurs in June–August, which receive over 60–70% of total annual rainfall. Because of the rainfall seasonality, rainstorms occur periodically during the summer.

Diagram of the study area
Research Area and Data Source
Data Sources
In this study, the meteorological data were from the Heilongjiang Provincial Meteorological Bureau (1961–2009). Spatial data include high-resolution fast bird images (resolution 0.61 m), and Daoli District drainage network data. The basic information of the underlying surface of the city was extracted from the fast bird image data, including road information, residential information, ground roughness, area and other parameters. The data were analyzed and extracted using the spatial analysis tools in ArcGIS software. The rainfall data were used to calculate the amount of rainfall within the rounds of different periods of the study area. The data of the underlying surface provide the basis for the map.
Wargame Simulation
The three elements of the wargame include game pieces, game boards (maps) and rules. Through setting the battle scene of the two sides, a real or virtual scenario was rolled out in rounds, predicting the process of a flooding disaster and the combat to rescue (Jian et al. 2014). Therefore, the premise of military simulation is to clarify the settings of these three elements.
Game Piece Setting
The game pieces are the combat units or battlefield marks in the game, are similar to other board games and have their own “move” and “conquer” rules. However, war game pieces are divided into unit operator and identity operator. A combat unit is called unit operator, marked with battle value, range, movement, attack, defense and other information, while pieces representing an event on the battlefield are called identity operator. An identity operator is mainly used to record the damage of the pieces, casualties and emergencies and other battlefield situations.
Battle Map
The Patch Grid Plugin was used in this research. The plug-in is introduced into ArcGIS10.2 software, allowing to directly draw the hexagonal grid map. Using the ArcGIS software attribute association, the underlying information will be linked to the map of the game, finally generates the vector map (See Fig. 2).

Map of war game simulation
Rules for Simulation
Flooding Model and Drainage Rules
-
a.
Mapping the wargame
Patch Grid Plugin is used and introduced to the Arcgis10.2 in this system, which could be helpful to map the regular hexagon. Before the final wargame map, underlying surface information need to be related to wargame map by the attribute relationship in the Arcgis10.2.
-
b.
The decision process of road waterlogging
First, we need to determine the precipitation intensity, and build the precipitation intensity decision table base on the rounds of precipitation. Hypothetic deduction time about rainstorm intensity is 5 years, and there are 18 rounds from beginning to the end. The precipitation intensity P could be get from the 18 rounds in the decision table.
Secondly, we need to calculate the loss, e.g., initial losses (interception and depression storage), infiltration losses, the rounds of runoff, displacement in drainage network, as the losses. When the loss is zero, it indicate the road waterlogging is discharged.
The calculation of initial losses. According to the Horton formula and Horton intercept formula, the initial losses are calculated as the formula:
The calculation of infiltration losses. Due to the runoff coefficient of beton and pitch is 0.9, the infiltration losses is calculated by the formula as following:
The calculation of rounds of runoff. According to the rounds of runoff, we could calculate the precipitation intensity PD in the round. P1, represents the precipitation intensity from the first round to the current round. P2, represents the precipitation intensity from the first round to the prior of current round. The comparative analysis is conducted between P1, P2 and initial losses J. When P1 < J, it shows the all the precipitation have initial losses and no runoff appears; P2 < J<P1, there is no runoff in current round, and runoff appear in the middle round with the precipitation intensity PD = (P − J) * 0.9; P2 > J, P1 > J, the precipitation intensity in current round is calculated as following:
The calculation of displacement in drainage network. According to the rainfall characteristics and actual network programme in Ha’er bin City, this research define precipitation return period of underground network is 1, which means T = 1. Hence, the specific flow of drainage network is calculated as following:
where \( {\text{q}}_{ \hbox{max} } \) is the flow; i is the precipitation intensity when the return period is 1; F is area of hexagonal grid S; \( \emptyset \) is the runoff coefficient.
Thirdly, we need to calculate the flows and depth of detention seeper and refer to many formulas as following:
Uniform flow velocity formulas in Open-channel flow:
where R is the hydraulic radius; n is the roughness coefficient; i is the hydraulic slope.
The formula of hydraulic radius R:
where W and H are the width and depth of flows, respectively.
The formula of hydraulic slope i:
where \( \left| {{\text{h}}_{1} - {\text{h}}_{2} } \right| \) and d are absolute elevation value and distance between the adjacent hexagonal grids, respectively.
The formula of flow in each round:
where V is the flow; v is the flow speed, t is the time in each round with the unit is min.
The formula of depth of detention seeper
where h is the depth of detention seeper in hexagonal grid; V is the water accumulation in hexagonal grid, and V = PD − J − R − qmax. S is the area of hexagonal grid.
Rules of Moving Pieces
Referring to Talonsoft’s “The Art of War 3” manual and the actual situation of the study area, a hexagonal grid was set to represent a 150-m distance. According to the calculation, a move of a grid on the map represents a move of 150 m in reality. Based on the vehicle speed and the destination distance, you can calculate how far a vehicle can go each round, thus obtaining the rules for a variety of vehicle. (see Table 1)
Removal of Water
Extraction of water is the most effective way to solve the road waterlogging. Whether standing water could be the timely and effectively removed is a very important standard of a measure for rescuing city flooding. Drainage system includes pumping stations and temporary pump stations (the study area pumping station can displace 5.5 m3/s of water). Water can be removed by the deployment of mobile pumps, rescue pumps, generators and other flood control equipment. With the above-mentioned ruling, the drainage capacity, as well as the time of water discharge and round can be calculated. The waterlogging disaster in August 10, 2011 in Harbin City was used as a case to set the number of “battle” rounds. The waterlogging disaster was successfully removed in about 3 h. Therefore, the initial parameters of the flood disaster model for 5-year rainstorm was set, with 10 min as one round. A total number of rounds was 18, that is, after 18 rounds, the road flooding water was completely removed.
Decision Tree Method
Decision tree expresses the nature of decision problems through graphical methods, modeling the decision sequence, simulating random events and results, and arranging them in a certain order. A decision tree uses boxes to represent the decision nodes. A random event is represented by a circle, and the decision points and the random events are connected by lines. A decision point leads to a line that indicates the action, and a random event leads to a line that indicates the possible outcome of the point. Numbers marked on each line indicates the probability of occurrence for each event. Each node has a result value determined by a decision set and random events along the path. For the convenience of analysis, the numbers marked for results are known as the income value. In this study, decision-making trees were used to decompose the confrontation process between humans and the natural disaster, and to orderly distribute the process in the decision tree. The specific decision tree parameters were set as follows.
Action Strategy Development
The strategy of military action is a variety of possible strategies adopted by both sides of fighting, usually in order to achieve a particular tactical intention. In this study, the action strategy is different from the military action strategy. Since the enemy in the study is a waterlogging disaster. Change is only considered for the road flooding sites, no movement is considered. The enemy attacks by flooding roads, houses and personnel. In the battles, different action strategies will produce different results. Therefore, how to choose the optimal action strategy will become the primary concern. In view of this, limits was set for actions in each round as the following:
-
(1)
Emergency units can move but do not start to remove water;
-
(2)
Emergency units can move and start removal of water;
-
(3)
Emergency units move after removing water;
-
(4)
Emergency units remove water but do not move;
-
(5)
Waterlogged area expands but does not move;
-
(6)
Waterlogged area shrinks;
-
(7)
Waterlogging is completely removed.
Combat Unit Status Settings
The state of combat units is the embodiment of the combat action of emergency units at a certain moment, and the state may change over time on both sides. The status of the participating units was set to: intact, damaged, cleared. Combat units of both sides can change from one state to another with a certain probability in the actual action, which is marked 1, 2, 3 representing three states. The state transition process was shown in Fig. 3.

State transition
In order to understand the next moment of the state of a game piece, one needs to understand the order and the probability of transition between the pieces in the process of simulation. As can be seen from the state transition diagram, the state can change from 1 to 2 or 3, and from 2 to 3, and state 3 is termination. Each transition takes place at some probability. The probabilities for transition from state 1 to 1, 2 or 3 were P11, P12, and P13 respectively, and the P11 + P12 + P13 = 1. The state of physical conversion means that, after a good move, the probability of a unit being still intact is P11, the probability of damage is P12, and the probability of removal is P13. One of the three states will occur. For state 2, it is expressed as the accumulation of damage to a unit, and the state may remain unchanged or cleared when it occurs again.
Income Quantification
According to the definition of income value in the decision tree, it is necessary to assign an income value for each node, and sort the results according to the preference priority. The scale of the income can be easy to determine if the case is simple. In a complex case, it is necessary to have a comprehensive consideration. According to the degree of importance, in the current study, the results were partitioned in multi-level, as follows:
-
(1)
The degree of damage to the emergency unit. An emergency unit may be damage during an emergency response. In order to quantify the degree of damage to the emergency unit, we set the initial value of the damage value to 0 (worst) − 10 (very good).
-
(2)
Battle area. As the waterlogging disaster cannot move, the area is where the waterlogging disaster occurred.
-
(3)
The clearance of water. The degree of water removal for a waterlogging site can be set in similarly as the quantification of damage degree of an emergency unit. You can also set the initial clearance value between 0 (worst), and 10 (very good).
Determination of Probability Values
The probability values in the decision tree model are divided into the probability of combat operation and the probability of combat results. The two probability values were set in the study as follows:
-
(1)
The probability of combat operations. There are a number of options for action on both sides, but uncertainties of random factors can lead to different operational probabilities. Such random factors include the force deployment, combat effectiveness, and possible combat operations. There are two kinds of combat action probability: our action probability, and the enemy action probability. Since the enemy is a waterlogging disaster in this study, the enemy’s operational action probability is easier to calculate. The action of flooding is the change in road water level. In this study, the probability of road water accumulation is calculated using the probability of rainfall in each period. Our action probability was calculated according to the analysis our actions and the possible results. We can assess the probability of our combat operations, that is, for different periods of road water changes, what kind of emergency measures might take.
-
(2)
The probability of combat results. The probability of combat results refers to the results of the combat, in the form of probability. The calculation is based on rules. The damage probability is obtained according to the ruling of the battle of the two sides (see Fig. 4).
Fig. 4 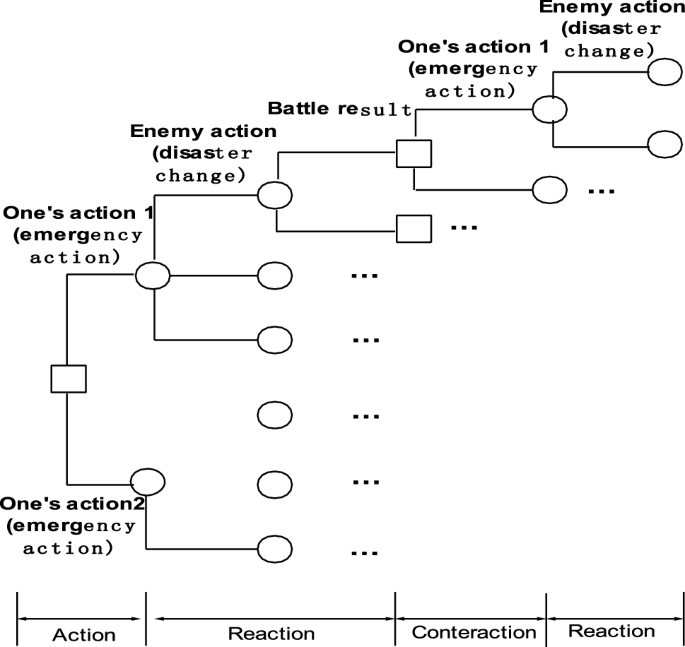
Schematic diagram of combat operation

Analysis of the Emergency Rescue Process
Scenario Description
Background
In recent years, Harbin has experienced fast urbanization. Whether it is the new city or the old city, there is an issue of insufficient drainage pipes, or small pipe diameters. The City of Harbin has a total of 993 km drainage pipes. Drainage network coverage is only 66%, and 34% of the area have no drainage facilities. There were 27 km of drainage lines seriously aged, being about 70 years old. According to the state regulations, the drainage capacity of urban drainage pipe network is 185 m3/s, which is able to deal with moderate rain, i.e. 25 mm/h of rainfall. However, the capacity of Harbin drainage network is 117 m3/s, which is 68 m3 lower than the required for moderate rain. Once it rains moderately, there will have 68 m3/s of water staying on road due to insufficient drainage. If rainfall lasts 0.5 h or more, some streets in Harbin will be waterlogged. In the old area of Harbin City, the population is increasing, the catchment area has gradually increased, but the drainage line increased only slowly, which led to delayed water discharge in some sections of the street. With the increase in household waste, which is constantly discharged into the pipeline resulting in pipeline congestion, large area road waterlogging can occur, threatening the safety of residents. Due to the relatively large uneven terrain in the urban area of Harbin, combined with rainfall mainly concentrated in the summer months, and often thunderstorms, hail and other strong convective weather, the urban area is likely to form a flood. The urban areas of Harbin encounters 2–3 times of waterlogging every year from June to September. Waterlogging is often seen in 21 large areas, of which four areas have extremely serious waterlogging, and 9 areas have serious flooding. The deepest water in the road can reach about 1.5 m.
Contrast of the Two Sides
The Enemy Side Nine road flooding sites were set in Daoli district of Harbin. Flooding sites change with time. The change interval was set to 10 min.
Our Action 1 One emergency command center; 24 emergency vehicles, including 6 transport vehicles (speed 60 km/h), 9 emergency drainage vehicles (drainage capacity: 20 t/min), 6 medical vehicles (speed 60 km/h), 3 emergency communications vehicles (speed 60 km/h).
Our Action 2 1 emergency command center; 36 emergency vehicles, including 9 equipment transport vehicles, 18 emergency drainage vehicles, 6 medical vehicles, 3 emergency communications vehicles.
Tasks for Each Side
Enemy Side As the enemy is a flooding disaster, the enemy task is limited to road water accumulation → water area expansion → water area reduction → water clearance. The change of road water is simulated by the numerical model of road water accumulation.
Our Side Our combat mission, based monitoring the results, is to dispatch appropriate drainage vehicles, equipment, emergency communications vehicles, and emergency command vehicles. Emergency vehicles travel along the road, rush to the road water area to remove road water.
Operations of Both Sides
A wargame simulation is a complex process. Each step is tactic and strategic. Each movement of a unit operator and the tactics of the two sides must be decided from the battle perspective. Accordingly, combat operations of the two sides were set as follows.
Enemy Actions
Because the enemy action is the process of waterlogging in the road, therefore, in this study, the rainfall in each time period was calculated first, and then the rainfall is taken as the initial parameter in the corresponding time period and brought into the urban rainstorm waterlogging model, and was used for calculate the change of road water under different rainfall probability.
Validation of Road Water Model
The rules were set with the above formula (1–9) as the standard, the rainstorm intensity in Table 1 as the parameter, and selected the rainstorm intensity when p = 5a into P as the initial parameter, the road waterlogging evolution was calculated (Li et al. 2002; Yin et al. 2010; Jing et al. 2010; Chen et al. 2014) by the above model. From calculation results, we can see road water status and its changes over time in the study area. Based on these calculations, we can see the enemy changes in the 18 rounds.
In order to verify the accuracy of the model of road waterlogging in the study area, the rainstorm data in August 2011 was used for verification. The initial conditions of the model are as follows: the underlying surface of the Daoli area (the verification area) was asphalt road, and the water level was 115.6 m for the first grade river (Songhua River). All underground channels within and outside the study area were saturated; all drainage stations, gates were open. Five areas within Daoli District in Harbin City were selected for the verification of the model (see Table 2). It is proved that the model has high accuracy and can be used to simulate the process of waterlogging in the study area.
Our Actions
Our response action is the emergency rescue, that is, the removal of road water. This process requires the relevant departments to cooperate. Specific action instructions are issued by the Emergency Command Center. In the light of the field survey, we have two initial action plans, but not limited to the two action plans. According to the actual situation or contingency plans, relevant action plans can be developed in advance (Chen et al. 2016).
Action 1 Due to the proximity of waterlogging sites 1 and 2, sites 3 and 4, sites 7 and 8, three emergency equipment transport vehicles were separately dispatched to sites 1 and 2, sites 3 and 4, sites 7 and 8, and three equipment transport vehicles were sent to sites 5, 6, 9 respectively, and nine emergency drainage vehicles were dispatched respectively to the nine waterlogging sites. Three medical vehicles were dispatched to the three cluster of water sites, and to waterlogged sites 5, 6, 9 three medical vehicles were separately dispatched. An emergency telecommunication vehicle was sent to the vicinity of sites 1, 2, 3 and 4, and an emergency communication vehicle was sent to the vicinity of sites 5, 6, 7, and an emergency communication vehicle was sent to sites 8, 9.
Action 2 Unlike Action 1, Action 2 dispatched two emergency drainage vehicles were sent to each waterlogging point, a total of 18 vehicles. To each of the 9 waterlogging sites, an equipment transport vehicle was sent. To the clustered sites (1 and 2, 3 and 4, 7 and 8), respectively, three medical vehicles were sent; and to 5, 6, 9 water sites, three medical vehicles were sent. An emergency telecommunication vehicle was sent to the vicinity of waterlogging sites 1–4, and an emergency communication vehicle was sent to the vicinity of sites 5, 6, and 7; to an emergency communication vehicle was dent to sites 8 and 9.
In this study, the deduction is the game process of man and waterlogging disaster, so the following game process is designed (see Fig. 5).

The process of gaming
Construction of Crawl Model of Emergency Rescue Workers in Urban Flood Disaster
Deduction Model Construction
According to the above analysis of the two sides, if our side was set as “offensive”, that is, the removal of water. When a waterlogging site is cleared of water, then emergency force turn to the near site to complete the water removal task (Chen et al. 2016). The enemy “attack” is the expansion of waterlogged area, resulting in losses. As we “attack”, the waterlogged area is reduced. When the waterlogged area is zero, the enemy is “killed”. If our “offense” cannot control the expansion of the water area, our task fails. Therefore, through the analysis of the situation, if we firmly believe that the enemy can overcome our side, and the emergency response fails, then a greater probability as assigned to choose action 1. In order to better reflect this point, the branch is assigned a probability of 0.7. On the other hand, if we find that our action 1 cannot overcome the enemy, we take action 2, that is, we can beat the enemy. Then, the enemy will have a lower probability to choose its action. At this point, the probability is 0.5. When the probability for each branch is obtained, the result (benefit value) labeled “A” and “B” are generated for each branch. Based on the above analysis, this paper constructed the decision tree model of waterlogging disaster emergency rescue process. The results are shown in Fig. 6. Among them, the success of removal means the success of the deduction. Success in water removal with loss means that although the water was removed, but losses incurred. Failure to clear waterlogging with loss means road water removal failure, and losses incurred. Failure in water removal but with no losses means that the plan cannot completely clear road water, but did no losses incurred.

Construction of decision tree
Simulation Analysis
Based on the above analysis process and the decision tree model of the waterlogging disaster emergency rescue process, we can get the probability of different game results. The complete decision tree is shown in Fig. 7. The results of the specific deduction are visualized in Fig. 8.

A complete decision tree deduction

Visualization of road waterlogging and emergency rescue simulation
Through the urban waterlogging disaster emergency rescue process wargame decision tree results, you can get the following summaries:
-
(1)
Seen from the results of the simulation, the income of our action 1 (water cleared, without losses) is generally lower than that of our action 2 (water cleared, without losses), suggesting that our action plan 2 has a higher probability of successful water logging emergency.
-
(2)
Our action 1 deduction result (water cleared, losses; water removal failed, losses) had an income value generally higher than our action 2 deduction results (water cleared, loss; water removal failed, losses). action 1 could not meet the needs of this emergency rescue, and may lead to a greater probability of failure.
-
(3)
Our action 1 deduction result (water removal failed, no losses) had an income generally higher than that of our action 2 deduction (water removal failed, no losses). The outcomes of failed in water removal without losses indicate that waterlogging occurred, and the removal was unsuccessful, but not necessarily caused losses. Such a situation had relatively low incomes in both action plans, indicating that such a situation has a relatively low occurrence probability during our action 2 deduction, and a high occurrence probability in our action 1 deduction. This outcome indicates that our action 1 program cannot meet the demand of emergency rescue.
Conclusion
This article introduces the method of wargame simulation method into the rescue process of urban waterlogging disasters. Through the construction of for urban waterlogging emergency rescue wargame model based the decision trees, we simulated the confrontation between humans and the natural disaster of urban waterlogging. The simulation provides a new idea on emergency rescue research.
-
(1)
Through the simulation, we found that our action 1 could complete waterlogging disaster emergency rescue, but was associated with a high probability of losses.
-
(2)
Our action 2 could complete the emergency rescue of waterlogging disasters, with a low probability of losses, a low probability of failure. Therefore, our best option is plan 2 (our action 2) to counteract the urban waterlogging.
A wargame simulation of urban waterlogging emergency rescue is a complicated process. It is a deduction process leading by the government department and involve a large number of staff members. In this study, the scenario settings included only the number of emergency rescue vehicles and road waterlogging situation. In the process of deduction, the disposal time is the only standard, and the specific emergency rescue capability was not calculated and set. Therefore, there may be differences in the accuracy in the simulation. In the future, research work will be through consultation with more experts and government departments to obtain more information and more detailed simulation rules, construct a reasonable urban disaster relief capacity assessment model and method for the realization of high accuracy to provide data support for urban waterlogging emergency. In the study, the urban torrential rains, the numerical simulation of internal waterlogging and the map were directed at the Daoli District of Harbin. If the simulation is to be applied to other cities, it is necessary to plan and design the specific research area.
References
Chen, P., Zhang, J., Sun, Y., & Liu, X. (2016a). Emergency sheltering of urban residents in waterlogging disaster by war game exercise theory and method. Yangtze River, 47(14), 7–11.
Chen, P., Zhang, J., Sun, Y., et al. (2016b). Wargame simulation theory and evaluation method for emergency evacuation of residents from urban waterlogging disaster area. International Journal of Environmental Research and Public Health, 13(12), 2–19.
Chen, P., Zhang, J., Yan, D., Jiang, X., & Bao, Y. (2011). Numerical simulation and visualization of urban rainstorm waterlogging based on GIS-A case study of Daoli District in Haerbin City. Journal of Catastrophology, 26(3), 69–72.
Chen, P., Zhang, J., Zhang, L., et al. (2014). Evaluation of resident evacuations in urban rainstorm waterlogging disasters based on scenario simulation: Daoli District (Harbin, China) as an example. International Journal of Environmental Research and Public Health, 11(10), 9965–9978.
Cheng, M., Jiang, B., & Li, L. (2014). The design of urban emergency management system based on the wargame theory. Chinese Journal of Environmental Management, 3(6), 38–42.
Darken, R., McDowell, P., & Johnson, E. (2005). Projects in VR: The delta 3D open source game engine. IEEE, 5(6), 10–12.
Jian, X., Wanlin, X., & Li, C. (2014). Inter-provincial cooperative game model of Beijing, Tianjin and Hebei province air pollution control. Systems Engineering-Theory and Practice, 34(3), 810–816.
Jing, Y., Yin, Z., Yin, J., Wang, F., & Wen, J. (2010). GIS-based analysis on rainstorm waterlogging hazards in Pudong new area in Shanghai. Journal of Catastrophology, 25(2), 58–63.
Li, Q. (2012). Analysis and design of simulated emergency exercise system platform. Journal of Safety Science and Technology, 3(8), 120–122.
Li, J., & Ji, Z. (2009). The design and implementation of “AKY-MCP” a mobile major accidents monitoring and command platform. Journal of Safety Science and Technology, 5(6), 77–80.
Li, N., Qiu, J., Cheng, X., & Lu, J. (2002). Study on simulation system of rainstorm waterlogging in Tianjin City. Journal of Natural Disasters, 11(2), 113–118.
Li, Y., & Yao, F. (2012). Confrontational CISR simulation training system based on high level architecture. Command Information System and Technology, 3(5), 5–7.
Liu, S., Wu, Z., You, X., Zhang, X., & Wang, X. (2012). Multi-scale expression of integrated battlefield situation based on Wargaming. Journal of Geomatics Science and Technology, 29(05), 382–385.
Ma, Y., Zhang, X., Ma, Y., Lian, D., & Sun, Y. (2013). Emergency drills program dynamic deduction system. Computer Systems and Applications, 2(22), 64–67.
Perla, P. (2012). The art of wargaming. Annapolis, MD: Naval Institute Press.
Shi, C., & Liu, B. (2012). Research on the rehearsal and evaluation system based on simulation. Tactical Missile Technology, 2(3), 122–124.
Xu, W. (2012). Research of optimal allocation of assault based on genetic algorithm in wargames system. Journal of System Simulation, 24(08), 1702–1706.
Ye, L., Gong, L., & Liu, Z. (2011). Research and modeling of a rehearsal system of naval battle. Computer and Digital Engineering, 2(28), 58–61.
Yin, Z., Xu, S., Yin, J., & Wang, J. (2010). Small-scale based scenario modeling and disaster risk assessment of urban rainstorm water-logging. Acta Geographica Sinica, 65(5), 554–557.
Funding
The National Natural Science Foundation of China (41501557, 41501559, 41371495); Jilin Province Department of Youth Fund (20150520081JH).
Author information
Authors and Affiliations
Corresponding author
Rights and permissions
This article is published under an open access license. Please check the 'Copyright Information' section either on this page or in the PDF for details of this license and what re-use is permitted. If your intended use exceeds what is permitted by the license or if you are unable to locate the licence and re-use information, please contact the Rights and Permissions team.
About this article

Cite this article
Chen, P., Zhang, J. & Sun, Y. Research on Emergency Rescue of Urban Flood Disaster Based on Wargame Simulation. J Indian Soc Remote Sens 46, 1677–1687 (2018). https://doi.org/10.1007/s12524-018-0823-x
Received:
Accepted:
Published:
Issue Date:
DOI: https://doi.org/10.1007/s12524-018-0823-x