
Abstract
The Digital Elevation Models (DEMs) are used to represent the topographic surface of the earth as it is used in many applications. Nowadays, many free DEMs are available online. This study aims to assess the accuracy of six free DEMs. This research uses the GPS observations to determine the elevation stations in the study area by using the Post-Processing Kinematic (PPK) technique and compares these elevations against the elevations computed at the same stations by using six free online Digital Elevation Models (DEMs): SRTM 1 Arc-Second, ASTER 1 Arc-Second, NASADEM 1 Arc-Second, SRTM 3 Arc-Second, GTOPO30, and ALOS PALSAR 12.5 m to find the best results from the free DEMs. The elevations of all stations of different data sources were calculated using the geoid model EGM96. The results indicate that the DEMs that give the best results in this study are obtained from NASADEM 1 Arc-Second, where (RMSE is 2.99 m, and the SD is 2.97 m), and SRTM 3 Arc-Second, where the (RMSE is 3.70 m, and the SD is 3.53 m).
Introduction
A Digital Elevation Model (DEM) is a valuable data source for numerous studies and viewing the earth’s 3D surface topography (Ibrahim 2018). The era of satellite remote sensing has made the Digital Elevation Model (DEM) available through its onboard active and passive sensors. Accuracy and extent of use based on spatial resolution and temporal resolution of topographical information quality. Detailed spatial resolution varied from 10 cm, 5–15 m, 30–90 m, and 1 km (Usman et al. 2021). DEMs are a standard way for making topographic maps, orthophotos, civilian engineering projects, and other engineering applications. Several software applications have recently been developed and used to construct DEMs from a variety of sources, including field surveying, scanned topographic maps, 3D laser scanning, and stereo images viewed from the air or space. The primary goal of creating a DEM is to depict surface elevation (Hapep and Al-Bakri 2020). Three names, DSM, DTM, and DEM, are used interchangeably in scientific literature to depict elevation models. The elevations of the earth’s surface, including natural and man-made things like plants and buildings, are referred to as a Digital Surface Model (DSM). The elevation values for bare earth are referred to as a Digital Terrain Model (DTM), which excludes features such as vegetation and buildings. The term Digital Elevation Model (DEM) is widely used to refer to either a DSM or a DTM (Delgado et al. 2018). DEMs come in a variety of resolutions and are created using a variety of methods. DEMs that provide good terrain representation are extremely expensive. Several DEMs have been produced using remote sensing techniques: they are easily accessible and open source, and they have comparable accuracy to proprietary DEMs. The Shuttle Radar Topography Mission (SRTM) from 2000, the Advanced Spaceborne Thermal Emission and Reflection Radiometer (ASTER) Global Digital Elevation Model (GDEM) from 2009, and the Advanced Land Observing Satellite Phased Array Type L-band Synthetic Aperture Radar (ALOS PALSAR) from 2006 (Khal et al. 2020), NASADEM 1 Arc-Second, and GTOPO30 are all examples of open-source DEMs.
The data used in this study was acquired through two main sources: firstly, ground elevation data obtained by using the GPS Post-Processing Kinematic (PPK) technique and secondly the six free online Digital Elevation Model (DEMs) data obtained from SRTM 1 Arc-Second, ASTER 1 Arc-Second, SRTM 3 Arc-Second, NASADEM 1 Arc-Second, GTOPO30, and ALOS PALSAR DEM 12.5 m. This research aims to examine six free online DEMs on the new 6th of October City, Egypt, using the elevations of 572,200 stations obtained from the GPS by Post-Processing Kinematic (PPK) technique to determine the best DEM in the study area, where the vertical accuracy of the stations obtained from using GPS by Post-Processing Kinematic (PPK) technique was 5 cm.
Study area
The study area is a new 6th of October City which is located to the West of Cairo governorate. The study area is located in the Egypt Red Belt coordinate system on the Egyptian Transverse Mercator (ETM). The study area is approximately 326 km2 (see Fig. 1). The elevations of the study area vary between 105.50 m and 270.30 m.

The study area for the new 6th of October City, Egypt
Data sources
This research used six free online DEMs with different resolutions and compared them with the GPS elevation data. The following procedure illustrates the acquisition of data used in this study:
-
Using the GPS Leica Viva instrument to compute the elevations in the study area from the GPS observations.
-
(EarthExplorer 2022) is used to download the Digital Elevation Models SRTM 1 Arc-Second and GTOPO30 with a horizontal spacing of approximately 1 km.
-
Downloaded the available ALOS PALSAR DEM (12.5 m) for the study area from the Alaska Satellite Facility (Alaska Satellite Facility Data Search Vertex 2022). As this model does not cover the entire study area, it only covers approximately 161 km2 of the study area.
-
Download the ASTER 1 Arc-Second Global Digital Elevation Model (GDEM) Version (3) from (EARTHDATASEARCH 2022).
-
The (OpenTopography 2022) was used to download the DEMs of NASADEM 1 Arc-Second and SRTM 3 Arc-Second.
Generating the elevations from different sources
SRTM Global Digital Elevation Model
The National Aeronautics and Space Administration (NASA) and the National Geospatial-Intelligence Agency (NGA) of the USA collaborated on the Shuttle Radar Topography Mission DEM (SRTM). For latitudes less than 60°, SRTM used a radar interferometer to create a globally consistent digital elevation map. The SRTM mission requirements stipulated a precision requirement of 16 m of absolute vertical error (90% linear error). The SRTM 1 Arc-Second dataset is a 30-m improvement on the original SRTM 3 Arc-Second (SRTM 90 m) dataset (Olusina and Okolie 2018). The SRTM Global Digital Elevation Model uses the horizontal datum WGS84 and vertical datum Earth Gravitational Model 1996 (EGM96) (USGS EROS Archive, (SRTM) 1 Arc-Second Global 2022).
ASTER 1 Arc-Second Global Digital Elevation Model
The Japanese Ministry of Economy, Trade and Industry (METI) produced the ASTER sensor, which was launched onboard NASA’s Terra satellite in December 1999. The ASTERGDEM version 1 (ASTER GDEM1) was created in 2009 using these photos and a completely automated processing chain. Between 83°N and 83°S, this product covers around 99% of the terrestrial area, with a horizontal resolution of around 30 m at the equator. Even though the ASTER DEM product uses all accessible source scenes in this edition, it nevertheless contains artifacts and outliers. ASTER GDEM V2, which was launched in 2011, is an enhanced ASTER GDEM. An updated processing approach was used to build it from more ASTER stereo pairs (Liu, Zhu, Fu, Zhou, & Zuo, 2020). The latest version (ASTER GDEM v3) was published in 2019 (Dobre et al. 2021); this 30-m DEM covers the whole earth’s surface from 83°N to 83°S and was improved against two previous versions by removing minor artifacts and filling in parts of missing DEMs with new data (Abrams 2016). Each tile is provided in GeoTIFF format and is projected on the World Geodetic System 1984 (WGS84) and the vertical datum used is Earth Gravitational Model 1996 (EGM96) (LP DAAC, ASTGTM v003, 2022).
ALOS-PALSAR DEM
The Japan Aerospace and Exploration Agency launched ALOS-PALSAR in 2006. (JAXA). Until May 12, 2011, the ALOS-PALSAR was operational. (Khal et al. 2020). The Advanced Land Observing Satellite Phased Array type L-band Synthetic Aperture Radar (ALOS PALSAR) DEM data collection has a spatial resolution of 12.5 m. The ALOS PALSAR is an active microwave sensor that operates at 28 MHz and has a fine range resolution of 7–44 m. The L-band frequency is used by the sensor (Khatriker et al. 2019). The ellipsoid WGS 1984 is used to obtain DEM data (Ferreira and Cabral 2021).
NASADEM
The NASADEM information products were derived from original telemetry information from the Shuttle Radar Topography Mission (SRTM), a collaboration between the National Aeronautics and Space Administration (NASA) and the National Geospatial-Intelligence Agency (NGA), in addition to the involvement of German and Italian space agencies. In addition to Terra Advanced Spaceborne Thermal and Reflection Radiometer (ASTER) Global Digital Elevation Model (GDEM) Version 2 information, NASADEM also relied on Ice, Cloud, and Land Elevation Satellite (ICESat) Geoscience Laser Altimeter System (GLAS) ground control points of its lidar shots to enhance surface elevation measurements that led to enhance geolocation accuracy. NASADEM are distributed in 1° latitude by 1° longitude tiles and incorporates all land between 60°N and 56°S latitude. The NASADEM data collection has a spatial resolution of 1 arc second. The NASADEM global Digital Elevation Model uses the horizontal datum WGS84 and vertical datum EGM96 (Earth Gravitational Model 1996) (LP DAAC—NASADEM_HGT, 2022).
GTOPO30 DEM
GTOPO30 is a global Digital Elevation Model with a horizontal spacing of 30 arc seconds (about 1 km). GTOPO30 is a global data set covering the total extent of latitudes from 90°S to 90°N, and also the total extent of longitudes from 180°W to 180°E. GTOPO30 was completed in late 1996 and was developed over a 3-year period through a collaborative effort led by staff at the U.S. Geological Survey’s Center for Earth Resources Observation and Science (EROS) (USGS EROS Archive, (GTOPO30), 2022). The horizontal and vertical datum used to obtain GTOPO30 is WGS 1984 and EGM96, respectively (Podest and Crow 2013).
GPS elevations
This research uses GPS observations to determine the elevations of the study area by the Post-Processing Kinematic (PPK) technique. In December 2018 the GPS observations were taken from the Leica Viva instrument and processing the observations by LEICA Geo Office LGO 7 software, where the GPS observations were taken using a four-wheel-drive vehicle in which the device was installed and movement in the study area was carried out with distances ranging from 10 to 100 m. The output data resulting from processing the GPS observations by using the LGO 7 software was obtained on the Egyptian Transverse Mercator and EGM96.
Elevation data validation
In this study, statistical indices were employed to analyze, validate, and compare the DEM to GPS data. The vertical accuracy of the DEM may be assessed using this statistical analysis. An elevation error was calculated for each station as the difference in elevation between model and ground reference data (see Eq. (1)).
In the above equation, Zdiff (i) is the elevation error at the station, Zmodel (i) is the elevation of the station on DEM, and Zref (i) is the elevation of the GPS station. The value of Mean Error (ME), Root Mean Square Error (RMSE), and Standard Deviation (SD) were computed for each DEM (see Eqs. (2)–(4)).
RMSEs are measures of surface quality and provide the understanding of differences between two types of data (predicted by the model and observed data) (Khalid et al. 2016).
Methodology
-
Using the LGO 7 software to process the GPS observations for the 572,200 stations in the study area to obtain the horizontal and vertical coordinates for all stations on the Egyptian Transverse Mercator (ETM) and EGM96.
-
Uploads the DEMs ASTER (30 m), SRTM (30 m), NASADEM (30 m), SRTM (90 m), and GTOPO30 (1000 m) to ArcGIS software and extract the three-dimension coordinates (E, N, H). The horizontal coordinates (E, N) are determined on Universal Transverse Mercator (UTM) and the vertical coordinates (H) are obtained on EGM96. The ExpertGPS 5 software was used to extract the horizontal coordinates (E, N) on the ETM. The steps are illustrated in Fig. 2.
Fig. 2 
Block diagram that represents the steps used to find the elevations from ASTER (30 m), SRTM (30 m), NASADEM (30 m), SRTM (90 m), and GTOPO30 (1000 m) DEMs
-
This ALOS PALSAR DEM does not cover the entire study area but covers about 161 km2. The number of GPS stations in the study area that were compared with this DEM was 313,149 stations. The steps for determining the three-dimensional coordinates (E, N) on ETM and orthometric heights (H) on EGM96 are illustrated in Fig. 3, where the Office of Geomatics website (NGA - Office of Geomatics 2022) was used to convert the ellipsoidal heights to orthometric heights on EGM96 by calculating the geoid heights.
Fig. 3 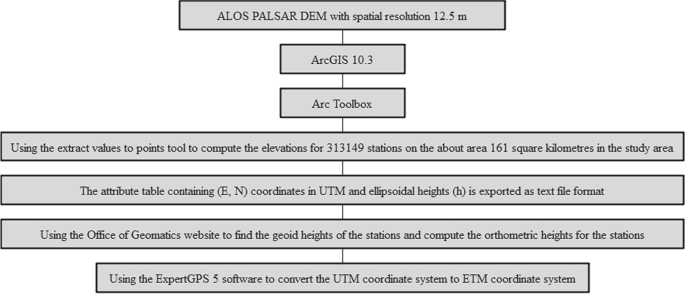
Block diagram that represents the steps used to find the elevations from ALOS PALSAR DEM
-
Calculating the difference in heights between the GPS station heights and the station heights obtained by different DEMs. The difference in heights is used for calculating the values of Mean Error (ME), Root Mean Square Error (RMSE), and Standard Deviation (SD).


Results
The comparison between the different DEMs with the GPS data in the study area is illustrated hereafter.
-
Fig. 4 shows the difference in elevations between 313,149 GPS stations and the same stations at the ALOS PALSAR DEM. The statistical analysis revealed that the maximum difference, minimum difference, ME, RMSE, and SD are 12.40 m, − 42.15 m, − 2.91 m, 3.85 m, and 5.13 m, respectively (see Table 1).
Fig. 4 
Difference in elevations between the GPS data and the ALOS PALSAR DEM
Table 1 The statistical computations between the GPS data and different DEMs -
Fig. 5 depicts the difference in elevations between 572,200 GPS stations and the same stations at the ASTER 1 Arc-Second DEM. The statistical analysis revealed that the maximum difference, minimum difference, ME, RMSE, and SD are 51.52 m, − 70.24 m, − 2.66 m, 6.74 m, and 6.65 m, respectively (see Table 1).
Fig. 5 
Difference in elevations between the GPS data and the ASTER 1 Arc-Second DEM
-
The maximum difference, minimum difference, ME, RMSE, and SD are 39.52 m, − 40.99 m, − 2.68 m, 4.07 m, and 3.92 m, respectively; this result is the statistical analysis between the GPS data and SRTM 1 Arc-Second DEM (see Table 1). The difference in elevations of 572,200 stations between GPS data and SRTM 1 Arc-Second DEM is shown in Fig. 6.
Fig. 6 
Difference in elevations between the GPS data and the SRTM 1 Arc-Second DEM
-
The difference in elevations of 572,200 stations between GPS data and NASADEM 1 Arc-Second is shown in Fig. 7. The statistical analysis values obtained by comparing the elevations of the GPS and the NASADEM in the study area are the maximum difference 40.52 m, the minimum difference − 37.99 m, ME − 0.76 m, RMSE 2.99 m, and finally, SD 2.97 m.
Fig. 7 
Difference in elevations between the GPS data and the NASADEM 1 Arc-Second
-
The statistical analysis values obtained by comparing the elevations of the GPS and the SRTM 3 Arc-Second DEM in the study area are the maximum difference 39.44 m, the minimum difference − 24.99 m, the ME − 2.70 m, RMSE 3.70 m, and finally, SD 3.53 m. The difference in elevations of 572,200 stations between GPS data and SRTM 3 Arc-Second DEM is shown in Fig. 8.
Fig. 8 
Difference in elevations between the GPS data and the SRTM 3 Arc-Second DEM
-
Fig. 9 shows the difference in elevations between 572,200 GPS stations and the same stations at the GTOPO30 (1000 m) DEM. The statistical analysis revealed that the maximum difference, minimum difference, ME, RMSE, and SD are 53.19 m, − 63.26 m, − 2.23 m, 13.17 m, and 13.14 m, respectively (see Table 1).
Fig. 9 
Difference in elevations between the GPS data and the GTOPO30 (1000 m) DEM


Also in this research, we excluded the outlier values in the four DEMs that gave the best results in order to note whether removing these stations affected the accuracy of the results of these models or did not affect, as the number of stations that were excluded in each DEM was as follows:
-
In the ALOS PALSAR DEM, 23 stations were excluded, so the number of stations in the study area became 313,126 stations. The results were that the maximum difference, minimum difference, ME, RMSE, and SD are 9.36 m, − 23.34 m, − 2.91 m, 3.84 m, and 5.12 m, respectively.
-
In SRTM 1 Arc-Second DEM, 136 stations were excluded, so the number of stations in the study area became 572,064 stations. The results were that the maximum difference, minimum difference, ME, RMSE, and SD are 19.86 m, − 24.01 m, − 2.68 m, 4.04 m, and 3.89 m, respectively.
-
The number of 112 stations that gave outliers values in the NASADEM was excluded. The results in the study area obtained from using 572,088 stations are the maximum difference, minimum difference, ME, RMSE, and SD are 19.69 m, − 19.92 m, − 0.76 m, 2.96 m, and 2.94 m, respectively (see Fig. 10).
Fig. 10 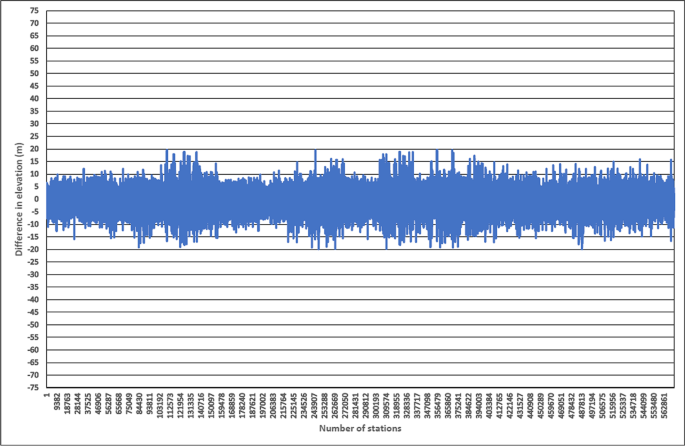
Difference in elevations between the GPS data and the NASADEM 1 Arc-Second after excluding the outlier values
-
Finally, in the statistical analysis of the SRTM 3 Arc-Second DEM after excluding 342 outlier stations from the total number of stations, which is 572,200 stations in the study area, the maximum difference, minimum difference, ME, RMSE, and SD are 12.91 m, − 15.84 m, − 2.71 m, 3.66 m, and 3.49 m, respectively (see Fig. 11).`
Fig. 11 
Difference in elevations between the GPS data and the SRTM 3 Arc-Second DEM after excluding the outlier values


Conclusions
In this research, we evaluate the elevation data extracted using six free different DEMs (SRTM 1 Arc-Second, ASTER 1 Arc-Second, NASADEM 1 Arc-Second, SRTM 3 Arc-Second, GTOPO30, and ALOS PALSAR 12.5 m) by comparing these DEM elevation data on EGM96 with the 572,200 ground stations obtained by using the DGPS on EGM96 on the new 6th of October City. From the results, we can conclude that.
-
Through the results of the evaluations of DEMs (NASADEM, SRTM, and ASTER) with a spatial resolution of 30 m, the best results we got were from NASADEM, where the results of the statistical analysis are the maximum difference, minimum difference, ME, RMSE, and SD that are 40.52 m, − 37.99 m, − 0.76 m, 2.99 m, and 2.97 m, respectively. Then came second in order of accuracy SRTM DEM. Finally, the ASTER DEM gave the worst results; this is evident by giving the highest values, whether in the difference in elevations, ME, RMSE, and SD.
-
The second-best results obtained in this study were those obtained from SRTM 3 Arc-Second DEM whose spatial resolution is 90 m. The results were as follows: the maximum and minimum differences in elevations are 39.44 m and − 24.99 m, respectively; the mean error is − 2.70 m; the root mean square error is 3.70 m; and the standard deviation error is 3.53 m.
-
Although the spatial resolution of ALOS PALSAR DEM is 12.5 m, the results we obtained from this model (using 313,149 ground stations) are less accurate than the SRTM DEM 30 m that appears from the results.
-
The statistical analysis showed that the ASTER DEM whose spatial resolution was 30 m and the GTOPO30 DEM whose spatial resolution was 1000 m have given the worst results in the study area.
In this research, the results of the statistical analysis of the four DEMs: SRTM 1 Arc-Second, NASADEM 1 Arc-Second, SRTM 3 Arc-Second, and ALOS PALSAR 12.5 m, were the best, so we excluded the outlier stations in these models in the hope of improving the results of these models. The results showed that the improvement was made at the maximum and the minimum differences, but the improvement was on ME, RMSE, and SD no more than 4 cm. This means that the exclusion of outlier stations did not affect the accuracy of the DEMs.
References
Abrams M (2016) ASTER Global DEM Version 3, and new ASTER water body dataset. ISPRS - International Archives of the Photogrammetry, Remote Sensing and Spatial Information Sciences, pp 107–110. https://doi.org/10.5194/isprsarchives-XLI-B4-107-2016
Alaska Satellite Facility Data Search Vertex (2022) Retrieved from https://search.asf.alaska.edu/#/
Delgado JA, Sassenrath GF, Mueller T (2018) Precision conservation: goespatial techniques for agricultural and natural resources conservation (Vol. 59). American Society of Agronomy Crop Science Society of America Soil Science Society of America. https://doi.org/10.2134/agronmonogr59
Dobre B, Kovács IP, Bugya T (2021) Comparison of digital elevation models through the analysis of geomorphic surface remnants in the Desatoya Mountains, Nevada. Transactions in GIS, 1–21. https://doi.org/10.1111/tgis.12819
EARTHDATASEARCH (2022) Retrieved from https://search.earthdata.nasa.gov/search
EarthExplorer. (2022). Retrieved from https://earthexplorer.usgs.gov/
Ferreira ZA, Cabral P (2021) Vertical accuracy assessment of ALOS PALSAR, GMTED2010, SRTM and Topodata Digital Elevation Models. 7th International Conference on Geographical Information Systems Theory, Applications and Management, (pp. 116–124). https://doi.org/10.5220/0010404001160124
Hapep AM, Al-Bakri M (2020) Comparison of different DEM generation methods based on open source datasets. Univ Baghdad Eng J 26:63–85. https://doi.org/10.31026/j.eng.2020.01.07
Ibrahim A (2018) Vertical accuracy assessment of open source Digital Elevation Model using GPS point and reference DEM over Ethiopia: a case study in Addis Ababa and Dire Dawa. The School of Civil and Environmental Engineering of Addis Ababa University. Masters of Science. Retrieved from http://etd.aau.edu.et/handle/123456789/17933
Khal M, Algouti A, Algouti A, Akdim N, Stankevich SA, Menenti M (2020). Evaluation of open Digital Elevation Models: estimation of topographic indices relevant to erosion risk in the Wadi M’Goun watershed, Morocco. AIMS Geosciences, 231–257. https://doi.org/10.3934/geosci.2020014
Khalid NF, Din AH, Omar KM, Khanan MA, Omar AH, Hamid AA, Pa’suya MF (2016) Open-source Digital Elevation Model (DEMs) evaluation with GPS and LiDAR data. International Conference on Geomatic and Geospatial Technology (GGT) 2016, 3–5 October 2016, Kuala Lumpur, Malaysia. https://doi.org/10.5194/isprs-archives-XLII-4-W1-299-2016
Khatriker S, Gupta K, Bhardwaj A (2019) Evaluation of open source SAR based Digital Elevation Models. URSI Asia Pacific Asia Pacific Radio Science Conference, 09–15 March 2019, India Habitat Center, New Delhi
Liu Z, Zhu J, Fu H, Zhou C, Zuo T (2020) Evaluation of the vertical accuracy of open Global DEMs over steep terrain regions using ICESat data: a case study over Hunan Province, China. Sensors, 20(17). https://doi.org/10.3390/s20174865
LP DAAC - NASADEM_HGT. (2022). Retrieved from https://lpdaac.usgs.gov/products/nasadem_hgtv001/
LP DAAC, ASTGTM v003. (2022). Retrieved from https://lpdaac.usgs.gov/products/astgtmv003/
NGA - Office of Geomatics. (2022). Retrieved from https://earth-info.nga.mil/index.php?dir=wgs84&action=egm96-geoid-calc
Olusina JO, Okolie CJ (2018) Visualisation of uncertainty in 30m resolution global Digital Elevation Models: SRTM v3.0 and ASTER v2. Nigerian Journal of Technological Development, 15(3). https://doi.org/10.4314/njtd.v15i3.2
OpenTopography. (2022). Retrieved from https://portal.opentopography.org/datasetMetadata?otCollectionID=OT.032021.4326.2
Podest E, Crow W (2013) Ancillary data report: Digital Elevation Model. Jet Propulsion Laboratory, California Institute of Technology. Retrieved from https://smap.jpl.nasa.gov/system/internal_resources/details/original/285_043_dig_elev_mod.pdf
USGS EROS Archive, (GTOPO30). (2022). Retrieved from https://www.usgs.gov/centers/eros/science/usgs-eros-archive-digital-elevation-global-30-arc-second-elevation-gtopo30
USGS EROS Archive, (SRTM) 1 Arc-Second Global. (2022). Retrieved from https://www.usgs.gov/centers/eros/science/usgs-eros-archive-digital-elevation-shuttle-radar-topography-mission-srtm-1?qt-science_center_objects=0#qt-science_center_objects
Usman F, Nanda, Nasmirayanti R, Sri Sumantyo JT (2021) Comparative analysis on digital surface model of urban area from Sentinel-1 SAR interferometry and aerial photogrammetry for disaster mitigation plan. International Conference on Disaster Mitigation and Management. 331. EDP Sciences. https://doi.org/10.1051/e3sconf/202133104017
Acknowledgements
I would like to express my deep gratitude to the Engineering Consulting and Studies Centre (ECSC), Faculty of Engineering at Shoubra, Benha University, Cairo, Egypt for providing me with the elevation data obtained from the GPS in the study area.
Funding
Open access funding provided by The Science, Technology & Innovation Funding Authority (STDF) in cooperation with The Egyptian Knowledge Bank (EKB).
Author information
Authors and Affiliations
Corresponding author
Ethics declarations
Conflict of interest
The authors declare no competing interests.
Additional information
Responsible Editor: Biswajeet Pradhan
Rights and permissions
Open Access This article is licensed under a Creative Commons Attribution 4.0 International License, which permits use, sharing, adaptation, distribution and reproduction in any medium or format, as long as you give appropriate credit to the original author(s) and the source, provide a link to the Creative Commons licence, and indicate if changes were made. The images or other third party material in this article are included in the article's Creative Commons licence, unless indicated otherwise in a credit line to the material. If material is not included in the article's Creative Commons licence and your intended use is not permitted by statutory regulation or exceeds the permitted use, you will need to obtain permission directly from the copyright holder. To view a copy of this licence, visit http://creativecommons.org/licenses/by/4.0/.
About this article

Cite this article
Aziz, K.M.A., Rashwan, K.S. Comparison of different resolutions of six free online DEMs with GPS elevation data on a new 6th of October City, Egypt. Arab J Geosci 15, 1585 (2022). https://doi.org/10.1007/s12517-022-10845-5
Received:
Accepted:
Published:
DOI: https://doi.org/10.1007/s12517-022-10845-5