
Abstract
Land take by urbanization has increased significantly in the last decades, seriously contributing to the loss and degradation of the land capital. Urban sprawl and the related soil consumption are a major environmental and urban planning issue in the West Asian regions, particularly in the recent context marked by fast economic development and by regional conflicts that produced waves of war refugees and economic migrants. This study quantifies soil sealing due to the urban development between 1962 and 2020 in 28 municipalities located along the coastal strip and the coastal hill range of the Beirut and Mount Lebanon Governorates, in Lebanon, and discusses the impacts of urbanization processes on important ecosystem services such as food security and hydrological risks. The study is based on original data derived from historical topographic maps and from recent geospatial datasets. The two datasets have been generated and combined in a GIS environment by means of an original method that proved to be effective to perform detailed urban change analyses over long time spans covering periods in which no satellite information with sufficient resolution was available. An overall 54.0% increase in land surface taken by urbanization was observed in the study area between 1962 and 2020. This amount is not exceptional if compared to other fast-growing urban centers of the region. It is, however, very high considering the high overall degree of saturation (83.5%) of the available land space, the very dense continuous urban fabric, and the high level of soil sealing on the hill slopes overlooking the plain. These aspects raise concerns about the environmental sustainability of the urbanization process. A very sensitive situation is represented by the suburban areas located on the hill sides and still destined to agricultural crops, which preserve high value traditional rural landscapes. Urgent measures should be taken, framed within improved urban planning policies, to prevent further losses and to mitigate the impacts of the present-day soil sealing situation.
Introduction
Soil sealing due to urban development can be considered as one of the most serious forms, or drivers, of land degradation because it greatly affects the provision of essential ecosystem services, such as food production, water cycle, soil filtering and buffering capacity, and biodiversity (SCBD 2012; Gardi 2017). The loss of productive soil is an important concern because of the time needed for soil formation, which might take hundreds or thousands of years depending on the nature of the soil forming factors, making it a non-renewable resource (Mairota et al. 1998).
During the last decades, urbanization covered large rural areas which were used for intensive agricultural uses and often characterized by high fertility (Zdruli et al. 2010). This trend is particularly alarming in the Middle East and North Africa region that has serious food security issues and is marked by increasing food imports (FAO and ITPS 2015; UN 2019a, b). The Atlas of Urban Expansion (Angel et al. 2016) highlights several cases in West Asia, such as Riyadh (increasing at a 4% average annual rate between 2000 and 2013), Sana (2.8% rate, 2000 to 2014), and Baghdad (2.2% rate, 2000 to 2013).
In developing countries, the natural population increases and the rural to urban movements of people are typical drivers of urban change. Better avenues push rural populations towards urban centers that can offer better job and welfare opportunities, which brings about the development of residential, industrial, and commercial areas, road networks, and infrastructures. The process is often particularly intense in coastal areas due to tourism development. Along the Lebanese coast the inflow of several waves of war refugees, the need to quickly reconstruct settlements severely affected by military conflicts, and the concomitant development of new touristic settlements, generated a fast urban expansion that has been defined as “chaotic” and that occupied large agricultural and forest areas (Masri et al. 2002; Darwish et al. 2004; Darwish 2012; FAO-RNE-SNO 2012). Between 2000 and 2010, 308 km2 of land were affected (63% agricultural lands, 17.2% forest land, and 16.2% grassland); only 3.7% of this land was unproductive, the rest had instead a capability for agriculture, raising attention on the environmental and social costs of the process (FAO-RNE-SNO 2012). The most affected area is the coastal strip between 0 and 400 m above sea level, representing 19.3% of the country area (FAO-RNE-SNO 2012). This strip of land, besides hosting some of the best agricultural lands of the country, has a high hydrological vulnerability that soil sealing can exacerbate.
The civil war during the 1980s and the war against Israel in 2006 caused profound devastations in the urban centers, particularly in Beirut city. The need for fast reconstruction contributed to make the Beirut case a special one. The urbanization processes have often been poorly planned and controlled. International investments also had a role: national regulations allow non-Lebanese to purchase housing, and Lebanon became one of the world’s most vibrant real-estate markets.
This study quantifies the total land area consumed by urbanization in twenty eight municipalities of the coastal strip and of the hill slopes overlooking the coastal plain of Beirut and Mount Lebanon Governorates during the years 1962–2020. The initial date was chosen because of the availability of a detailed official topographic map, portraying the city situation before the conflicts and before the beginning of the most intense growing phase. A brief historical background is also provided based on older historical city maps.
The study area
This study includes twenty eight municipalities located along the coast of Lebanon between Beirut to the south and Sarba to the north along with those located in the metropolitan inland area of Beirut city, for a total surface area of around 8900 ha (Fig. 1). For thirteen of these municipalities, the municipality area is prevalently located on the hill sides, for a total surface of around 3,400 ha, whereas the others are mainly located in the coastal plain (Table 1). The coastal region is characterized by a rugged topography where flat morphologies occupy a narrow area along the seashore, with an average width of about 500 m that only in the Beirut urban area reaches around 5 km.

Location of the study area, with the boundaries of all the municipalities considered. Authors’ elaboration
Climate
Beirut and the coastal hills are characterized by a typical Mediterranean climate, with mean annual rainfall ranging between 700–800 mm and 1300–1400 mm across the area, depending on the distance to the sea, altimetry and relief exposition, with minimum in the coastal plains and maximum at the highest altitude (Darwish et al. 2006; Bou Kheir et al. 2006). Precipitations are concentrated between October and February–March, a period accounting for 75–80% of the annual rainfall. The remaining 20–25% falls between April and September–October, often in form of spring showers or summer thunderstorms. The soil moisture regimes defined according to the Soil Taxonomy system are xeric along the coastal plains and ustic to udic on the hills, depending on total annual rainfall, altimetry, aspect, and monthly distribution (Darwish et al. 2004).
Population
The steady growth of the population has driven land take in the study area. In Lebanon, no official population census was done since 1932, and population numbers are always estimated, also for political reasons involving the need to preserve balance between the different religious groups. Estimates published by international organizations do not fully coincide with those published by the Central Administration of Statistics (CAS) of Lebanon.
The total resident population in 2019 was estimated by the United Nations at around 6.9 million (UN 2019a). Annual rate of population change varied between 5.5% during the 2010–2015 period and 0.9 during 2015–2020 (UN 2019a). The urban share of the population was a large part of the total (89%), a very high rate if compared to the world average of 55% (UN 2019b).
The total population is around 4.8 million according to CAS (2019), including almost 1 million of non-Lebanese citizens, but “excluding people living in nonresidential units, such as army barracks, refugee camps and adjacent gatherings, and informal settlements”. In 2018 Lebanon was hosting 0.9 million refugees, in addition to the 425,000 Palestinian refugees registered since 1948 (UNHCR 2020). Many refugees live in or around the main urban centers; as an example respectively 9.6% and 39.5% of Palestinian refugees resided in the two governorates of Beirut and Mount of Lebanon (MOE 2013).
According to Faour and Mhawej (2014), the total population of Greater Beirut Area would have increased from 400,000 to about 1.1 million between the independence in 1943 and the civil war of 1975, whereas in 2001 the city residents were 1.5 million with an approximate average density of 6200 inhabitants for km2. In 2019 Beirut and Mount of Beirut Governorates, respectively, have 0.34 and 2 million estimated residents (CAS 2019).
Historical background
The Lebanese coastal areas are intensively inhabited since the Bronze Age. In the Beirut territory this has been favored by the availability of important water resources, from the homonymous river and from the numerous springs that are still present today. Beirut and its territory did not play an important role during the period of the Phoenician city-states. It is during the Roman time that the city assumed an important political role, obtaining the status of “Roman colony” in the first century AD. Its importance grew during the Byzantine period when it became the seat of an important center of legal studies. During the Crusade period Beirut and its territory were repeatedly occupied by both Christian and Arab armies. During the Ottoman rule, between the sixteenth century and the first decade of the twentieth century, the city saw alternating periods of economic growth and serious crisis.
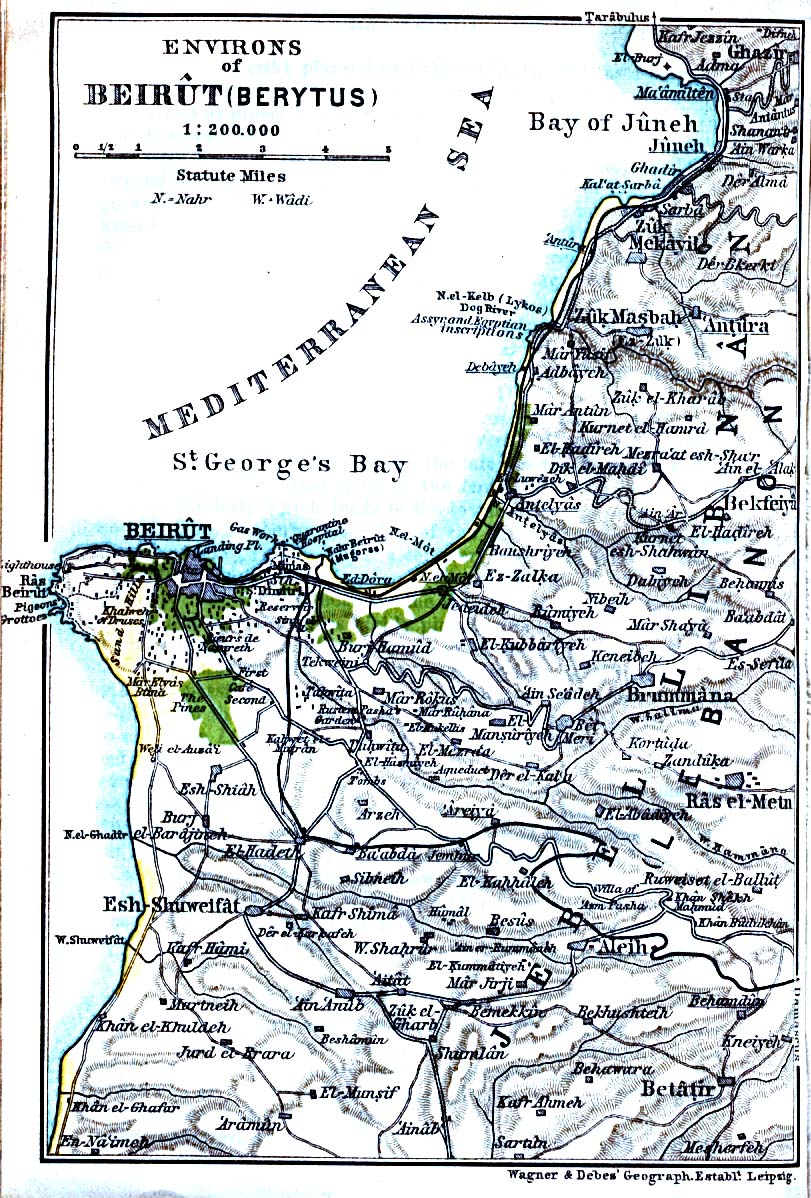
In 1841 the urban center still occupied only about 50 ha and was still surrounded by wide mulberry plantations (Fig. 2). A city map of 1912 (Fig. 3) shows a considerable extension of the urban fabric both along the coast and towards the inland hills. No other important urban area can be seen along the coastal arch in the same year (Fig. 4).

the authors for enhanced readability. (https://almashriq.hiof.no/lebanon/900/930/930.1/beirut/reconstruction/davie/Davie-fig-2.jpg)
Beirut in 1841.Modified by

Beirut in 1912. Courtesy of the University of Texas Libraries, the University of Texas at Austin. Open access map from University of Texas Libraries. (https://legacy.lib.utexas.edu/maps/historical/beirut2_1912.jpg)

The coastal to the north of Beirut in 1912. Courtesy of the University of Texas Libraries, the University of Texas at Austin. Open access map from University of Texas Libraries. (https://legacy.lib.utexas.edu/maps/historical/beirut_1912.jpg)
A map drawn in 1934 by the Topographical Service of the French army shows the expansion of Beirut during the first period of the French occupation (Fig. 5). The city stretches from the western coast to the Beirut River to the East. The main road network extends both along the coast and towards the neighboring villages, such as Four Ech Chebbak and Chieah, which are separated from the city by a pine forest (“Forêt des Pins”). The current Horsh Park, what remains of the old pine forest, along with the Racecourse and the Beirut Municipal stadium, are now inside the urban fabric.

Beirut in 1934 (Beyrouth F.lle NI 36_12 Bureau Topographique des Troupes Françaises du Levant (http://historic-cities.huji.ac.il/lebanon/beirut/maps/tfl_1936_beirut_b.jpg)
Methods
In developing countries the studies on historical land consumption by urbanization most often address the whole of a state or a wide region, but rarely the individual municipalities, due to the scarcity of detailed information, as an example due to partially or totally missing coverage by aerial photographs. Topographic maps, including colonial legacy maps, are in many cases the only detailed historical data source. These maps in some cases don’t fully cover the country territories and were not regularly updated. This is the case for Lebanon, where the French cartography of the colonial period is only partially usable for this type of studies. The first sufficiently detailed topographic map of Lebanon (1: 20,000 scale) is based on surveys made in 1962. This map has been used as time-zero reference for this study, which has the aim of comparing the present-day situation with the oldest available detailed data. To make it usable, it was scanned, georeferenced, and digitized in a GIS environment (ESRI’s ArcGIS Pro) for feature extraction.
An original method has been developed to quantify the area affected by urbanization in 1962 by different categories of urban fabric. This has been done based on the graphical symbology defined by the map legend, by applying cartographic criteria to aggregate and generalize features when necessary, and introducing rules to translate point and line symbols into surface areas, as follows:
-
1.
Continuous urban fabric. Urban centers, and villages, industrial settlements, ports and airports (adjacent to urban centers or not) fall into this category. The affected area is mapped as a polygon, by means of a continuous line along the ideal perimeter that encloses fabric belonging to this category, such as buildings, interleaved lots occupied by public and private gardens and parks and also areas that, although not yet built-up, are affected by primary urbanization works such as a network of roads.
-
2.
Country side structures. The official cartography identifies houses and buildings located in the extra-urban territory through a graphical point symbol. It is therefore not possible to have an indication of the type of building and of its real size. As done in previous studies (Madrau et al. 2001, Madrau et al., 2006; Enne et al. 2003), the two sub types defined below were distinguished based on the graphical symbol used by the map to indicate the land use in the surrounding open areas, or based on the proximity of other buildings, either contiguous or separated by a road. Standard surface areas were then assigned to each type, also accounting for the possible appurtenances and services, such as parking areas, gardens, depots, wood sheds, etc., as follows.
-
3.
Structures mainly intended for agricultural uses, such as depots for agricultural machinery and first harvesting of agricultural products, etc.: standard surface 100 m2.
-
4.
Structures mainly intended as residential buildings: standard surface 300 m2.
-
5.
Road networks. This heading includes both road networks, of any level and width, and the railway network. Service areas and motorway interchange zones are also part of the road network category. Based on the cartographic symbols used in the map, the following types of roads have been identified, which have been assigned standard widths (including ballast and side shoulders).
-
6.
Highways: standard width 25 m.
-
7.
First level roads: four carriage ways, linking urban centers to highways: 15 m.
-
8.
Second level roads: connecting one or more inhabited centers to each other or to a first level road or highway network: 12 m.
-
9.
Third level roads: two carriage ways, forming the main extra urban road system: 8 m.
-
10.
Fourth level roads: combining sparse built areas located in the countryside with the upper level road network: 5 m.
-
11.
Railroad networks: normal track rail road: 10 m.
Land consumption in 2020 was instead quantified by visual interpretation of Google Earth imagery. Present-day satellite data, with metric to sub-metric pixel size, provide unprecedented levels of detail that support detailed visual recognition of topographic features which classification is still not possible by automatic image classification procedures (e.g., building type, road type, etc.). So, the different types of artificial areas of 2020 were visually mapped on the screen and downloaded as GIS vector files.
The two obtained data layers (1962 and 2020) were then compared by overlay mapping through the above-mentioned GIS software to derive urban area change data for each municipality.
Results and discussion
The urban surface area in 1962
The total area ascribed to the 28 municipalities in 1962 is around 8500 ha (Table 1). The largest municipality is Beirut with 2036 ha. The surface of the other municipalities varies from 867 ha (Baabda) to 63 ha (Mazraat Deir Aaoukar).
Continuous residential areas
The total area allocated to continuous urban fabric, including urban centers and villages, was 4867 ha, or 57% of the total municipality area (Table 1). The municipalities with the highest occupied surface were Beirut (1959 ha, 96.2% of its municipal area), and Chiyah (573 ha; 66.6%). Baabda (292 ha; 33.7%) and Baouchriye (250 ha; 64.9%) were the next ones in terms of absolute surface area urbanized. In terms of percentage the second highest values was measured for Haret Hreik (156 ha; 86.7%).
Road network
The total area affected by the road networks not included within the perimeter of the urban centers and villages was around 192 ha (Table 2), most of which (79 ha; 41.2%) was made of 3rd level roads. The municipalities with the greatest development of road networks in terms of surface area were Baabda (28 ha; 3.2%), Hadath (20 ha; 3.6%) and Zouk Mosbeh (20 ha; 4.4%). The municipality with the highest percentage value was Maazrat Deir Aaoukar (13 ha; 21.2%).
Country side structures
The total area occupied by country side structures was around 27 ha in 1962, corresponding to 0.3% of the total municipality area (Table 3). Part of this area (19 ha; 69.7%) can be ascribed to residential buildings. The municipalities that recorded the highest absolute values were Hadath and Baabda, with around 3.9 ha and 3.6 ha respectively. In the other municipalities the areas affected ranged from 1.9 ha (Maazrat Deir Aaoukar) to 0.2 ha (Byaqout). No country side structures were observed in the territories of Borj Hammoud and Beirut.
The areas occupied by the three categories of urban fabric are summarized in Table 4. The total urbanized surface was around 4846 ha, corresponding to 56.9% of the study area. After Beirut, the municipalities of Chiyah (579 ha; 67.2%), Baabda (287 ha; 33.1%), Baouchriye (255 ha; 66.2%), and Borj Hammoud (197 ha; 82.7%), immediately peripheral to the capital, were among those with the largest land take values. Considering the municipalities that are not immediately peripheral to Beirut, Haret Hreik (158 ha; 87.7%) and Sinn El Finn (147 ha; 65.7%) recorded the highest land occupation in 1962. Among the municipalities with prevalent hilly morphology the highest values were found at Zouk Mkayel (107 ha; 35.2%) and Zouk Mosbeh (114 ha; 25.3%).
Land consumption in 2020
The extent of the municipality areas did not remain unchanged during the period considered (Table 5). There was an extension for some towns located along the coast, with a total surface area increase of around 409 ha.
Continuous residential areas
The total area occupied by continuous urban fabric (urban centers and villages) in 2020 was around 7418 ha, corresponding to 83.2% of the total municipality area (Table 6). As for 1962, Beirut recorded the highest total surface area (2084 ha in 2020; 97.7% of the municipality area) with an increase of around 125 ha compared to 1962, due to new structures along the coast, including the new harbor. Chiyah was among the other municipalities showing significant increases (844 ha in 2020, or 93.3% of the municipality area, with an increase of around 271 ha compared to 1962), due to both new residential areas constituting a continuum with Beirut and to the extension of the airport facilities. Other important increases were observed in Baabda (646 ha, or 73.6% of land occupation in 2020; + 355 ha since 1962), Hadath (492 ha; 88.2%; + 291 ha) and Zouk Mosbeh (324 ha; 69.3%; + 215 ha). The latter almost doubled its continuous urban fabric area (+ 199%).
Road network
The analysis of satellite images shows an extra-urban network covering around 26 ha, equivalent to about 0.3% of the study area, only equivalent to a 13.5% of the area occupied by this type of fabric in 1962 (Table 7). In fact, during the 1962–2020 period the expansion of the continuous urban fabric absorbed large parts of the pre-existing extra-urban road network.
The greatest decreases were recorded for the secondary and tertiary road networks (respectively, from around 31 ha to 5.5 ha and from 80 to 12 ha). The fourth-level road system, of strictly local interest, occupies only 2.50 ha in 2020. The coastal highway in 2020 takes only 3.2 ha outside the urban fabric, and the rail road is almost totally incorporated.
Country side structures
The extension of the urban fabric during the 1962–2020 period implied a reduction of the agricultural areas, and the disappearance of the isolated rural buildings in some municipalities. An increase was instead observed in others, corresponding to new isolated residential nuclei (such as in Byaqout and Haret El Bellane) and to new quarries and landfills (as for Mazraat Deir Aaoukar and Mkalles). The total surface occupied by this category of fabric was around 61 ha in 2020, about the double of that observed in 1962 (Table 8).
Changes between 1962 and 2020
All the 28 municipalities showed an increase of the urbanized area between 1962 and 2020, with a total increase of 2611 ha (Table 9). In 2020, 83.5% of the municipality land was urbanized, against 56.9 in 1962.
The largest absolute changes were recorded in Baabda (+ 363 ha), Hadath (+ 325 ha), and Chiyah (+ 265 ha; 28.8%). For the latter the increase is due to both the expansion of the international airport and to the urbanization of the areas adjacent to Beirut city (Fig. 6). Minimum values were found for Mazraat Deir Aaoukar (+ 10 ha) and Mkalles (+ 13 ha), small villages on the hill range.

Increase in urbanized area in the municipality of Chiyah, 1962 to 2020. Authors’ elaboration
In terms of percentage of municipal surface affected by urbanization, Hadath, Naqqach, and Fanar showed the highest changes, with over 50% of further municipality land take between 1962 and 2020. An exception is Beirut, where the increase was very little (1.6%), but where almost no space is left for new buildings (98% of the municipal territory already urbanized). Minimum values were observed for Mkalles (further 8% taken), Haret Hreik (11%), and Baouchriye (12%).
In terms of net increase of urbanized surface compared to 1962, the extreme cases are represented by Naqqach (+ 431%) and Dbaiye (+ 377%), both located in the plain. Among the municipalities of the hill range, Haret El Bellané (+ 216%) had the largest increase, followed by Tmaiche (+ 184%), Zouq Mousbeh (+ 183%; Fig. 7), Bqennaya (+ 147%), and Byaqout (+ 282%). In Bqennaya, Byaqout, Tmaiche, Zouk Mosbeh and around Zouk Michael the land take has mainly affected traditional tree crops.

Increase in urbanized area in the municipality of Zouk Mosbeh, 1962 to 2020. Authors’ elaboration
Overall, the total urban area increase was higher for the municipalities located on the hills (1466 ha) than for those located in the plain (1144 ha). On the plain the rate of land occupation changed from 74.7% to 90.8%, whereas on the hills the change was from 29.7% to 72.0%.
In terms of structure of the urban fabric, the observed change mainly consist in an expansion of the continuous fabric, particularly on the plain. Actually the surface area occupied by sparse country side structures shows a very limited increase (from 27.3 ha in 1962 to 60.6 ha in 2020; Table 8) and that of the road and railway networks even decreases, because of the expansion and merging of the urban centers. The density of the continuous fabric is extremely high and the extent of the public green spaces, which in Beirut mainly consist of a single major park occupying around 30 ha, is insignificant.
Discussion
Fast and poorly planned urbanization processes are a common feature in eastern Mediterranean and West Asia regions, particularly in coastal areas, such as in Turkey (Doygun and Alphan 2006) and Egypt (Ali and El-Magd 2016), where tourism and economic development are major drivers of change. In the case of Amman (Jordan), one of the fastest growing cities in the world, the city’s development was partly driven by conspicuous historical and recent refugee inflows. The latter brought about the construction of suburban refugee camps that gradually became permanent and were integrated into the expanding urban fabric (Higgitt 2009).
Some Mediterranean countries of the European Union are experiencing similar issues. As an example, between 2000 and 2006 the average increase in artificial areas in Cyprus and Spain exceeded 14% (EC 2011). Soil sealing, due to its economic, social, and environmental impacts is contributing to make the task of conserving European soils more and more challenging (Panagos et al. 2016).
Unplanned urbanization is considered as a particularly important threat for Lebanon, considering the mountainous nature and the scarcity of arable lands and in view of the weak policies and outdated legislation of the country (FAO-RNE-SNO 2012). The total urbanized area in Lebanon estimated by Landsat data in 2005 was 1348 km2, or 13.2% of the country surface area, of which 650 km2 (31%) covered prime land with high agricultural productivity (Darwish et al. 2012).
Historically, the widest urban centers, 47% of the total urbanized area, are concentrated along the coast (Dar-Iaurif 2002). A previous study on land use change in the Tripoli coastal area (northern Lebanon) between 1964 and 2000, conducted through the combined use of topographic information and satellite data, revealed that 32% of class 1 land (prime land) and 26% of class 2 land, i.e., 971 ha, were converted into urban area (Darwish et al. 2004). Olive groves and horticultural areas were the most affected land uses. The same study stated that overall, as a consequence of the land use changes, only 22.6% of land was fairly used in the study area.
In our study the possibility to quantify the quality and use category of all the urbanized land of the study area was limited by the lack of information related to the relatively large part of land that was occupied historically, before soil and land use mapping were conducted. However, similar considerations could be done. Although the area was already intensively urbanized in 1962 (56.9% of the overall municipality land occupied), the very high rate (83.5%) reached in 2020 indicate a trend towards saturation of the available space. This implies a change from a still relatively balanced suburban landscape including agricultural areas supplying the local food markets to a system more and more dependent on food supplies from distant production areas. There is a relevant issue for Lebanon, a country that relies heavily on food imports.
The EC (2013) has estimated that the fertile land lost to urbanization in Europe between 1990 and 2006 would have produced an equivalent amount of wheat sufficient to produce enough bread to satisfy the needs of 120 million European every year. The same calculation method can be applied for the study area, by taking the current average cereal yield of Lebanon (around 3 kg per ha), and the average per capita consumption rate of cereals of developing countries (60 kg per person per year; OECD and FAO 2018). Based on these assumptions it can be estimated that the 1144 ha of soils sealed in the coastal plain during the study period, if kept under arable use, could produce around 3400 tons of wheat every year, an amount sufficient to satisfy the annual needs of around 57,000 persons.
On the other hand, the implications of soil sealing go beyond the agricultural quality of the covered land and food security. During the last decade holistic approaches have been developed to evaluate the multifaceted environmental and socio-economic impacts of soil sealing, which are of particular relevance to complex contexts such as the coastal systems. These include impacts on soil functions resulting from modified energy transfer, water and gas movements and the biological processes (Scalenghe and Franco 2009), impacts on hydrology (e.g., Pistocchi 2017), on the provision of ecosystem services (e.g., Pavo-Zuckermann and Pouyat 2017), biodiversity (e.g., Louwagie et al. 2017), and carbon storage (e.g., Lorenz and Lal 2017). Furthermore, these environmental impacts also generate direct and indirect economic costs, as indicated by the World Bank (2010) for the Middle East and North Africa region.
The hydrological impacts of urbanization are of particular relevance to the study area. In the study area urban encroachment strongly affected the previously cultivated and forested mountain slopes overlooking the coastal plain. In fact, 56% of the new urbanization observed (1466 ha) involved the hill range, where 72% of the available municipality space is taken. Considering that almost all the available space (90.8%) between the hills and the sea is also sealed by constructions, it is clear that hydrological risks are high. In the study area this process has already increased the erosion and flood risk both on the hill sides and in downstream areas (Bou Kheir et al. 2006). Similar situations were observed also in other Lebanese urban coastal areas such as Tripoli, Byblos, Sidon, and Tyr (Darwish 2012). Other hydrological impacts that would need to be investigated are linked to the decreased ground water recharge due to increased runoff caused by soil sealing, which may in turn favor sea water intrusion in coastal aquifers. The hydrological impacts are most likely increased by the observed high density and continuity of the urban fabric.
Another important issue is that the urbanization pattern of the study area and the high density of the resulting continuous urban fabric can significantly affect the urban microclimate and human wellbeing, which can be considered as additional hidden cost of the local urbanization model. As an example, suburban areas with mature trees can be 3° C cooler than suburban areas without trees, and temperatures above grass fields can be 1 to 2° C lower than in adjacent paved areas (EC 2013).
Moreover, on the hill range urbanization affected the once flourishing traditional agricultural productions such as olive, palm, and fruit trees, which were drastically reduced, often bringing about the destruction of the water and soil conservation practices traditionally adopted by the farmers, such as terraces. This, besides contributing to generate hydrological unbalances and greatly increasing flood risks, as already underlined, also affected landscape ecological functions and aesthetics (e.g., Cugny-Seguin 2017), and constitutes a loss of traditional cultural landscapes, or anthroscapes (Kapur et al. 2019). Specific studied would be needed to quantify the multifaceted impacts of land cover changes on the hill ranges of the Lebanese coast.
All these direct and indirect (hidden) costs of urbanization should not be overlooked. Sound approaches are needed to quantify and raise them to the attention of policy makers.
To promote the adoption of national policies to protect soils from the impacts of soil sealing the European Commission published guidelines based on a three-tiered approach (Limiting, Mitigating, and Compensating), and on the identification of best practices (EC 2011; EEA 2020; Montanarella and Panagos 2021). This approach could be followed also by Lebanon and the countries of the Levant region, considering that urbanization processes are likely to further develop (Al-Shaar et al. 2021). However, policies alone are not enough. Preventing soil sealing and mitigating its impacts require urban and landscape planning and decision support tools to monitor soil sealing and to evaluate its impacts on the provision of ecosystem services. An interesting example is described by Manna et al. (2017).
Conclusions
During the last sixty years, urbanization processes have been intense and poorly planned along the coast of Lebanon. They have been driven by population growth, internal migration, and refugee inflows and in some phases made more chaotic by the need to rebuild important parts of the urban centers severely damaged by military conflicts.
In the twenty-eight municipalities belonging to the governorates of Beirut and Mount of Lebanon, urbanization has brought about the occupation of most of the land available. The occupation rate changed from 56.9% in 1962 to 83.5% in 2020, involving the expansion of the continuous urban fabric that incorporated the pre-existing extra-urban infrastructure and buildings. The density of such continuous fabric is very high, particularly in Beirut municipality where 98% of the space is built-up, and in some others, where the extent of green spaces is insignificant. Furthermore, the urban encroachment did not only involve the coastal plain, but also the hill and mountain slopes, drastically affecting the traditional agricultural landscapes.
Our study highlighted several direct and indirect impacts of this process. Among the most important, the loss of the fertile soils of the coastal plain and of the related equivalent cereal production, the hydrological unbalances and increased risks due to widespread soil sealing and hillside urbanization, and the degradation of the urban microclimate due to the density of the urban fabric and the lack of green spaces.
In synthesis, the poorly planned development of the narrow Beirut coastal strip locked between the sea and the mountain has almost canceled the local agricultural production and has generated important environmental issues. These issues are also present in other coastal areas of the eastern Mediterranean region, but they are particularly important in the study area. Land and soil resources are limited and precious in a relatively small-size mountainous country such as Lebanon that is highly dependent on food imports.
Local governments should urgently adopt measures to secure the protection of what remains of the extra-urban areas still destined to agricultural crops of high economic value, such as olive groves, palm groves, and orchards, which also generate valuable landscapes and provide ecosystem services. Policies are also needed to mitigate the impacts of the present-day soil sealing conditions. Although this is complex and costly, it can be done by developing a vision for future and adopting frameworks and best practices proposed by the international community to make urban areas greener and more sustainable.
Data availability
The study is based on original data that can be made available to the publisher.
Code availability
Not applicable.
References
Ali EM, El-Magd IA (2016) Impact of human interventions and coastal processes along the Nile Delta coast, Egypt during the past twenty-five years. Egypt J Aquat Res 42:1–10
Al-Shaar W, Adjizian Gérard J, Nehme N, Lakiss H, and Buccianti Barakat L (2021) Application of modified cellular automata Markov chain model: forecasting land use pattern in 457 Lebanon. Model Earth Syst Environ 7:1321-1335
Angel S, Blei A M, Parent J, Lamson-Hall P, Galarza Sánchez N (2016) Atlas of Urban Expansion—2016 Edition, Volume 1: Areas and Densities, New York: New York University, Nairobi: UN-Habitat, and Cambridge, MA: Lincoln Institute of Land Policy
Bou Kheir R, Cerdan O, Chadi A (2006) Regional soil erosion risk mapping in Lebanon. Geomorphology 82:347–359
CAS (2019) Population Statistics in 2018–2019. Labour Force and Household Living Conditions Survey 2018–2019. Central Administration of Statistics (CAS) of Lebanon http://www.cas.gov.lb/index.php/demographic-and-social-en/population-en. Last accessed August 2021
Cugny-Seguin M (2017) Impacts of Urban Sprawl on Landscape. In: Gardi C (Ed.). Urban expansion, land cover and soil ecosystem services. Earthscan from Routledge, Taylor and Francis Group. Abingdon, UK
Dar-Iaurif, 2002. “Schéma d‟Aménagement du Territoire Libanais”. Phase 1. Diagnostic ET Problématiques. L0215. September, 2002. Beirut.
Darwish T, Faour G, Khawlie M (2004) Assessing soil degradation by landuse-cover change in coastal Lebanon. Lebanese Sci J 5:45–59
Darwish T, Khawlie M, Jomaa I, Abou Daher M, Awad M, Masri T, Shaban A, Faour Bou Kheir R, Abdallah C, Haddad T (2006) Soil Map of Lebanon 1/50000. CNRS-Lebanon, Monograph Series 4:367
Darwish T (2012) Assessment of the status of soil resources in Lebanon. In: Hamze M. and Koyoumidjian H. (Eds) "Improving National Assessment and Monitoring Capacities for Integrated Environment and Coastal Ecosystem Management”-INCAM Project. Beirut, Chapter VIII 171–198
Doygun H, Alphan H (2006) Monitoring Urbanization of Iskenderun, Turkey, and its Negative Implications. Environ Monit Assess 114:145–155
Enne G, d’Angelo M, Madrau S, Zucca C (2003) Urbanization and Desertification in European Mediterranean Coastal Areas: A Case Study in North-Western Sardinia (Alghero, Italy). In Human settlement development – Vol. II, edited by Marcotullio P. and Sassen S., in Encyclopedia of Life Support Systems (EOLSS). Developed under the Auspices of the UNESCO, Eolss Publisher, Oxford, UK 56–75. http://www.eolss.net
EC (2011) Report on best practices for limiting soil sealing and mitigating its effects. European Commission, DG Environment. Technical Report 2011–050. 231. ISBN : 978–92–79–20669–6
EC (2013) Hard surfaces, hidden costs Publications Office of the European Union Luxembourg Searching for alternatives to land take and soil sealing. European Commission. 31 ISBN :978-92-79-30550-4
EEA (2019) The European Environment — State and Outlook 2020. Knowledge for transition to a sustainable Europe. European Environment Agency. Luxembourg: Publications Office of the European Union. SBN 978-92-9480-090-9. https://doi.org/10.2800/96749. TH-04-19-541-EN-N
FAO and ITPS (2015) Status of the world’s soil resources (SWSR) – technical summary. Food and Agriculture Organization of the United Nations and Intergovernmental Technical Panel on Soils. Rome. ISBN 978–92–5–109004–6
FAO-RNE-SNO (2012) Country Study on Status of Land Tenure, Planning and Management in Oriental Near East Countries. Case of Lebanon. Food and Agriculture Organization of the United Nations. Regional Office for the Near East (RNE). Oriental Near East Sub-Region (SNO). Cairo
Faour G, Mhawej M (2014) Mapping urban transitions in Greater Beirut Area using different space platforms. Land 3:941–956
Higgitt DL (2009) Urbanization and environmental degradation in Jordan. Encyclopedia of Life Support Systems (EOLSS). Human Settlement Development 1:350–360
Kapur S, Akça E, Zucca C, Berberoğlu S, Razzaghi Miavaghi S (2019) Anthroscapes: a robust basis for mapping land quality and sustainable land use patterns. In: Yenişehirlioğlu, F., Özveren, E., Selvi Ünlü, T. [Eds]. Eastern mediterranean port cities. A study of Mersin, Turkey—From Antiquity to Modernity. Springer. The Urban Book Series 1st Ed 63-78. ISBN: 978-3-319-93662-8. https://doi.org/10.1007/978-3-319-93662-8
Khawlie M (2003) Land use planning for the redevelopment of a distributed urban centre: Beirut, Lebanon. Int J Dev Technol 4:267–281
Gardi C (2017) Urban expansion, land cover and soil ecosystem services. Earthscan from Routledge, Taylor and Francis Group. Abingdon, UK 320
Lorenz K and Lal R (2017) Impact of Land Take and Soil Sealing on Carbon Storage. In: Gardi C, (Ed.). Urban expansion, land cover and soil ecosystem services. Earthscan from Routledge, Taylor and Francis Group. Abingdon, UK
Louwagie G, Gregor M, Löhnertz M, Aksoy E, Schröder C, Orlitova E (2017) Impact of Land Take on Biodiversity. In: Gardi C, (Ed.). Urban expansion, land cover and soil ecosystem services. Earthscan from Routledge, Taylor and Francis Group. Abingdon, UK
Madrau S, d’Angelo M, Enne G, (2001) Soil consumption by urbanisation: a case study in North Sardinia. In: Camarda D, Grassini L (Eds.), Conflicts on sustainable use of soil and water. Options Méditerranéennes, Serie A 44:287 – 294
Madrau S, Previtali F, Zucca C, Enne G (2006) Soil consumption by urbanisation in the north-eastern Sardinian coast from 1958 to 1998. Proceedings of 3rd International Conference on Soils of Urban, Industrial, Traffic, Mining and Military Areas (SUITMA). Cairo, Egypt
Mairota P, Thornes JB, Geeson N A [Eds.] (1998) Atlas of European Mediterranean Environments: The Desertification Context. Wiley and Sons. Chichester, UK 150
Manna P, Angelo B, Antonello B, Amedeo D, Carlo D, Michela I, Giuliano L, Florindo MA, Paolo P, Vingiani S, Fabio T (2017) Soil sealing: quantifying impacts on soil functions by a geospatial decision support system. Land Degrad Dev 28:2513–2526. https://doi.org/10.1002/ldr.2802
Masri T, Khawlie M, Faour G (2002) Land cover change over the last 40 years in Lebanon. Lebanese Sci J 3
Ministère de la Défense and État Major de l’Armée (n.d.) Direction des Affaires Geographiques, Carte Topographiques du Liban 1/20000; Feuilles J-4, J-5, K-4, K-5, L-5. Beirut
MOE (2013) State of Trend of the Lebanese Environment (SOER). Ministry of Environment www.undp.org.lb/communication/publications/downloads/SOER_en.pdf
Montanarella L, Panagos P (2021) The relevance of sustainable soil management within the European Green Deal. Land Use Policy 100:104950. https://doi.org/10.1016/j.landusepol.2020.104950
OECD and FAO (2018) OECD‑FAO Agricultural Outlook 2018‑2027. Chapter 3. Cereals 109–125. ISBN 978–92–64–29721–0. https://doi.org/10.1787/agr_outlook-2018-en
Panagos P, Imeson A, Meusburger K, Borrelli P, Poesen J, Alewell C (2016) Soil conservation in Europe: wish or reality? Land Degrad Dev 27:1547–1551
Pavo-Zuckermann M, Pouyat R (2017) Urban Expansion and Impacts on Ecosystem Services: An Overview. In: Gardi, C., (Ed.). Urban expansion, land cover and soil ecosystem services. Earthscan from Routledge, Taylor and Francis Group. Abingdon, UK
Pistocchi A (2017) Hydrological Impact of soil sealing and urban land take. In: Gardi, C., (Ed.). Urban expansion, land cover and soil ecosystem services. Earthscan from Routledge, Taylor and Francis Group. Abingdon, UK
Scalenghe R, Franco AM (2009) The anthropogenic sealing of soils in urban areas. Landsc Urban Plan 90:1–10. https://doi.org/10.1016/j.landurbplan.2008.10.011
SCBD (2012) Secretariat of the Convention on Biological Diversity. Cities and Biodiversity Outlook. Montreal 64. ISBN 92–9225–432–2
UN (2019a) United Nations, Department of Economic and Social Affairs, Population Division World Population Prospects Volume II: Demographic Profiles (ST/ESA/SER.A/427)
UN (2019b) United Nations, Department of Economic and Social Affairs, Population Division. World urbanization prospects 2018. Highlights. ST/ESA/SER.A/421
UNHCR (2020) Global trends. Forced displacement in 2019. United Nations High Commissioner for Refugees. Statistics and Demographics Section. UNHCR Global Data Service. Copenhagen. 84 pp. https://www.unhcr.org/5ee200e37.pdf. Accessed Jan 2022
World Bank (2010). The cost of environmental degradation. Case studies from the middle east and north Africa. Directions in development. Environment 56295. The World Bank. Washington. 192 pp. ISBN: 978-0-8213-8318-6. https://doi.org/10.1596/978-0-8213-8318-6. https://openknowledge.worldbank.org/handle/10986/2499. Accessed Jan 2022
Zdruli P, Kapur S, Celik I (2010) Soils of the Mediterranean region, their characteristics, management and sustainable use. In Kapur S, Eswaran H, Blum W. Sustainable Land Use: Learning from the past for the future. Springer-Verlag Berlin Heidelberg 2011. 125–142 ISBN 978–3–642–14781–4. https://doi.org/10.1007/978-3-642-14782-1_4
Acknowledgements
This study has been partly supported by the 2020 Research Funds of the University of Sassari (Fondo di Ateneo per la Ricerca 2020 “FAR2020MADRAUS”).
Funding
This study has been supported by the 2020 Research Funds of the University of Sassari (Fondo di Ateneo per la Ricerca 2020 “FAR2020MADRAUS”).
Author information
Authors and Affiliations
Contributions
Optional: not specified.
Corresponding author
Ethics declarations
Ethics approval
Not applicable.
Consent to participate
Not applicable.
Consent for publication
Figures obtained from web sources are flagged as “open access” by owners.
Conflicts of interest/Competing interests
Not applicable.
Additional information
Responsible Editor: Amjad Kallel.
Rights and permissions
Open Access This article is licensed under a Creative Commons Attribution 4.0 International License, which permits use, sharing, adaptation, distribution and reproduction in any medium or format, as long as you give appropriate credit to the original author(s) and the source, provide a link to the Creative Commons licence, and indicate if changes were made. The images or other third party material in this article are included in the article's Creative Commons licence, unless indicated otherwise in a credit line to the material. If material is not included in the article's Creative Commons licence and your intended use is not permitted by statutory regulation or exceeds the permitted use, you will need to obtain permission directly from the copyright holder. To view a copy of this licence, visit http://creativecommons.org/licenses/by/4.0/.
About this article

Cite this article
Hassoun, G., Madrau, S., El Arab, M. et al. Soil sealing along the Beirut coast during half a century marked by population growth and refugee inflows. Arab J Geosci 15, 266 (2022). https://doi.org/10.1007/s12517-022-09520-6
Received:
Accepted:
Published:
DOI: https://doi.org/10.1007/s12517-022-09520-6