
Abstract
Perceived travel times of travelers are usually longer than actually realized travel times, implying that passengers’ experience of travel time savings is different from objectively calculated savings. This study provides additional empirical evidence on this topic, by comparing the passengers’ perceived travel times reported in an (online) survey with their corresponding actual in-vehicle travel times from Automatic Vehicle Location (AVL) data. The case study involves the metro, tram and bus network of Amsterdam, the Netherlands. On average, travelers perceive their travel time to be 1.9 min (11%) longer than their actual realized travel time. The perceived values match the scheduled values slightly better than the actually realized values. Furthermore, we found a larger travel time over-perception for metro compared to tram and bus. This is a counter-intuitive result, since the metro has been found to have a less negative travel time perception than busses in the public transport choice modelling literature. When the travel purpose is considered, the leisure time purposes recreation and shopping have a significantly smaller travel time over-perception than work-related journeys. Opening a new metro line did not have a significant influence on the travel time perception of travelers in Amsterdam.
1 Introduction
When a new infrastructural public transport (PT) project is realized, it is typically aimed at improving PT service quality (i.e. shorter travel times, shorter waiting times, less transfers). These service aspects and related ridership impacts can be measured objectively by using automated data sources, like smart card data (see e.g. Kurauchi and Schmöcker 2017) and automated vehicle location (AVL) data (see e.g. Hickman 2004). In Brands et al. (2020) we analyzed the impacts of the introduction of a new metro line based on both of these data sources. However, perceived travel times are usually worse than the actual travel times, implying that passengers experience more travel time savings than calculated based on the objective savings (Meng et al. 2018; González et al. 2015; Diab and El-Geneidy 2012).
Although the idea of distortion of travel time perception is not new (O’Farrell and Markham 1974), so far only few studies have looked at the perception of travel times in public transport. Several legs of the public transport journey were studied, which are known to have different valuations by travelers (Wardman 2014): in-vehicle travel times (Meng et al. 2018; Diab and El-Geneidy 2012; Varotto et al. 2014), waiting times (Fan et al. 2016; Psarros et al. 2011; Watkins et al. 2011), walking times (Dewulf et al. 2012) and transfer times (Hua et al. 2018).
Some of these studies use manual tracking (Meng et al. 2018; Psarros et al. 2011) or assignment models (Varotto et al. 2014) for estimating the actual travel times. A stream of research utilizes GPS tracking data as an alternative/supplement to household travel survey/travel dairy data (Kelly et al. 2013), with the more recent ones using smartphone applications for such measurements (for example Delclòs-Alió et al. 2017; Nitsche et al. 2014). Although very accurate, such data requires the respondents to wear a GPS tracking device or smartphone, which can be expensive in terms of collecting and returning the device. Additionally, it may impose a high burden on the smart phone battery.
Kelly et al. (2013) reviewed multiple studies comparing GPS measured travel times against those reported in a survey, and noted that in the studies where the two travel times were matched pairwise, surveys tend to over-report travel times by 3 to 6.5 min (9.2–34.2%) per journey in the case of matched studies. Amongst the more recent studies, Delclòs-Alió et al. (2017) compared the survey reported travel times to the actual travel times measured using a smart phone application, and found that most public transport travelers marginally under-perceive their travel times. Both Meng et al. (2018) and González et al. (2015) found the survey reported times to be higher on average than the actual ones. Meng et al. (2018) found that the travel time perception is influenced by the respondent’s socio-economic characteristics, trip characteristics and facility usage, whereas the gender and trip purpose were found to not have an impact. Further, González et al. (2015) noted in their study of tram travelers that some of the factors explaining travelers’ perceptions are different for those who over-perceive versus under-perceive the travel times.
The contribution of this study is to provide additional empirical evidence to the limited number of studies on travel time perception of urban public transport travelers. Specifically for PT data, AVL data provides a good source for actual travel times. Hence in this study, we compare (online) survey-reported travel times with their corresponding actual travel times from Automatic Vehicle Location (AVL) data. Diab and El-Geneidy (2012) also use AVL data for calculating bus travel times but use an aggregate value of travel time for each route. In this study we undertake a pair-wise matching of each observation with corresponding AVL data, providing a more realistic measurement of realized travel times. We investigate the extent to which travel time perceptions as reported in the online survey differ from measured actual travel times.
Furthermore, we investigate differences among a distinct type of trips (travel time, mode, number of transfers and trip purpose), among groups of travelers (frequency of PT use, general attitude towards PT and personal respondent’s characteristics like age, employment, education and income) and between the times before and after opening the new metro line.
The remainder of this paper is structured as follows. In Sect. 2, the data sources (travel survey data and AVL data) are described, as well as the used methods to compare data sets. In Sect. 3, the case study in Amsterdam, the Netherlands is described. Section 4 presents the results of the perceived vs. actual travel time comparison. In Sect. 5, conclusions and recommendations for further research are given.
2 Data sources and method
2.1 Travel survey
The online travel survey was conducted among respondent panels containing inhabitants from the municipalities of Amsterdam, Purmerend and Zaanstad (the Netherlands), both in June 2018 (before opening the new metro line) and June 2019 (after opening). The survey had approximately 3500 respondents each for both before and after opening the metro line. In these respondent panels, age 65 + was overrepresented (31% in the survey panel and 13% in the population, see Table 1) and the male gender was slightly overrepresented (58% in the survey panel and 50% in the population). In both measurements the same respondent panels were used, so it is likely that a part of the respondents answered the surveys both before and after the opening of the metro line. However, the respondents were anonymized for privacy reasons, so we do not know this for sure.
The following information was collected from each respondent about their last PT journey: origin and destination PT stops, number of transfers, mode(s) used, travel purpose, journey date and departure time. Furthermore, personal characteristics and general attitude toward PT were asked for. For the reported last PT journey, respondents were asked to report the travel times for each leg of the journey (access, waiting at first stop, in-vehicle, transfer and egress). Figure 1 shows the different components of travel times that were requested to each survey respondent (shown in the figure for the case of journey with one transfer). These reported times are the times as perceived by the traveler.

A public transport journey consisting of separate legs
Each of these travel time attributes is shortly described below:
-
Access and egress times. The access time corresponds to the travel time from the traveler’s origin location (such as home or workplace) to the chosen PT stop where he/she boards the first PT vehicle. Similarly, egress time corresponds to the time taken to travel from the last PT stop to their destination location. For the access and egress legs of the journey, usually non-PT modes are used. Access and egress distance could be derived from home and destination addresses reported in relation to origin and destination stops. However, translating distance to travel time would need travel speeds, which vary greatly from person to person, especially for walking and bicycle.
-
Waiting time at the first stop (origin). In the survey also the origin waiting time is reported by respondents. However, since the realized arrival time of the respondent at the origin stop is not known with surety, the corresponding actual average waiting time cannot be derived accurately from the AVL data.
-
In-vehicle time(s). These times include the part of the journey undertaken in a PT vehicle. In case of journeys with transfer(s), the in-vehicle time for each journey -leg is recorded separately. Since the departure time information is known as well, this data can be matched against the AVL data.
-
Transfer time. This includes the walking and waiting time at each transfer location. For realized transfer time, we observe a large variation in the studied time interval of ± 15 min, depending on whether a travel option had a good or bad realized connection. Furthermore, for very small transfer times it is not sure if a traveller was able to walk fast enough to catch the transfer or not. That is the reason for not including transfer times in the analysis either, since the realized times are not reliable enough for comparing them with the reported times.
The various travel time components presented above are valued differently by travelers (Wardman 2014), and therefore would be interesting to investigate separately. In this study, we focus on the in-vehicle travel time component of the journey, since it can be directly matched with the AVL data, which is described in the subsequent paragraphs.
2.2 Realized travel times
In the Netherlands, AVL data is available as open data (Van Oort et al. 2015) and provides the realized and planned departure and arrival times at each stop for each PT trip. Based on the survey reported date, time, line, origin stop and destination stop, the corresponding vehicle trips were identified from the AVL data. A time interval of ± 15 min from the survey-reported departure time was used, to account for a possible error in departure time reporting by travelers. Due to this possible reporting error, taking the average AVL times over a 30-min time interval is expected to be more reliable than exactly matching them to a single AVL-trip. The average travel time (from stop to stop) for all vehicle trips within this time interval was used as actual (realized) travel times. Furthermore, the (average) planned travel time was derived from this data.
For journeys without transfer, if the origin and destination stop were correctly reported by the respondent, it is directly clear which AVL times to include. For journeys with a transfer, multiple transfer stops could exist between origin and destination stop. The surveys in June 2018 and June 2019 were slightly different in this regard: in the first survey, the transfer stops were not reported and in the second survey these were explicitly reported. From the AVL data all travel options (i.e. possible transfer stops) were derived and the corresponding travel times were calculated. For the first survey, in those cases with more than one possible transfer stop, the most plausible transfer stop was selected manually from the options available. In most cases, this was the option with the shortest total travel time, but it could also be a logical hub station over an on-street stop. For the second survey, the transfer stop was reported by the traveler, so the manual selection was not needed. However, the second survey confirmed that the manual selection of the transfer stop in most cases resulted in the same station as reported by the traveler.
2.3 Travel time comparison and statistical testing
Once each observation in the survey is matched with corresponding vehicle trip(s) in the AVL data, the difference between perceived and realized in-vehicle travel times is calculated in absolute (formula 1) and relative values (formula 2).
- \({t}_{r}^{diff}\) :
-
absolute travel time difference (perceived vs. actual) for respondent r
- \({t}_{r}^{rel}\) :
-
relative travel time difference (perceived vs. actual) for respondent r
- \({t}_{r,d,t,l,i,j}^{surv}\) :
-
in-vehicle travel time reported by respondent r for date d, time t, on line l, from origin stop i to destination stop j
- \({t}_{d,t,l,i,j}^{AVL}\) :
-
in-vehicle travel time measured using AVL data for date d, time t, on line l, from origin stop i to destination stop j
To exclude unreasonable data points, reported travel times with an absolute deviation larger than 17.5 min or relative deviation larger than a factor 2 from the actual travel times were excluded from the analysis. After removing the outliers, the differences were averaged per mode, number of transfers, journey purpose, travel frequency, attitude toward PT and whether the data was collected before or after the opening of the new metro line.
When differences between groups were identified, the difference was tested statistically by a two-tailed student T-test, assuming that both groups potentially have a different variance. In the result sections the P-values of these tests are mentioned. The tests were applied to the absolute difference results (perceived travel time minus actual travel time). We do not use a hard threshold value for significance: some results are significant on the 0.99 level (P < 0.010), but when relevant also some results of lower significant levels are presented.
3 Case study
In this section the case study is described in more detail. First the city and PT-network of Amsterdam are described. Next, the network change in relation to the new metro line is described in more detail.
3.1 Amsterdam and its public transport network
Amsterdam has about 850,000 inhabitants within its municipality borders. The transit authority ‘Vervoerregio Amsterdam’ also covers the surrounding area (with towns like Amstelveen, Hoofddorp, Zaanstad and Purmerend) of 950 km2 with about 1,500,000 inhabitants (see Fig. 2). Before the opening of the new metro line, the area was served by 25 train stations, 4 metro lines with 51 metro stations, 15 tram lines and several urban and regional bus lines. The broad river IJ divides the city into two parts, where the city center is situated in the larger southern part. The northern part of the city was only served by buses; it is also connected to the rest of the city by 6 ferry connections. All metro, tram and bus lines have the same fare system (a fixed start fare combined with a distance-based fare). Several towns North of Amsterdam (like Zaanstad, Purmerend and Volendam) are connected to the city by bundles of high-frequency regional bus lines.

Area of the Vervoerregio Amsterdam (Vervoerregio 2021)
3.2 The north–south metro line
The new metro line connects the Amsterdam Zuid station to the Noord neighbourhood, passing through the Amsterdam central station and the dense city center. The opening of the new line was accompanied by changes to the existing bus and tram network to provide feeder services to the new line, as well as to remove duplicate routes (Stadsregio Amsterdam 2015). Especially in the northern area, buses are now designed as feeder services for the metro line: a traveler crossing the river can now only take the metro (or ferry). A removal of duplicate routes mainly applies to tram routes in the city center, to and from the central train station. A conceptual visualization of these network changes are shown in Fig. 3. More background information on the network change can be found in Brands et al 2021.

Conceptual visualization of network changes in the tram network (left) and the bus network (right). The Metro is shown in blue (the most Western metro line is the new north–south line) and trams and buses are shown in orange (Stadsregio Amsterdam 2015)
4 Results
4.1 Survey results overview
Of all the reported journeys, only those with 0 or 1 transfers made by the bus, tram and/or metro are considered (see Table 2). This includes trips with transfer between different modes (multimodal trips; for more background information on this type of trips in the context of Amsterdam, see Dixit et al. 2019). Furthermore, observations with one or more empty fields, or the ones which could not be matched with the AVL data were removed from the analysis. Finally, outliers (with unrealistically large deviation values) are removed from the dataset. To include as much observations as possible, the analyses are conducted on the combined dataset (both before and after the opening of the new metro line). Although this may impact the results due to change in network characteristics, we expect this impact to be small, because we do not observe a significant difference in travel time perception between these two datasets (see Sect. 4.2.8).
The survey enabled respondents to fill in their perceived travel time values as integer values (in minutes). However, 68% of the given answers can be divided by 5 min, implying an inherent uncertainty in the perceived values. This is illustrated in Fig. 4, which shows the frequency of reported values for in-vehicle time up until values of 30 min. Rietveld (2001) made a similar observation by noting that the rounding of travel times in travel surveys is “a rule rather than an exception”. They further highlight the higher probability of rounding upward rather than downward, leading to higher average of rounded reported values compared to the actual travel times. In our study, the rounding not only impacts the reported travel times but also the reported departure times. When we match the corresponding AVL trip, we take a time window of ± 15 min to account for this.

Number of observations per reported in-vehicle time value
4.2 Perceived travel times
All valid observations for perceived and actual in-vehicle travel times were compared pair-wise (reported time in survey vs. measured time from AVL data), both in absolute (formula 1) and relative terms (formula 2). When the perceived travel time is lower than the actual time, it is shown as a negative value.
Figure 5 shows that ~ 45% of the respondents report a similar travel time as the actual or planned travel time. There are more people (~ 40%) with a longer travel time perception than with a shorter perception (~ 15%). This result is in line with the findings of Meng et al. (2018) and González et al. (2015), but contradicts those of Delclòs-Alió et al. (2017). It should be noted that in the latter study, the actual travel times were measured by smart phone data, as opposed to the first study where actual travel times were manually tracked, which may have caused the different result. The perceived travel times were collected in a comparable way.

Number of observations per bin of travel time deviation
On average, in-vehicle travel times are perceived almost 2 min (11%) slower than the real values from AVL data. As described in Sect. 4.1, this could also be partly due to the rounding of reported travel time values by respondents.
The perceived values match the planned values slightly better than the actual realized values. The realized values in general are lower on average compared to the planned values, because the timetable is designed based on higher (i.e. more than 50th) percentile values of realized values of the previous timetable design period.
In each of the following subsections the perceived vs. actual comparison is made with different distinctions: by reported travel time, mode, purpose, travel frequency, attitude toward PT and other personal characteristics. Finally, a comparison is made for before and after opening of the new metro line.
4.2.1 Total travel time
We find that the perception of travel time is influenced by the length of travel time (Fig. 6). In general, as the travel time increases, a higher proportion of travelers perceive it to be less than the actual travel times, and for shorter journeys, more travelers over-perceive the travel times. Delclòs-Alió et al. (2017) also found that for shorter trips, travelers perceived the travel times to be longer on average than the actual one, whereas for longer trips the average perceived time was shorter than the actual one. Similar observations were made by González et al. (2015) for tram trips and by Peer et al. (2014) for driving trips.

Change in travel time perception by journey time
4.2.2 Mode
The difference in perceived versus actual travel times varies by main mode (Table 3). For multimodal trips respondents were asked to report the main mode, so it is the mode which is the most important for the journey according to the traveler.
In absolute terms, the travel time perception for the tram is slightly more positive compared to bus (P = 0.035) and metro (P = 0.026). However, due to the relative long average travel time for bus trips, and short average travel time for metro trips in relative terms, the metro is perceived more negatively than the other two modes. The values for the tram, compared to the bus, are as expected, since in general travelers have a more positive attitude towards rail-based modes compared to buses. However, the results for the metro do not agree with this. Possibly this could be due to (some) passengers already starting to perceive metro in-vehicle travel time when entering the station, instead of entering the vehicle. It could also be related to the generally short travel times on the metro (see previous section). Another possible explanation is a relation with travel purpose (see Sect. 4.2.3): the tram is more frequently used for leisure-related purposes than the metro, and leisure-related purposes have a smaller travel time over-perception than other purposes (see Sect. 4.2.4).
In Fig. 7 the box plots show the variation in observations, depending on the mode. The variation within bus and tram is comparable, and the values for the tram are lower for all percentile values, except the lowest value. For the metro the variation is smaller than for bus and tram, related to the shorter average travel time for that mode.
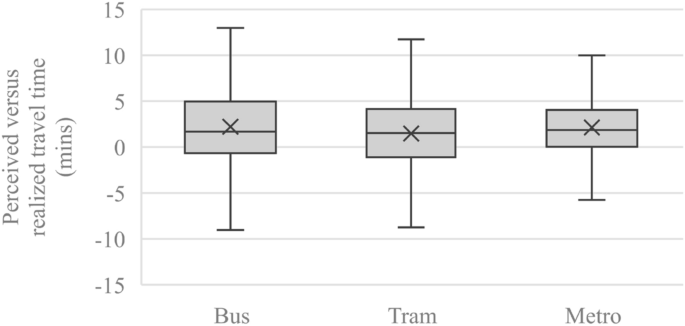
Difference between perceived and realized travel times by mode (showing the minimum, 25th, 50th, 75th percentile and the maximum values as box plot and average value as cross)
4.2.3 Number of transfers
In Table 4 the results are shown for distinguishing between journeys with 0 or 1 transfers and a journey on the urban PT network of Amsterdam vs. journeys (with main leg of the journey) on the regional bus network. For journeys with 1 transfer, the in-vehicle time is over-perceived more than for journeys with 0 transfers (P = 0.003 when comparing 0 transfer with 1 transfer—urban and regional combined). Partly this is due to longer average travel times on these journeys, but also in relative terms a larger deviation is observed. Furthermore, on regional buses the travel time is over-perceived more than on the urban PT network, but this seems to be related to larger average travel times of these journeys, since the relative deviation is smaller.
4.2.4 Purpose
When distinguishing by purpose (Table 5), some interesting observations can be made. The leisure time purposes recreation and shopping have a significantly lower travel time over-perception than work-related journeys (P = 0.000 for recreation and shopping combined vs. work). The purpose social is also usually a leisure time purpose, but in most cases more time constrained/less flexible than recreation and shopping, which explains the larger travel time over-perception (the difference between combined shopping/recreational and social is not statistically strong: P = 0.061). However, social purpose journeys still have a smaller travel time over-perception then work-related journeys (P = 0.038). Medical and education have large deviations, which is expected due to more negative feelings related to these purposes. However, due to the small number of observations in these categories this evidence is weak (when comparing recreational and shopping combined with medical P = 0.005 and when comparing them to education P = 0.059).
In Fig. 8 the box plots show the variation in observations, depending on purpose. The percentile values in general are in line with the trend in average values, except for education, where there is a somewhat larger spread, due to the small number of observations. Despite the overlap shown between the values in the box plots, the differences between purposes as described above appeared to be statistically significant due to a large enough number of observations available per purpose.
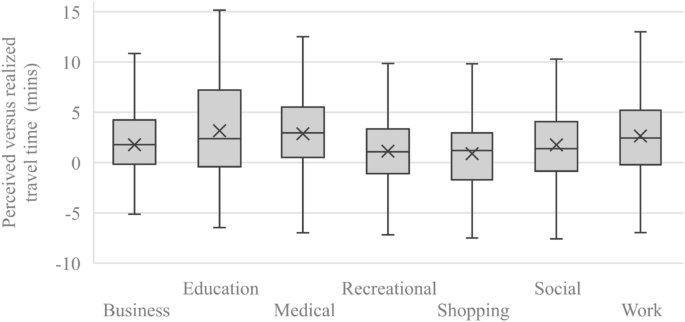
Difference between perceived and realized travel times by purpose (showing the minimum, 25th, 50th, 75th percentile and the maximum values as box plot and average value as cross)
4.2.5 Time of day
When distinguishing by time of day (see Table 6), AM peak is defined as reported departure time between 7 and 9 AM and the PM peak is defined as reported departure time between 4 and 6 PM. We can observe that the travel time deviation is larger in the AM peak than in the other time periods (P = 0.002 when comparing AM peak with PM peak and the rest of the day combined). This result is expected, because we expect more work-related purposes in the AM peak and vehicles are more crowded in the peak periods. A similar, but less strong effect was expected for the PM peak, but we do not observe any difference with the rest of the day. Possible explanations for that are more mixed purposes in the PM peak and people being more relaxed when going home in the PM peak then when going to work in the PM peak.
4.2.6 Travel frequency
More frequent travelers turn out to have a larger deviation in reported travel time vs. actual travel time (Table 7), especially very frequent travelers (4 or more times per week) vs. less frequent travelers (P = 0.008). This result was not expected, since more frequent travelers have more experience in travelling and therefore could be more accurate in reporting travel times, but it is in line with the findings from González et al. (2015). A possible explanation is a correlation with purpose: leisure time purposes have lower travel frequencies and, therefore, a smaller travel time over-perception.
4.2.7 Attitude toward public transport
The general attitude toward PT was measured in the survey by asking to assess the general quality of PT in Amsterdam by giving a grade (1–10). A clear relation can be observed (see Table 8): travelers who assess the quality of PT with a higher grade, have a smaller travel time over-perception. It should be noted that the number of observations for the lowest and highest grade are too low to provide strong evidence. Grades below five were only rarely given and are therefore excluded.
4.2.8 Other personal characteristics
Several other personal characteristics of respondents were tested for significant differences in travel time perception: age, employment, education and income. No significant results could be found, due to small differences or due to small numbers of observations per group. However, some notions can still be made in this section.
For age, older respondents (65 year and older) have a slightly smaller travel time over-perception, partly because of more leisure-related purposes in this age group. Here is a relation with employment as well: retired respondents have a slightly smaller travel time over-perception. With regard to the educational level, no differences in travel time perception pop up. Finally, the second-highest income group has a slightly higher travel time over-perception then the highest income group. However, the third-highest income group again has a lower travel time over-perception then the second-highest group, leading to the conclusion that no clear trend can be observed here.
4.2.9 Before or after opening the new metro line
In Table 9 the results gathered before opening the new metro line are compared with the results of after opening the new line. Travel time over-perception has increased a little, but this is not significant (P = 0.576). In relative terms, the effect is larger, because the average travel time has gone down after the opening. The lower average travel time can be partly explained by trips on the new metro line, which are in general relatively short. It was expected that the travel time perception in the entire city of Amsterdam would not change significantly due to the new line, but the sign of the effect is not as expected: a new metro line would in general mean a more positive experience for the traveler.
5 Conclusions and recommendations
5.1 Conclusions
Perceived travel times of travelers are usually longer than actually realized travel times, implying that passengers’ experience of travel time savings is different (larger) from objectively calculated savings. This study provides additional empirical evidence for urban PT in addition to the limited literature on the topic so far. We compare passenger travel times reported in an (online) survey (looking back to their last public transport journey) with a realistic measurement of their corresponding actual in-vehicle travel times using Automatic Vehicle Location data. We investigated differences among a distinct type of trips (travel time, mode, number of transfers and trip purpose), among groups of travelers (frequency of PT use, general attitude towards PT and personal respondent’s characteristics like age, employment, education and income) and between the times before and after opening the new metro line.
On average, we found that travelers perceive their travel time to be 1.9 min longer (11%) than their actual travel time. This finding is in line with earlier literature, where perceived travel times are reported longer than actual travel times as well (Kelly et al. 2013; Meng et al. 2018). This may be partly caused by rounding of reported travel times, which is common in surveys (Rietveld 2001). Furthermore, the perceived values match the scheduled values slightly better than actually realized values and for shorter journeys travel time over-perception is larger.
When looking at subgroups of travelers, some interesting observations could be made. First, we found a larger travel time over-perception for the metro compared to tram and bus. This is a counter-intuitive result, since the metro has been found to have a less negative travel time perception than busses in the public transport choice modelling literature (see for example Anderson et al. 2017). This is probably caused by the different research perspective.
Second, when the travel purpose is considered, leisure time purposes, such as recreation and shopping have a significantly smaller travel time over-perception than work-related journeys. This is also reflected in the larger travel time over-perception in the AM peak than in the PM peak and in the rest of the day.
Third, frequent travelers turn out to have a larger travel time over-perception compared to less frequent travelers. This was not expected, since more frequent travelers have more experience in traveling and, therefore, could be more accurate in reporting travel times. However, this is in line with the findings from González et al. (2015) who also found that the frequent tram travelers tend to over-perceive their travel time. There could be a correlation with purpose: leisure time purposes have lower travel frequencies and therefore a smaller travel time over-perception.
Finally, opening a new metro line did not have a significant influence on travel time perception of travelers in Amsterdam, which was not expected: a single new line does not have substantial influence on travel time perception in the entire city of Amsterdam.
The fact that in-vehicle travel times are perceived longer than the actual values implies that travel time savings from new network developments (as calculated for example in our earlier work Brands et al. 2020) may be higher in the perception of travelers than the objective time savings, when assuming for individuals that the travel time over-perception is relative to the actual travel time value.
5.2 Recommendations
The research could be extended in the future by also including trains (heavy rail) in the analysis: this data is present in the survey but until now the corresponding AVL data is not available. Furthermore, the interaction between variables (for example mode and purpose) could be researched more deeply. Until now, this has not been done because the number of observations per subgroup becomes small, leading to less significant results.
The rounding of reported travel times in the survey could be alleviated by explicitly asking respondents to report the travel time to the minute level. Furthermore, the manual reporting of stop names by respondents was sensitive to errors and implied a lot of hand work when processing the survey results. Both could be alleviated by implementing an autofill option in the online questionnaire, possibly linked to a map so that the respondent could verify the selected stop location.
The current survey did not ask for comfort levels of the reported trips, such as the in-vehicle crowdedness level and having a seat. It would be interesting for future research to include this aspect, given its expected influence on the perceived in-vehicle time of passengers.
Concerning survey techniques, instead of using an online survey (where a traveller has to look back at the last realized journey), a more reliable result could be achieved by asking the respondent directly after the journey on a mobile device. The departure time could then also be determined more accurately, possibly enabling to retrieve the realized transfer time in addition to the realized in-vehicle time. Furthermore, it could become possible to log the realized waiting time. In that case, the survey should be very short to enable the respondent to answer shortly after the journey.
The results of this study show that travel times on average are perceived worse by travellers than the actual measured travel times. This implies that in situations with travel time savings as a result of policy measures (like the realization of new infrastructure) passengers experience more travel time savings than calculated based on the objective travel time values. Since these objective savings are usually used in cost-benefit analyses and evaluation studies, experienced travel time savings by passengers may be larger. Furthermore, marketing departments, for example from public transport operators, could make use of these results to approach travelers with a more positive mindset towards their PT trip. Also developers of smart phone apps used by travelers in public transport during their trip, for example news apps, could benefit from the knowledge of travel time perception in relation to task completion time/reading time of articles.
References
Anderson MK, Nielsen OA, Prato CG (2017) Multimodal route choice models of public transport passengers in the Greater Copenhagen Area. EURO J Transp Logistics 6(3):221–245
Brands T, Dixit M, van Oort N (2020) Impact of a new metro line in Amsterdam on ridership, travel times, reliability and societal costs and benefits. Eur J Transp Infrastruct Res 20(4):335–353
Brands T, Dixit M, van Oort N (2021) Transformation to a trunk and feeder network: effects on passenger flows, travel times and reliability. In: van Wee B (ed) The role of transport in urban, energy and climate transitions. Proceedings of the 9th BIVEC-GIBET transport research days, Delft, The Netherlands, 27–28 May 2021
Delclòs-Alió X, Marquet O, Miralles-Guasch C (2017) Keeping track of time: a Smartphone-based analysis of travel time perception in a suburban environment. Travel Behav Soc 9:1–9
Dewulf B, Neutens T, Van Dyck D, De Bourdeaudhuij I, Van de Weghe N (2012) Correspondence between objective and perceived walking times to urban destinations: influence of physical activity, neighbourhood walkability, and socio-demographics. Int J Health Geogr 11(1):1–10
Diab EI, El-Geneidy AM (2012) Understanding the impacts of a combination of service improvement strategies on bus running time and passenger’s perception. Transp Res Part A 46:614–625
Dixit M, Brands T, van Oort N, Cats O, Hoogendoorn S (2019) Passenger travel time reliability for multimodal public transport journeys. Transp Res Record 2673(2):149–160
Fan Y, Guthrie A, Levinson D (2016) Waiting time perceptions at transit stops and stations: effects of basic amenities, gender, and security. Transp Res Part A 88:251–264
González RM, Martínez-Budría E, Díaz-Hernández JJ, Esquivel A (2015) Explanatory factors of distorted perceptions of travel time in tram. Transport Res Part F 30:107–114
Hickman M (2004) Bus automatic vehicle location (AVL) systems. In: Gillen D, Levinson D (eds) Assessing the benefits and costs of ITS. Kluwer, pp 59–88
Hua W, Feng X, Zhu X, Jie Y (2018) Comprehensive analysis and evaluation of metro transfer time perception. In: Yu P (ed) 3rd International conference on mechatronics and information technology (ICMIT 2018), Chengdu, China, 30–31 October 2018, pp 89–95. https://doi.org/10.23977/icmit.2018.015
Kelly P, Krenn P, Titze S, Stopher P, Foster C (2013) Quantifying the difference between self-reported and global positioning systems-measured journey durations: a systematic review. Transp Rev 33(4):443–459
Kurauchi F, Schmöcker JD (eds) (2017) Public transport planning with smart card data. CRC Press, Boca Raton
Meng M, Rau A, Mahardhika H (2018) Public transport travel time perception: effects of socioeconomic characteristics, trip characteristics and facility usage. Transp Res Part A 114:24–37
Nitsche P, Widhalm P, Breuss S, Brändle N, Maurer P (2014) Supporting large-scale travel surveys with smartphones—a practical approach. Transp Res Part C 43:212–221
O’Farrell PN, Markham J (1974) Commuter perceptions of public transport work journeys. Environ Plan A 6(1):79–100
Peer S, Knockaert J, Koster P, Verhoef ET (2014) Over-reporting vs. overreacting: Commuters’ perceptions of travel times. Transp Res Part A 69:476–494
Psarros I, Kepaptsoglou K, Karlaftis MG (2011) An empirical investigation of passenger wait time perceptions using hazard-based duration models. J Public Transp 14(3):109–122
Rietveld P (2001) Rounding of arrival and departure times in travel surveys: an interpretation in terms of scheduled activities. Discussion Paper TI, No. 01–110/3. Tinbergen Institute, Amsterdam
Stadsregio Amsterdam (2015) OV LIJNENNETVISIE 2018, vastgesteld op 17 sept. 2015 (in Dutch). url: http://noordzuidlijn.wijnemenjemee.nl/lijnennet/over/
Van Oort N, Sparing D, Brands T, Goverde RMP (2015) Data driven improvements in public transport: the Dutch example. Public Transport 7(3):369–389
Varotto S, Glerum A, Stathopoulos A, Bierlaire M (2014) Modelling travel time perception in transport mode choices. In: 14th Swiss transport research conference, Monte Verità/Ascona, 14–16 May 2014
Vervoerregio (2021) Overzicht gemeenten Vervoerregio Amsterdam (in Dutch). https://vervoerregio.nl/artikel/20170203-overzicht-gemeenten-vervoerregio-amsterdam
Wardman M (2014) Valuing convenience in public transport. Discussion Paper 2014–02. The International Transport Forum at the OECD. http://www.internationaltransportforum.org/jtrc/DiscussionPapers/DP201402.pdf
Watkins KE, Ferris B, Borning A, Rutherford GS, Layton D (2011) Where Is My Bus? Impact of mobile real-time information on the perceived and actual wait time of transit riders. Transp Res Part A 45:839–848
Acknowledgements
This research was funded by the municipality of Amsterdam, Vervoerregio Amsterdam and the AMS Institute. We thank GVB, the municipality of Amsterdam and DOVA for providing the data for this research.
Author information
Authors and Affiliations
Corresponding author
Additional information
Publisher's Note
Springer Nature remains neutral with regard to jurisdictional claims in published maps and institutional affiliations.
Rights and permissions
Open Access This article is licensed under a Creative Commons Attribution 4.0 International License, which permits use, sharing, adaptation, distribution and reproduction in any medium or format, as long as you give appropriate credit to the original author(s) and the source, provide a link to the Creative Commons licence, and indicate if changes were made. The images or other third party material in this article are included in the article's Creative Commons licence, unless indicated otherwise in a credit line to the material. If material is not included in the article's Creative Commons licence and your intended use is not permitted by statutory regulation or exceeds the permitted use, you will need to obtain permission directly from the copyright holder. To view a copy of this licence, visithttp://creativecommons.org/licenses/by/4.0/.
About this article

Cite this article
Brands, T., Dixit, M., Zúñiga, E. et al. Perceived and actual travel times in a multi-modal urban public transport network: comparing survey and AVL data. Public Transp 14, 85–103 (2022). https://doi.org/10.1007/s12469-022-00298-0
Accepted:
Published:
Issue Date:
DOI: https://doi.org/10.1007/s12469-022-00298-0