
Abstract
This article reviews five decades of English and French literature on transit safety in several major databases, with the focus on Scopus and ScienceDirect. The review explores the nature and frequency of transit crime and passengers’ safety perceptions in transport nodes and along the trip using bibliometric analysis and a systematic review of the literature. The number of retrieved documents was 3137, and 245 were selected for in-depth analysis. Transit safety as a research area took off after the mid-1990s and peaked after the 2010s. The body of research is dominated by the English-language literature (mostly large cities), with a focus on the safety of rail-bound environments and examples of interventions to improve actual and perceived safety for public transportation (PT) users. Highlighting the importance of transit environments along the whole trip, the article also helps advocate for more inclusion of passengers’ safety needs and the involvement of multiple stakeholders in implementing PT policies.
1 Introduction
When we use public transportation (PT), we spend a part of our travel time waiting at transport nodes (train stations or bus stops) or walking on our way to them. If we feel at risk of crime or feel anxious about something unpleasant happening while in transit, there is a risk we may start avoiding PT and start looking for other travel alternatives. Therefore, feeling safe in transit environments is a fundamental need of all travelers and a guarantee for a sustainable city (UN-Habitat 2019).
How safe are we while in transit? Our understanding of the conditions that affect safety is growing, but the international literature lacks an updated systematic review of the research evidence. One of the first reviews in this area was carried out by Smith and Clarke (2000), followed later by Smith and Cornish (2006), then in the mid-2010s by Newton (2014), and more recently with a specific focus on gender issues by Ding et al. (2020). None of these were systematic reviews (Higgins and Green 2011), nor did they incorporate studies devoted to safety interventions. They also reflect scholarly material published in English only, and none performed a bibliometric analysis. We argue for the need of a systematic review of the literature on transit crime and safety. Therefore, in this article we collect and systematize scholarly knowledge on the topic covering five decades of studies, written in English primarily but extending also to the French literature as a benchmark. Although this is not the first literature review on transit safety in English or in French (e.g., Bradet and Normandeau 1987; Crossonneau 2003; Noble 2015a, b), this article is the first that covers studies dealing with transit crime (various types) as well as safety perceptions of transit environments, providing:
-
1.
A special focus on studies that deal with the transit environment (stations and bus stops as well as the last-mile mobility and/or safety door-to-door, the so-called “whole journey perspective”). We still can agree with Smith and Clarke (2000) who suggest there is a lack of understanding of “how the conditions favoring crime on public transport arise and why they persist. We have limited knowledge of the mix of forces and constraints—political, geographical, economic, engineering, and others—which have combined to shape and form modern public transport.”
-
2.
Extra attention to studies devoted to safety according to “users’ perspectives” and safety needs. The temporal dimension of these studies is also an interesting feature that has been highlighted in this review but was not pointed out in previous reviews.
-
3.
Lessons from different research traditions, from English and French, with as many perspectives on the topic as possible. The French literature has been chosen because of the long tradition of research on public transportation and also because French is the fifth most common world language, spoken on nearly every continent, providing therefore a good international overview of this field of research.
1.1 Definitions and delimitation
Transit safety is about safety conditions experienced and perceived by public transportation (PT) users along their trip. This may involve PT travelers’ risk of being victimized by crime or feeling unsafe at a particular place (e.g. a station) or in a combination of environments, situations and contexts. For example, Smith and Clarke (2000) indicate that crime can occur when a PT traveler is walking from home to a bus stop, or it may occur from or between transportation nodes; it is when the traveler is exposed to environments that are more or less criminogenic. Similarly, safety perceptions may vary along and within these environments. When the PT traveler is waiting for transportation or is on the move between different sections of stations (e.g. on the metro station platform or walking from the ticket area to the platform). Third, when the PT traveler is on board a mode of transport (see e.g. Newton 2004).
Transit crime includes offenses and/or safety-disturbing behaviors against PT users, personnel, and property. Moreover, crime targets vary and can include the system itself (e.g. vandalism and fare evasion), employees (e.g. assaults on ticket collectors or guards), and PT users (e.g. pickpocketing or assault). These offences and/or safety-disturbing behaviors may not in a strict sense be a “crime” but they affect PT users’ safety perceptions, such as shouting or what Moore (2011) calls “low-level behavior,” ranging from groups of young people behaving boisterously to people talking loudly on mobile phones on trains or buses.
Safety perceptions is used here as an umbrella term for fear of crime and other anxieties that are expressed by PT users along the trip and can vary over time. How individuals perceive transit environments depends on their individual characteristics (age, gender, previous victimization) and the features and contexts of these transit environments (transport mode, type of transport node—bus stop or station—and quality of the environments they spend time in, from their home to a transport node).
For the purposes of this article, we adopted the term public transportation (PT) to capture what North American readers may think of as “public transit,” “mass transit,” “rapid transit,” or just “public transport” systems. Note that we use the terms “PT users,” “PT travelers,” “PT riders,” and “PT passengers” interchangeably. As suggested by Newton (2014), there is no clear consensus of a definition of public transport. PT refers here to “a system used by the public, often a means of transporting passengers in mass numbers, generally a for-hire system that occurs across a fixed route or line,” consisting of a range of transport modes, including rail-bound (railroads, light rail, metro/subway/underground railway, high-speed rail, and intercity rail), buses, trolleybuses, and trams. We limit this literature review to PT only, excluding taxis and Uber services that may be connected to PT. We exclude also studies devoted to events of accidents and suicides and focus instead on crime and safety perceptions only. This perspective includes studies focused on safety during the trip on buses and rail-bound modes, at transport nodes, such as bus stops and stations, and/or on the way to them.
1.2 Research questions
The study is based on materials from an open search from several databases (Scopus, ScienceDirect, Google scholar) which were later split into two parts (a bibliometric analysis and an in-depth analysis of materials both in English and French from 1970). We used the software VOSviewer (https://www.vosviewer.com) to organize and visualize the vast material spanning five decades. This literature review aims to respond to the following questions:
-
1.
When and where have most studies on transit safety been published?
-
2.
Which are the main research domains in transit safety?
-
3.
What are the most common characteristics of transit research in English and French?
-
4.
What is the nature and extent of crime in transit environments?
-
5.
How do temporal, environmental, and other contextual factors influence transit safety?
-
6.
How do the physical and social characteristics of transit environments affect safety perceptions of PT travelers?
-
7.
How does safety vary by different types of PT users?
-
8.
How does technology affect safety in transit environments?
-
9.
Which are the safety interventions used to tackle safety problems in transit environments?
-
10.
Which are the recommendations for future research and practice?
This study is composed of six parts. First, we briefly present the methodology, then we report the results by answering the above questions. In the final section, we identify gaps in the literature and suggest a research agenda as well as policy implications of the current knowledge.
2 Methodology
We used two complementary methods: (1) one was the systematic review using Scopus, Science Direct and Google Scholar database (in French) and (2) the other was a list of publication from the Transit crime network.
-
1.
We conducted a comprehensive search for academic publications (focus was on articles but a bit over 30% were other relevant publications, such as reports and conference papers). We used a variety of bibliographic databases, Scopus and ScienceDirect in particular because they are reliable sources of internationally published research in English language (note that duplets were excluded). In French, because the literature in this area is composed of a mixture of articles and reports distributed in different databases, we used Google Scholar as a search engine to capture multiple sources (Cairn.info, Erudit, Persée, Hal, etc.). A list of keywords used during this process is shown in “Appendix” Table 3.
-
2.
In addition, the literature review used a pre-selected list publication from transit safety researchers provided by a user list Transit crime network (https://maillist.sys.kth.se/mailman/listinfo/abe.kth.se_tcr-network). This sample of references is a convenient sample based on the contributions of experts that actively participate in a forum that discusses transit safety. Although the decision of including the literature in a specialized research forum such as this user list might have created a bias in the sample since many members were experts in the area, we believe that the benefits outweigh the problems. Eventually, we included a few articles by hand during the finalizing process to include newly published articles, resulting in 3137 publications (Fig. 1).
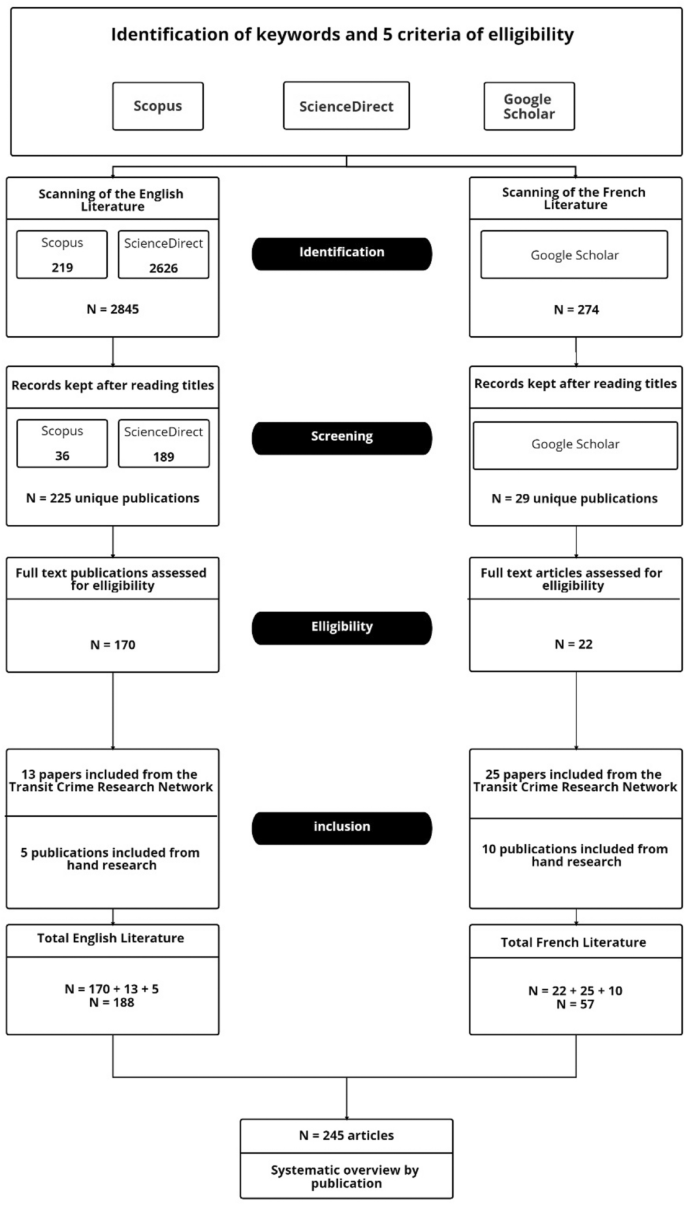
The methodological steps to perform the literature search based on five criteria of selection
From these 3137 publications, 245 were selected (Fig. 1), first eliminating duplicates and later excluding those that were not relevant. We adopted the systematic review protocol of type PRISMA-P 2015 (Moher et al. 2015) to support inclusion based on five criteria of importance:
-
1.
Studies aiming at explaining the link between the transit environment, the perceived safety of riders, and the actual crime occurrences in PT. By “transit environment” we mean the design (e.g. size and layout of platform, lighting, visibility), the technology (e.g. CCTV, apps, RTI), the users (flow, crowdedness), the personnel (e.g. patrols), and the immediate context of the PT node (safety door-to-door).
-
2.
Studies should preferably show temporal patterns of crime and users’ safety perceptions (hours, days, and seasons).
-
3.
Studies that distinguish safety perception and victimization in transit by individual and socio-demographic characteristics, in particular by gender but also by age, ethnic background, disabilities, and socio-economic status. Studies that analyze fear of crime in transit from the user’s perspective.
-
4.
Studies with a focus on crime prevention initiatives. Studies that show qualitative and quantitative evaluation of the impacts of programs or environmental changes that tackle crime and/or perceived safety and/or crime rates in PT.
-
5.
Studies that provide perspectives on the topic that are as varied as possible, in different contexts. We cover therefore publications from 1970 to 2020, in English and in French. Because there is less material in French and a large part consists of reports resulting from surveys (often having a looser structure compared to English-language journal articles). We made the criteria 1–4 more flexible. For instance, we accepted reports from the French Ministry of Transport that were relevant to the topic (e.g. Barjonet et al. 2011).
2.1 Bibliometric analysis
The bibliometric analysis included all English-language articles obtained through the user list and in the data collection process in *.ris (Scopus, Sciencedirect and the TCR network; the French publications were too few to produce meaningful visualization on their own). We used VOSviewer version 1.6.12 (https://www.vosviewer.com) to create bibliometric maps based on the terms cited in the titles of each article and to group the terms in clusters according to their linkages. With these clusters, we were able to visualize several topics. The co-occurrence analysis was performed using the terms in titles adopting the full counting method. For VOSviewer mapping of most frequent terms in titles, a minimum occurrence of two was used as a cutoff point for inclusion of the terms in mapping analysis. From a total of 675 terms, only 106 met the threshold of the minimum number of two occurrences/repetitions. This criterion of a minimum of two repetitions was selected to avoid terms without links or with weak links to the topic and at the same time to ensure the coverage of the terms and representativeness of the articles. The final selection resulted in 62 items out of the 106 keywords. We did not apply any filter based on the software “score relevance.” Instead, we selected the relevant terms ourselves to fit our subject. The map of words was created using a minimum cluster size of 10 to maximize the readability of the map; the rest of the parameters were the default ones. Output files from the database were used to produce informative network maps by topic and a heat map showing the frequency of keywords indicating potential research domains. An example of each is discussed in the section “Findings.”
2.2 In-depth analysis
The bibliometric analysis supports the selection of “research domains” that are discussed in detail. The in-depth analysis was guided by our research questions, namely our interest in knowing about studies on the nature and extent of crime in transit environments, the temporal, spatial, and other factors influencing these crimes, and the potential impact of physical and social environments on safety perceptions of travelers. We also investigated using the literature review to determine whether and how safety perceptions vary by different types of users as well as how technology affects safety in transit environments. In addition, we collected literature about safety door-to-door as well as the types of strategies and interventions that are used to reduce crimes and improve perceived safety in transit environments. From the initial 245, about two thirds are discussed in detail in a set of tables and appendices referenced in the next section.
3 Findings
3.1 Bibliometric analysis
3.1.1 Number and types of retrieved documents
From 245 eligible publications that constitute the base for the analysis, 70% are articles and the remainder are reports, chapters, and conference papers; 77% are in English, and 23% in French. Figure 2a shows the annual share of total publications on transit safety (N = 245). The same is shown in Fig. 2b but divided by language.
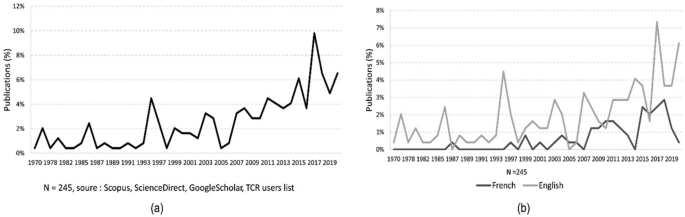
Annual share of total publications on transit safety, 1970–2020 in percentage, a Total and b by language. Source: Selection from Scopus, ScienceDirect, Google Scholar, TCR users list (in percentage). Up to June 2020 only
3.1.2 Evolution of the field over time
The earliest publication within the defined time period was written by the National Technical Information Service (SRI - Stanford Research Institute 1970). This study discussed the nature and causes of robbery and assault of bus drivers and suggested solutions. One of the most recent articles was published by Jun et al. (2020) and was devoted to the gap between users’ needs and the practitioners’ prioritization of accessibility features. A focus on users’ perspectives on safety, particularly on women’s safety, became more common in the last decade. From 1970 to 2010, the number of publications grew slowly, but note that 56% of publications (131) came out in the last 10 years, 37% of the total in the last 5 years (86 publications). The maximum number of publications was recorded in 2017. In addition, 24 papers were published in 2017, and a double special issue in “Crime Prevention and Community Safety” on this theme contributed to almost half of these publications.
The literature is dominated by the English literature. While publications in English are characterized by academic articles published in peer-reviewed journals, the French publications are often reports directed at security professionals, organizations, and practitioners. Therefore, it is no surprise that the French documents follow a looser structure than the English publications do. The target of publications in French is mostly the transit system in France (38 publications), while four reports focus on Canada (Montréal only) and two focus on Belgium. The remainder is about different transit systems in cities around the world.
In terms of content, there are differences between the English and French literature. While the English-language literature has focused more on the causalities between transit environments and crime, the French literature has a more sociological/psychological nature, focusing on travelers’ surveys and users’ behaviors and perspectives on safety (e.g. Barjonet et al. 2010; Noble 2015a, b; Wilow 2015; Vanier and D'arbois 2018a). Examples of the French literature include the seminal work of Bradet and Normandeau (1987) and one of the latest by Noble and Fussy (2020) on feelings of insecurity in public transit. A few deal with issues of safety and governance, including the interplay between public and private sectors (Malochet 2015; Castagnino 2016; Hamelin 2010; Bonnet 2008,2006). Reports written in French are mostly about safety perceptions, with a strong focus on sexual crimes and sexual harassment in PT (e.g. d’Arbois de Jubainville and Vanier 2017; HCEEFH 2015; Debrincat et al. 2016; Colard 2018; Alessandrin et al. 2016).
3.1.3 Most active countries
Most publications are based on examples from the United States (Table 1), with nearly twice as many as in France, followed by the United Kingdom, Sweden, and Canada. However, the United Kingdom is in second position if we exclude reports and count the number of published articles only. More recently, the literature has been expanded by contributions from Latin America (Brazil, Colombia, Mexico), Australia, India, Norway, Malaysia, Japan, and Hong Kong, with more than three publications each (e.g. Shibata et al. 2014; Javier and Ceccato 2020; Otu and Agugua 2020; Chowdhury and van Wee 2020; Fillone and Mateo-Babiano 2018).
3.1.4 Publications by type of geographical area
Public transit systems such as metro, commuting trains, and bus lines in global and capital cities are often the focus of transit safety studies (44% of all publications). Cities such as New York, London, Paris, Tokyo, Los Angeles, Sao Paulo, New Delhi, and Santiago belong to this group. Next, studies that are devoted to an entire country, such as the United Kingdom, United States, France, and Sweden, account for 28% of the publications, followed by transportation systems in cities, such as Liverpool, Lucknow, Manchester, Lyon, and Milan. Thus, 6% of the papers focus on other areas and 10% do not specify the location of their study.
3.1.5 Visualization of author keywords
The visualization map of author keywords from the English literature shows that “crime,” “safety,” “public transport,” “environment,” “fear,” and “transit” were the most frequently encountered keywords (Fig. 3a). These maps show how keywords in the papers’ titles are linked to each other and their occurrences in our sample. The maps are divided into four clusters, which show families of terms based on their co-occurrences in titles. In the density visualization (Fig. 3b) the strength of each keyword is shown in different shades. The words “crime” and “public transport” are linked to many other keywords and have many occurrences.
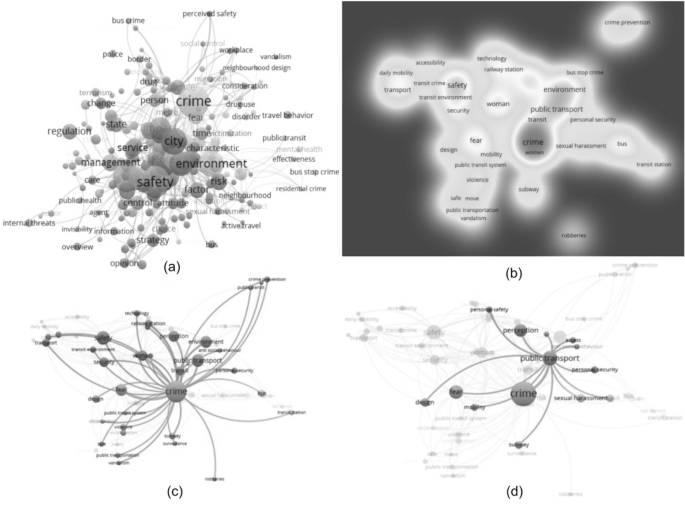
a Network visualization map of words contained in the titles of the English publications, b Density visualization map and c Network visualization map for the English selected publications (N = 188), centered in the words “crime” (c) and “public transport” (d)
Note that “crime,” “public transport,” “environment,” “fear,” “safety,” “crime prevention,” “bus,” and “women/woman” are recurrent terms in these publications; in particular, the word “crime” constitutes the major hotspot. The keywords “women/woman” signal a growing literature on sexual transit crime, a safety problem that is largely underreported (e.g. Ding et al. 2020; Solymosi and Newton 2018; Newton et al. 2020; Priya Uteng et al. 2019; Chowdhury and van Wee 2020; Jun et al. 2020; Whitzman et al. 2020; Dunckel-Graglia 2013, 2016; Natarajan 2016; Moreira and Ceccato 2020). These keywords in the titles are also represented when the network visualization map is created for the selected English publications (N = 188), centered on the words “crime” (Fig. 3c) and “public transport” (Fig. 3d). In the next section, we discuss the interconnections between these terms as research domains.
3.1.6 The nature of studies in transit environments
Based on a title search of 245 articles, we found that 81 (33%) publications were about crime, 29 (12%) were about fear and/or safety perceptions, 129 (53%) both crime and safety perceptions, 6 on other topics (2%).
Among those articles that were devoted to the analysis of crime, 70% focused on violence, 18% on property crimes with aggravated violence, such as robberies, 2% on property crimes only, and 10% on vandalism and other types of crime. Vandalism is often associated with the analysis of other crimes (either violent or property crimes), rarely studied by itself. Studies that are devoted to violent crimes, assaults of all types, such as fights and attacks, are common, followed by gendered and sexual crimes and terrorism, which are a minority. With regards to transport mode, as many as 76% (188) of the publications deal with rail-bound PT; of these, about half relate to trains and the other half the metro. About 65% are related to buses, while 8% (22) of these focus on other types of transportation, such as ride-hailing services “Tourist Vehicle with Driver” (Weber 2019) or Vikram transports in India (Tripathi et al. 2017). In other words, many publications deal with both buses and rail-bound modes.
3.1.7 The types of methods
Quantitative analyses (descriptive or confirmatory statistical analyses) are used in 63% (155) of all 245 publications, 19% (47) are qualitative publications, and 18% (43) used mixed methods. Among the quantitative analyses, the majority used descriptive statistics, such as frequency analysis of crimes and/or perceived safety, cross-tables, and different types of regression models. These publications are often in English and intend to assess the impact of traveling conditions of one or more aspects of the environment on crime and/or safety. As many as 17% (33) of these quantitative publications use regression models. Among them, half (17) were classical multivariate linear regressions and half (15) were logistic regressions (nine binomial, three multinomial, and three ordinal). Publications using Geographic Information Systems (GIS) and interstitial analyses have appeared at the end of the twentieth century and represent 12% (25 out of 198) of quantitative papers. None of them are from the French literature. These methods are useful to study certain aspects of transit safety and crime, such as socio-economic characteristics (e.g. Buckley 1996; Sung-suk 2009) and transit surroundings (e.g. Liggett et al. 2001; Newton et al. 2014b). Out of 47 qualitative publications, half were in French. These findings show the dominance of qualitative analyses in the French literature, while the English publications are denominated by more quantitative approaches. Exceptions are publications in French from Canada that follow an Anglo-Saxon tradition of taking a more quantitative approach to analyze transit safety (Grandmaison and Tremblay 1997; Ouimet and Tremblay 2001; Browne 2010). The studies based on mixed methods are varied in nature and often aim at producing results relevant for practice; see for instance Newton et al. (2004).
3.2 In-depth analysis by research domains
3.2.1 The temporal patterns of crime and perceived safety
The flow of passengers both at peak and off-peak times create the necessary conditions for crime, namely the presence of a possible motivated offender, a desirable target, and a lack of people ready to intervene if anything happens (Cohen and Felson 1979). This temporal dimension has been recognized by the international literature as key to understanding safety conditions in transit environments. Of the total publications, 22% investigate one or several dimensions of the temporal variations of crime and/or safety perceptions in transit environments. Nearly all publications refer to hourly patterns of crime and/or perceived safety, often differences between peak and off-peak hours. These “time windows” are important for transit safety conditions because crowded environments tend to attract certain types of offenses, such as pickpocketing (Zahnow and Corcoran 2019; Ceccato et al. 2015), while empty stations or bus stops tend to promote crimes that demand anonymity, such as robbery. “Appendix” Table 4 summarizes findings from these studies split into different time windows.
Studies show that morning peak hours attract robberies (Block and Davis 1996; Newton et al. 2014b), assaults, thefts, public disorder (Stringer 2007; Ceccato 2018), and sexual crimes (Ceccato and Paz 2017), while Smith (1986) finds fewer crimes in the early morning hours. Research suggests that people feel unsafe during morning rush hours, especially women (Mitra-Sarkar and Partheeban 2011), which is when sexual crimes can take place (Ceccato et al. 2011, 2017). As exemplified by Vanier and D'arbois (2018b), seven articles deal with peak hours in the mornings, a time that is both “anxiety-inducing” and criminogenic. However, almost half of the papers focusing on the nighttime describe it as the time of day when most people feel the least safe, especially women (e.g. Austin 1984; d’Arbois de Jubainville and Vanier 2017). This feeling is stronger when travelers have to wait for transportation (Chowdhury and van Wee 2020; Mahmoud and Currie 2010), or when the location is associated with a particular land use, such as being near nightclubs (Gosselin 2012). Fear may reflect the risk of different crimes. For instance, violent crimes are said to be prevalent after rush hour, after 6:00 pm (Moreira and Ceccato 2020; Newton 2014), while robberies seem to occur more often late at night than in the early evening (Block and Davis 1996; Chaiken et al. 1974; Clarke et al. 1996).
Among the publications that deal with the temporal dimension of crime or perceived safety in transit environments, 43% made a distinction between crime occurring on weekdays or on weekends. Seven of these (30%) suggest that more crimes occur on weekends (e.g. Ceccato et al. 2011,2017). The end of the week (Thursday to Saturday) witnesses increases in robbery (Newton 2018a). Finally, one article (Smith 1986) suggests that maybe there are fewer crimes during weekends in absolute numbers but, after the author compares the number of crimes with the number of travelers, crime rates are actually higher. In addition, despite the fact that Monday is posited as a low-crime day (TCRP 2001; Capasso da Silva and Rodrigues da Silva 2020), 22% of the publications suggest that most crimes happened on a weekday, especially on Wednesday (e.g. Chaiken et al. 1974; Le Grâet and Vanier 2016). There are indications that lack of surveillance and fewer patrols affect crime during weekends (Ouimet and Tremblay 2001). Also, trains are less frequent on weekends, the density of passengers decreases and waiting times increase, affecting safety perceptions (Yavuz and Welch 2010; Mahmoud and Currie 2010). Weekends tend to be perceived as unsafe, especially by women (Vanier and d’Arbois 2017). “Appendix” Table 4 summarizes the remaining time windows.
3.2.2 The influence of environment on transit safety
According to Smith and Clarke (2000) “crimes cannot be properly explained, nor effectively prevented, without a thorough understanding of the environments in which they occur. Nowhere is this more apparent than in urban public transport.” (page 169). Transit environments can be planned in a way that reduces the possibility of crime occurring, by stimulating surveillance, fostering territoriality, and reducing areas of conflict by controlling access and improving overall perceived safety. These principles are based on what is called Crime Prevention Through Environmental Design (CPTED) and on situational crime prevention theory (Clarke 1983) that, among other things, seek to enhance natural surveillance through planning and modifying the environment. CPTED asserts “that the physical environment can encourage or discourage opportunities for crime by its very design and management” (Cozens et al., 2003a, b, c). Research shows that crime and safety in transit environments depend on the physical and social environmental attributes at the transport node, either bus stops or train/subway stations, the characteristics of the immediate environment and neighborhood, and the relative position of both the station and neighborhood in the city (Loukaitou-Sideris et al. 2001; Ceccato 2013). Yet, how do the physical and the social characteristics of transit environments affect safety perceptions of PT travelers? Below we discuss the importance of the quality of transit environments, in particular, design, layout, obstacles and hiding spots that affect visibility and surveillance; maintenance and lighting conditions, CCTV cameras; the presence and flow of passengers over time, specially crowdedness, and the quality of immediate areas.
3.2.2.1 Visibility, obstacles and hiding spots
Elements of the station, such as elevators, pillars or facilities should not hinder visibility for PT users. Instead, elevators with large glass side panels should be endorsed (La Vigne 1996). Similarly, columns no wider than necessary, glassed internal walls and ticketing in one central location in the station (Felson et al. 1996) should be encouraged. In an underground station with long corridors, often with sharp corners and restricted sight lines, a solution is the establishment of corner convex mirrors that increase visibility and natural surveillance (Crime-Concern 2004; Felson et al. 1996). Moreover, it is important to ensure visibility from any point in a station (Umaña-Barrios and Gil 2017; Mohamed and Stanek 2020); high-domed and/or white ceilings in the station are encouraged (e.g.: Felson et al. 1996; Sham et al. 2013) as is avoiding spiral ramps (Atkins 1990). Moreover, the design of bus stops is important. Transparent bus shelters are recommended by seven articles (27%) focusing on buses and bus stops. They insist on the avoidance of enclosed brick shelters; indeed, the lack of visibility is an opportunity for offenders to commit crimes (Noble 2015a; Sham et al. 2013). Moreover, curved shelter structures can be a solution that gives the feeling of an open and secure space for users (Diec et al. 2010). Finally, bus stops should be located in front of a place that provides natural visibility (Liggett et al. 2001). Regarding the interior of the buses, large, transparent windows are encouraged, while dark-tinted windows reduce visibility from the outside during daylight and should be avoided (Levine and Wachs 1985). Thus, the same article suggests that seats in the back could be arranged in a circular pattern to allow better visibility between passengers and to cut down on pickpockets. Overall, the internal design of the bus should maximize clear sight lines and visibility for both driver and passengers (Sham et al. 2013).
The external and internal design of the stations are essential elements that can promote visibility and opportunities for surveillance. Uittenbogaard (2015) suggests that visibility as the possibilities (promoted by the environment) a person has for observing others or situations while surveillance, in contrast, relates to the possibilities for others to observe a person, an object or a place. It can also be carried out by CCTV cameras or involving a diverse array of agents in a train station, for example: from police, security guards, safety hosts to drivers, shop owners, passengers and residents. More recently, with the wide use of cameras in mobile phones, ‘surveillance’ (‘eye-in-the-sky’ watching from above) gives room to the process of ‘sousveillance’ which denotes bringing the camera or other means of observation down to a human level (Ceccato 2019).
Impaired visibility is clearly associated with fear of crime (e.g.: Cozens et al. 2003b,2004; Ceccato and Paz 2017). Having control of where others are, the capacity to see and be seen by others, increases the confidence of travelers (Umaña-Barrios and Gil 2017). When passengers feel isolated, they feel themselves becoming an easy target for criminals (Noble 2015b; Buckley 1996). Research shows that underpass platforms are often related to higher rates of disorder and crime (e.g. Ceccato 2013a; Loukaitou-Sideris et al. 2002). However, the literature shows unexpected findings when vandalism is often associated with increased visibility, perhaps because it reflects the size of passenger flows (Ceccato and Uittenbogaard 2013). Ten articles (45%) raise the question of visibility inside stations. These focus on the importance of a wide-open design, which straightening sight lines provides, and avoiding obscured areas, corners, hiding spots, and enclosed spaces (e.g. CEMT 2003; Ceccato et al. 2011). In addition, plants should not become obstacles and impede the field of view (Mohamed and Stanek 2020; Crime-Concern 2004; Diec et al. 2010).
3.2.2.2 Management and maintenance
Mechanisms linking poor management and maintenance of transit environments to crime and poor safety perceptions have long been associated with Wilson and Kelling’s broken window syndrome (Wilson and Kelling 1982), which suggests that unrepaired damage to property encourages further vandalism and other types of crime. We argue that poor management and maintenance of transit environments indicate other types of underlying problems that can have a direct effect on safety perceptions and also lead to victimization (see also Eck 2019). The effect of poor management and maintenance is well documented in the international literature. It may reflect poor cleaning practices in and around transit nodes (e.g. Liggett et al. 2001; Ceccato and Masci 2017; Loukaitou-Sideris 2012) or poor lighting conditions, as further discussed below.
3.2.2.3 Lighting
The effect of illumination (either artificial or sunlight) is documented in the international literature on transit environments with 71 publications out of 245 publications: 60 in English and 11 in French. From 245 articles, 27 publications deal directly with the effect of illumination of bus stops and/or stations. Out of these publications, 17% deal with the effect of illumination on crime, 76% on perceived safety, and 7% on both. For example, according to La Vigne (1996) suggested that stations well-lit and well-maintained contribute to the overall feeling of safety among Metro users in Washington, DC. Overall, lighting seems to have a reductive effect on crime: as many as 66% of publications that focus on crime state that good illumination decreases crime, while 11% have found that lighting can increase crime or fear in certain conditions (e.g. a Canadian study shows that good lighting should extend from the bus stops to the adjacent streets so that bus stops avoid the passengers to be exposed to the ‘fishbowl effect’ (Women’s Centre/METRAC 1991). As many as 14% have found inconclusive results in the sense that lighting can increase or decrease crime, and 9% found that illumination shows no significant effect on crime. For a summary of these findings on safety perceptions, see Appendix Table 5.
3.2.2.4 Crowdedness
The literature lacks quantitative reference for what would be a ‘crowded’ station (Appendix Table 6). Evidence shows that nearly empty transit environments (e.g. platforms, stations, bus stops) increase certain types of crimes in western countries, such as exhibitionism and sexual assaults (e.g. Beller et al. 1980; Colard 2018; Mohamed and Stanek 2020), but also robberies (Clarke et al. 1996), social disorder (Ceccato et al. 2011), and violent assaults (Noble 2015b). These findings show that the absence of informal surveillance motivates offenders to consider crime as an alternative. People are worried about empty transit places, especially women (Vanier and d’Arbois 2017), perhaps because, as suggested by Ball and Wesson (2017), unwanted sexual behavior is perceived to be more severe in empty transit environments.
However, crowdedness also has an impact on transit safety. Some studies show an increase in fights, insults, and pickpocketing in crowded transit environments (Ceccato et al. 2015b; Noble 2015b). Pickpocketing in particular occurs at overcrowded spots at which offenders can take advantage of a high density of people who are close together (Loukaitou-Sideris et al. 2001; Ceccato et al. 2015). Research shows that these conditions are affected by the transit environment, for instance, Solymosi et al. (2015) refer to a pedestrian motion analysis that found that in crowded environments safety problems occur due to bottlenecks, which are areas in which there is a significant capacity drop in pedestrian movement, such as a narrow doorway in a corridor, when jamming occurs when the incoming flow exceeds the capacity of the bottleneck. Other studies found a diminution of overall crime under crowded circumstances (e.g. violence, and vandalism) or just inconclusive results (Marteache et al. 2015; Ceccato et al. 2011).
In very crowded transit environments, sexual harassment and especially groping are recurrent problems since they are observed in 54% (6) of the 11 selected publications. Crowdedness in transit environments facilitates women’s sexual harassment (Beller et al. 1980; Alessandrin et al. 2016; Colard 2018), and unwanted sexual behavior appears to be more ambiguous for men (Ball and Wesson 2017). Poor safety conditions in crowded places impact women’s behavior and force them either to avoid crowded transportation (Mitra-Sarkar and Partheeban 2011) or to use women-only carriages (Bachok et al. 2014; Horii and Burgess 2012; Dunckel-Graglia 2013) in India, Malaysia, and Japan. In South America, Kash (2019) found that even if women experience high stress in crowded transports, they have no choice but to commute in them. However, Gaylord and Galljher (1991) found that crowdedness decreases crime in the Hong Kong transit system.
3.2.3 The technology and safety in transit environments
From 245 articles, 18 (7%) directly deal with some aspect of transport technology and how it has influenced safety. Only six publications are quantitative. Most articles fall within the spectrum of Information Communication Technology (ICT), access control systems, smartphone apps, emergency alarms, crime-resistant materials, ITM machines, RTI, apps, and social media. As a target of crime, mobile phones are said to be the first target by theft offender in transit environments in the United Kingdom and the United States (Newton 2016, 2018a; Newton et al. 2014a; Gentry 2015). They may also facilitate certain types of transit crimes, such as cyber-theft, thanks to Wi-Fi or cyber-harassment (Newton 2016). On the other hand, technological innovations might decrease transit crime and enhance perceptions of safety. For instance, researchers found that emergency alarms and ICT are efficient in preventing and controlling crime (Debrincat et al. 2017; Shen 1997). The use of big data analysis in PT is a growing research area; for instance, a recent study shows how passengers’ routine mobility patterns can be analyzed using information from subway travel cards and how pickpocketing suspects can be detected by matching abnormal cardholder trajectories and occurred crime locations (Gu et al. 2019).
To prevent vandalism, the use of new resistant materials has been suggested by previous research (La Vigne 1997; Shen 1997), while some access control systems and exact fare transaction machines may decrease fare evasion to the detriment of perceived safety (Weidner 1996; La Vigne 1997). More recent technologies such as safety apps (McCarthy et al. 2016; Debrincat et al. 2017) and real-time information (RTI) (Abenoza et al. 2018; Newton 2016) increase safety perceptions at transport nodes. However, technologies used to prevent the occurrence of crime may not be efficient everywhere in transit environments (Shen 1997; Swain 2015) and has to be adapted to different types of users. For instance, Sochor (2012a) presents the use of ICT to enhance mobility in a case of a navigation system for visually impaired users in Sweden [see also (Sochor 2012b)]. Modern analytical tools and visualization software, such as Geographical Information Systems (GIS), free of charge software, and virtual reality (VR) have the potential to improve communication when implementing safety intervention, in particular between practitioners, researchers, and/or PT users and to create a better basis for improving transit safety (Cozens and Hillier 2002; Cozens et al. 2003a, c; Newton 2007; Smith et al. 2013; Ceccato et al. 2015). Finally, big data and social media provide useful data for the analysis of passenger flow and safety (Marteache et al. 2015; Casas and Delmelle 2017; Zahnow and Corcoran 2019). For more in-depth discussion of the effects of technology on transit safety, see the next section.
3.2.3.1 CCTVs in transit environments and BWCs
Closed-circuit television (CCTV) is associated with a modest but significant decrease in crime, particularly property crime, vehicle crime, and drug crime in public places in general (Piza et al. 2019).We found 30 publications (12%) focusing on CCTV. Findings show conflicting evidence. CCTVs can reduce the risk of violence in metro stations in Sao Paulo, Brazil (Moreira and Ceccato 2020) and car crimes, such as breaking into cars in parking lots in the United Kingdom (Tilley 1993; Webb and Laycock 1992). They are also depicted as being efficient in increasing perceived safety in several studies (Cozens et al. 2003b; Debrincat et al. 2017). On the other hand, CCTV impact on crime reduction and/ perceived safety was not evident in transit systems in Sweden or in the United States (e.g. Priks 2009; Shellow et al. 1974). The reason is most likely that, most of the time, CCTV cameras are installed together with other interventions, making it difficult to know which intervention influenced the outcome (Tilley 1993). Other studies show no significant impact on safety, such as in Los Angeles (Loukaitou-Sideris and Fink 2008), mostly when they are implemented alone, with no other intervention (Ceccato 2013a; Newton and Bowers 2007).
Women are the most skeptical about CCTV (e.g. Vanier and D'arbois 2018a; Yavuz and Welch 2010). Indeed, CCTV may be seen as an intrusion of privacy (Ceccato 2013a) or even voyeurism (Smith and Clarke 2000). Yet, studies claim that when they are visible, CCTV may enhance perceived safety (Ceccato 2013a; Riley and Dean 1985). They claim that the preventive effect of a camera is greater if it is positioned in a visible place (e.g. Mariotte et al. 2004; Burrows 1980). In addition, publicity and communication around the installation of these devices may help users to feel safer and may have discouraged potential criminals (e.g. Richards 1980; Tilley 1993). People cannot feel safer if they do not know that the cameras exist (Vanier and D'arbois 2018a). It is interesting to note that CCTV may have a greater positive impact on older adults’ perceived safety than on other riders’ (Wallace et al. 1999).
The way CCTV is implemented is important. Grandmaison and Tremblay (1997) suggest that to improve the effect of CCTV, the systems must be “credible”, meaning that the products of the system must have good resolution, agents must be trained to use this tool, and specific objectives should be identified (Mariotte 2004). If someone is monitoring the live feed, CCTV can be useful to find the criminals or suspects, especially if the camera’s sight field is continuous, in a tight mesh (Malochet and Le Goff 2013). In addition, the effectiveness of CCTV depends on the situation (Riley and Dean 1985), for instance, on how much potential criminals fear the system and see in it an increased risk of getting caught (Webb and Laycock 1992). Scholars have claimed that the effectiveness of CCTV as a deterrent of crime has to do to some extent with its novelty in a station, even if the cameras are “fake” (Burrows 1980). Cameras with face-recognition software might be used in the future (Nourani et al. 2020) to the detriment of personal privacy.
Another technological development is the use of Body Worn Cameras (BWC). These systems seem to generate fewer use-of-force reports and complaints from citizens, yet there is little research as yet in the use of BWC in transit environments. In one of the few studies in transit systems, Ariel et al. (2019) indicate that BWC reduce assaults on staff members unequipped, yet working close to equipped colleagues and the cameras also provide train operating company staff with an effective protection that reduces physical aggression toward them.
3.2.4 Location and surrounding areas
A transportation node, such as a train station, is often planned to facilitate the movement of as many passengers as possible. It tends to be within walking distance of a residential area, working place, industrial area, or commercial center. This centrality feature of transportation nodes has criminogenic implications. Different types of land use affect the social interactions at those places and, consequently, their geographies of crime (Ceccato 2018). The literature also indicates that transport nodes can become crime attractors, crime generators, crime absorbers, or crime radiators (Brantingham and Brantingham 1995; Bowers 2014; Sedelmaier 2003; Newton 2018) partially because they contain or are close to risky facilities. Clarke and Eck (2007) suggest that certain facilities can be called risky and affect crime occurrence at their locations as well as within their vicinities. Examples of risky facilities are bars, restaurants, stores, shopping malls, ATMs, bus stops, railway stations, parking lots, apartment buildings, mobile home parks, libraries, hospitals, schools, public swimming pools, and marinas. Adams et al. (2015) suggest that these different land uses interact to form what they call “malignant mixes” because individually or in combination, they engender a greater risk of crime and according to La Vigne (2015) should be approached by crime prevention initiatives in a different way. These areas are important because they embody the safety needs of travelers along the trip from home to the closest transport node and vice-versa (what is also called the safety in the “last mile.”).What makes these areas unsafe?
The location of transport nodes in cities also has an independent impact on crime levels and geography (Newton et al. 2014a; Phillips and Sandler 2015; Liggett et al. 2003). While Newton et al. (2014b) found that terminal stations were at lower risk, Marteache et al. (2015) showed that central stations and one terminal station are more criminogenic than others. Ceccato et al. (2011) found more crime happens in inner city areas (where the central station is located) but also in the so-called “end stations.” On the other hand, Ihlanfeldt (2003) found no evidence that transit in suburbs increases crime. The size of transport nodes may also matter for the safety of passengers. For instance, Marteache (2018) found that smaller airports experience higher theft rates than larger ones, while Ceccato et al. (2011) suggested that larger subway stations attract more crime, controlling for station and neighborhood contexts. More interestingly, there seem to be gender differences in victimization by station location. Moreira and Ceccato (2020) found that women are at higher risk of victimization than men in central metro stations, while men run a higher risk of violence at end stations—both notably during late-night periods. Some suggest that it is the surrounding contexts that affect crime and/or the perceived safety of riders. While Abenoza et al. (2018) showed that mixed land use tends to increase perceived safety of users at night, two other studies found that liquor stores, bars, and pawnshops near transit increased robberies (Liggett et al. 2001; Sung-suk 2009). They also found that transport nodes near vacant lots had higher property crime rates. It appears that the direct surroundings of transport nodes have great influence on transit crime (Buckley 1996), but also the other way around, namely research suggests that crime concentrates in close proximity to public bus stop locations. Hart and Miethe (2014) noted that robberies around bus stops occur when specific combinations of risk factors are present, and Gerell (2018) found that for violent victimization the risk was highest in local centers of disadvantaged neighborhoods having low collective efficacy, but such a risk was dependent on temporal and city contexts.
Out of 245 publications, 15% (36) deal with the safety conditions around transportation nodes. Evidence of transport nodes functioning as crime absorbers is found in the literature (Pearlstein and Wachs 1982; Newton 2008). Scholars have found crime on bus routes mostly associated with high crime neighborhoods. Similarly, Loukaitou-Sideris et al. (2002) suggest that crimes at subway stations are related to overall crime in the neighborhood, as a crime absorber. There are also examples of transportation nodes that radiate crime. Several studies showed that transit environments seem to radiate crime to their surroundings (Block and Davis 1996; Buckley 1996; Kooi 2013; Piza and Kennedy 2003; Liu et al. 2020; Poister 1996). In addition, Spicer and Song (2017) demonstrated how the perception of crime increased and intensified over 10 years: as a public transit hub grew in size and ridership, crime increased and became more concentrated. Transit nodes might have a positive effect on safety. For instance, Billings et al. (2011) found that the opening of a transit line led to a decrease of property crimes. It seems that the link between transit systems and crime is dependent on multiple factors (Ihlanfeldt 2003). For instance, Sedelmaier (2003) found that a new small transit system had not generated more crime than usual, and this was confirmed by Sedelmaier (2014). Liu et al. (2017) found that only the bus stops with high capacities attracted property crimes. More recently, Gómez et al. (2020) suggested that the development of major highways benefitted mobility in a metropolitan area but compromised the sustainability of particular places and called for a more holistic approach when assessing the effects of transit nodes on urban environments.
3.2.5 Safety perceptions by types of user
Victimization and safety perceptions are often influenced by gender and other individual characteristics (Whitzman 2007; Madan and Nalla 2015), but it is the intersection of some individual and contextual characteristics that determines an individual’s vulnerability to crime and fear of crime (Crenshaw 1989). For instance, scholars have indicated that previous victimization continues to be an important determinant of perceived safety in public places (Otis 2007; Hirtenlehner and Farrall 2014; Yates and Ceccato 2020; Hale 1996). The risk of victimization is expected to vary across types of individuals (age, gender, (dis)ability, LGBTQI status, IT literacy, previous victimization, frequency of use of public transportation, length of trip, etc.) (Gekoski et al. 2015).
The level of service appears to be linked to people’s perceptions of safety. Indeed, a high frequency of service—especially at late hours- increases perceived safety and consequently, people rely more on public transportation when they feel safe (e.g. Reed et al. 2000). The gender dimension is the one that is by far the most studied in transit safety studies. Not only PT passengers but also transit personnel express a variety of safety perceptions (Browne 2010); some personnel refrain from coming to work because of previous experience with crime (Bradet and Normandeau 1987).
From our analysis, 40% of the publications (100) deal with the issue of perceived safety by type of user. Among them, 72 publications focus on women’s safety perceptions. Women feel less safe than men while transiting (e.g.: Cozens et al. 2003b; Levine and Wachs 1986); some researchers argue that women feel three times less safe than men (Wilow 2015) and express greater precautionary behavior than men (Ingalls et al. 1994; Newton et al. 2020; Ceccato and Nalla 2020). Women are far from being a uniform group of passengers. Vanier and d’Arbois (2017) distinguished four types of female PT users: daily workers (63% of whom feel unsafe), young women (66% of whom feel unsafe), inactive women (who feel the safest) and casual users (the most unsafe, 70% of them do not feel safe). Safety perceptions are affected by whether or not women are alone (Ceccato et al. 2017; Crime-Concern 2004). Worldwide, women are often “transit captives” (Yu and Smith 2014; Ceccato 2017a, b; Guimarães et al. 2019), which means they do not have any other choice of transport than PT. It is also this group who is overrepresented among those who feel unsafe (D'Arbois 2019; Vanier and D'arbois 2018a), compared to non-captives. Gender status is another determinant of perceived transit safety. LGBTI + (and especially ethnic minorities) feel particularly unsafe and fear the reactions of other PT users (Lubitow et al. 2020; Nourani et al. 2020), as do disabled people, who declare that their transit safety needs are not entirely satisfied (e.g. Currie et al. 2013; Barjonet et al. 2011; Jun et al. 2020; Iudici 2015; Iudici et al. 2017).
The ages of users also influence the declared transit safety. Young people’s safety seems not to be a priority (but see e.g. Wiebe et al. 2014; Mahmoud and Currie 2010; Currie et al. 2013). Young people, especially women, are often said to feel particularly unsafe while in transit, especially those who fear sexual harassment and violence (e.g. Natarajan et al. 2017; Nourani et al. 2020; Gekoski et al. 2015; Wiebe et al. 2014). Interestingly, the elderly feel less safe in transit environments than the rest of the population (e.g.Loukaitou-Sideris 2009; Bon et al. 2009) even if they have never previously been victimized (Bradet and Normandeau 1987), perhaps because, as suggested by Delbosc and Currie (2012), age and gender have an indirect effect on safety.
Another characteristic that influences users’ transit safety is the neighborhood context in which they are exposed along the trip. The relationship between surrounding land uses and crime incidents at stations tends to be statistically significant, as certain environmental features either attract offenders (i.e. offer good opportunities) or influence criminal activities by concentrating potential offenders and encouraging anti-social behavior (Loukaitou-sideris 1999). Poor perceived safety may reflect more than crime. Evidence from the United States shows that ethnic minorities are more likely to declare they feel unsafe when using public transport, in particular Asians, who show more safety concerns than members of other ethnic groups (e.g.Buckley 1996; Loukaitou-Sideris and Eck 2007). In addition, travelers from poor neighborhoods have higher levels of fear of crime and property damage in public environments (e.g. Loukaitou-Sideris 2006; Vilalta 2011). Finally, despite these relationships, keep in mind that social groups are not uniform or stereotypical and that every user is different from another (Loukaitou-Sideris and Fink 2008). Hong and Chen (2014) suggest that residents in safe and high-density areas are more likely to walk and that the built environment is significantly related to walking behavior as well as people’s perception of safety.
3.2.6 Safety door-to-door: the whole journey approach
When we refer to transit safety, the journey not only involves the bus ride or the trip by train; it includes safety throughout the whole trip, from door to door (e.g. Ceccato and Newton 2015), for instance, safety in the environments to which an individual is exposed when walking to the bus stop, waiting for the bus to come, inside the carriage on the trip, changing transportation modes, arriving at a destination, and returning back home. Empirical studies are now being informed by this “whole journey approach” dealing with victimization and safety perceptions. Kim et al. (2007) analyzed factors that influence the mode choice for trips between home and light rail stations and found that the risk of crime made women more likely to be picked up and dropped off at the station, especially when it was dark. Recent research shows that the perceived “walk accessibility” of metro stations was found to be highly influenced by micro-aspects of the landscape, such as streetlights, police patrols, and traffic signs and signals (Bivina et al. 2019, 2020). There are a number of studies that deal with barriers that disrupt mobility, such as gated communities (e.g. Smit et al. 2015; Landman 2012). In a study by Cao and Duncan (2019), they show that park-and-riders are willing to walk longer if they experience safer intersections, better pedestrian infrastructure, and an attractive building appearance. Other studies that focused on youth safety, in particular women’s safety, showed different degrees of perceived safety along the trip and by transportation mode (see e.g. Ceccato and Loukaitou-Sideris 2020; Evans 2009; Natarajan et al. 2017).
3.2.7 Strategies and interventions in transit safety
Ensuring transit safety is not a task for a single stakeholder. There is a range of actors that are supposed to share the responsibility of dealing with safety problems together with the major actors in public safety. Recent research recognizes that safety depends on the coordinated cooperation of transportation service providers, safety experts (security guards, security hosts), municipalities, the private sector, and NGOs (e.g. Levin 2015; Uittenbogaard and Ceccato 2014). Despite the rapid proliferation of these constellations, few efforts have been made to determine their effectiveness in reducing either crime or its related fear in transit environments. Out of the 245 publications, 167 publications deal with interventions or make suggestions for better preventing crime and/or improving safety perceptions. Some of these interventions have their effectiveness tested, while the great majority of authors state them as potential solutions for the pressing safety problems dealt with in their studies. These recommendations can be split into five types: design of transport nodes, policy/cooperation, campaigns/education, data/knowledge, and technology (Table 2). Note that our initial intention was to split these interventions into two categories, against crime and for safety perceptions, but this was not possible for two reasons. First, many interventions belonged to a program or package with multiple interventions. Second, there was an overlap of the intention to prevent crime and, at the same time, improve safety perceptions of PT users. Table 2 also lists examples of the most important recommendations.
As much as 26% of the publications suggested improving the knowledge base by building up better data and knowledge. These involve better statistics, codes, surveys, and consultations with groups of users (e.g. d’Arbois de Jubainville and Vanier 2017; Smith 2008; Riley and Dean 1985). Because many of these problems go beyond the transport nodes, also involving the surrounding areas, establishing a better cooperation between public and private actors (e.g. multi-agency police cooperation) is pointed out in 26% of these studies (e.g. Church et al. 2000; Ceccato et al. 2020; Kenney 1986). Other policy changes include female police forces, more patrols, increased supply of public transportation/schedule, women-only carriages/spaces, and stop on demand, as exemplified by Chantal (2011), Gilbert and Schultz (1996), or Horii and Burgess (2012).
Recommendations emphasize that safety is a serious problem often linked to the environment of bus stops and train and subway stations as well as their design. As many as 19% of publications mention crime prevention through environmental design (CPTED), which is largely based on the principles of situational crime prevention and seeks to enhance natural surveillance by modifying the transit environment (e.g. Noble 2015a; La Vigne 1996). They suggest improvement of lighting, enhanced visibility and surveillance via design through mirrors and transparent shelters, and also improving maintenance and changes in the internal land use of these transport nodes. Additional ideas include, for instance, adjustable sizes for carriages and platforms to fit passenger density (e.g. Vanier and d’Arbois 2017; Shellow et al. 1974), and lighting, because 11 articles agree that sufficient lighting increases the perceived safety but that the fishbowl effect must be taken into account (e.g. Nordfjærn et al. 2014; Reed et al. 2000). Eight articles claim that visibility should be enhanced by promoting transparent materials, mirrors, a minimum of blind spots, and high arched ceilings (e.g. Mohamed and Stanek 2020; Cozens et al. 2004). Finally, 19 articles suggest improvements in the environment, such as locating bus stops far from alcohol retailers and high crime streets (Levine and Wachs 1986; Liggett et al. 2001) Re-plan vegetation, because such cover increases the fear of assault and robbery for women (Cozens et al. 2003b; Rišová and Madajová 2020). Other suggestions are focusing on facilities, claiming that if there are no tables, bathrooms, benches, people do not have the opportunity to loiter in the public space, affecting safety positively (e.g. Gaylord and Galljher 1991; Turner 2012). Authors also suggest putting more emergency buttons and alarms in transit environments (Debrincat et al. 2017; Mahmoud and Currie 2010) to facilitate reporting. However, there is some controversy about implementing women-only solutions to tackle sexual crime in transit environments (Shibata 2020; Dunckel-Graglia 2013).
Although the need for campaigns, education, and information was highlighted by 19% of the publications, limited evidence exists to evaluate their effectiveness. Studies often suggest educational programs, information, media, and awareness campaigns to communicate the level of risk and to sensitize users to the important issues in transit environments (e.g. Loukaitou-Sideris 2006; Marteache et al. 2015), with particular emphasis on sexual violence (Ceccato and Paz 2017; HCEEFH 2015). They insist that these campaigns should focus on changing people’s perceptions of other users’ attitudes and not the image of the public transport itself (Fyhri and Backer-Grøndahl 2012; Currie et al. 2013) or the role of bystanders (Orozco-Fontalvo et al. 2019; Lubitow et al. 2020). Levin (2015) mentions the need of developing work on gender mainstreaming and gender impact assessment in transport planning, and in particular more interdisciplinary research as a basis for an increased cooperation between different types of professionals. There are suggestions that focus on agents’ training (e.g. CEMT 2003; SRI - Stanford Research Institute 1970) and on the promotion of safety and security policies, reminders that the station is under surveillance (Richards 1980; Mariotte et al. 2004). Finally, 10% of recommendations involve security technology solutions, from CCTV and telephone hotlines, to RTI and newer technologies, such as online platforms and smartphone apps, for example, to encourage people to report transit crimes (e.g. Lea et al. 2017). As some of these technologies may have the potential to follow riders door-to-door, ICT technologies can be a useful tool to promote safety along the whole journey. Concerns with staff safety have been globally recognized across professions, and transit staff members are no exception. BWC are assumed to have a “calming effect” on personnel and reduce crime in rail-bound transit (Ariel et al. 2019).
4 Conclusion
This article reviewed and analyzed a growing literature on transit safety. We carried out this review covering five decades of studies from 1970 to 2020 written in English primarily, but extending also to the French literature as a benchmark.
Although records of research on transit safety are found in the early 1970s and 1980s, this field of knowledge truly took off in the mid-1990s with simultaneous efforts from disciplines such as Criminology/Psychology and Urban planning/Architecture, especially with efforts by scholars in the United States. Transit safety as a research field steadily developed, to peak after the 2010s, covering a variety of subjects. However, a shift in focus has been noticed, from research on crime and victimization at bus stops and train stations, to the perceived safety of PT users (and to a lesser extent of personnel), focusing on gender and the intersectionality of safety and particular groups. More recently, transportation and ICT are also becoming a distinct field of research. Following different theoretical traditions, transit safety is nowadays an interdisciplinary field of research and is executed by a mixture of sociologists, criminologists, safety experts, architects, urban planners, psychologists, economists, geographers, engineers, computer scientists, and others. The body of research is dominated by the English literature (mostly from large cities, often more “quantitative pieces” using situational crime prevention approaches), with a particular focus on rail-bound environments. While the English-language literature is focused more on the relationship between crime and features of transit environments, the French literature has more of a qualitative nature. French studies adopt a more sociological approach, focusing on individuals’ perspectives on safety (mostly on sexual crimes) as well as the governance of transit safety, in particular the relationship of public and private sectors in delivering transportation/safety services.
A research domain that is recurrent is the one devoted to the transit environment at micro-scale, for example, links between bus stop features and crime. Research over the five decades shows definitive links between the type and quality of lighting and crime and/or perceived safety. Physical features, obstacles, and transparency are all elements associated with passengers’ opportunities to exercise guardianship in transit environments. It is important to notice, however, that targeting the microenvironments of crime (e.g. Ding et al. 2020; Cozens et al. 2005), may not be enough to adequately address issues of transit safety. Findings from research clearly show that the quality of the social environment, both in the transit nodes and surrounding areas (also their location in the urban environment, i.e. center-periphery), have an impact together on levels of crime and fear of crime experienced by PT users (Smith and Cornish 2006). The literature review shows many examples of a multi-pronged approach to tackle these safety problems in transit environments.
Many studies are devoted to the understanding of how passenger flow affects temporal variations in crime and/or perceived safety, because transit nodes, such as bus stops and train stations, vary in the amount of people they concentrate. Thus, it is expected that crime and safety perceptions would also vary over time. However, drawing conclusions from the results in temporal patterns of crime is not an easy task, because findings vary by crime type, hour of the day, day of the week, as well as seasonally—and, not least, in relation to their urban and country contexts. It is worth pointing out that many of the current studies lack data to directly capture the flow of passenger numbers, which means they often rely on proxy measures. Despite a relatively large body of literature we lack a strong empirical evidence base that demonstrates the association between more passengers and more crime. Crowdedness at peak hours tends to facilitate violence, sexual crimes, and pickpocketing. Desolated transit spaces may trigger feelings of insecurity and perhaps create the necessary conditions for crimes that demand anonymity, such as robbery and rape.
Overall, more than half of the publications are devoted to the study of both crime and safety perceptions, followed by publications about crime in transit environments. The remaining studies are about safety perceptions or other topics, such as safety interventions. We identify five common research domains, some with overlapping features.
-
1.
The relationship between transit environments (type, size, design, social environment) and a wide variety of crimes (assault, rape, robbery, pickpocketing, vandalism, terrorism). Issues of context are also considered here, as well as how to tackle safety problems. Environmental criminology theories (e.g. situational crime prevention, CPTED and routine activity) often provide the theoretical bases for these studies.
-
2.
Safety perceptions of PT users with a recent clear dominance of women’s transit safety though covering a wide group of riders, including “transit captives.” Fear of crime, overall anxieties related to surveillance, and, more recently, the “whole journey approach” characterize studies working with surveys and a more individualized, psychological perspective.
-
3.
Temporal aspects of crime and perceived safety—These studies attempt to identify the relationship between passenger flow and safety over time, in particular peak and off-peak hours, seasonal variations, and between weekdays and weekends/holidays/special events. Some identify the potential effects of transport nodes in a neighborhood.
-
4.
Technology and safety—These studies follow the evaluation of a wide range of products and systems, some not necessarily related to safety, from CCTV cameras to smart cards (e.g. electronic ticketing), real-time information (RTI) systems, body-worn cameras (BWC), and safety apps. This domain also includes “technology” as a crime target, such as mobile phones.
-
5.
Management practices and crime and safety interventions—These studies covered the effects of interventions, roles of stakeholders, types of cooperation, legal systems, campaigns, and overall performance of crime prevention practices. It is difficult to draw conclusions on specific measures, as “what works” is often dependent on the types of safety problems as well as transportation modes and contexts.
Caution should be exercised when conclusions are drawn from findings. Our search of the literature was limited to the set of keywords (see “Appendix” Table 3) reflecting the concept of crime and disorder but also the ones related to fear and other overall anxieties. There is a chance that publications on terrorism and minor events, such as fare evasion, may not be captured by the search. Other words that turned out to be relevant during the execution of the study were not part of the initial pool of keywords and may have been misrepresented in the sample of publications, an example was ‘personal security’ or ‘personal safety’. In addition, there is a risk of bias using a combination of systematic search of the English literature (from Scopus and Science direct) complemented by a list of studies provided by expert members of a user list (TCR-network) specialized in the topic. However, we believe that the benefits of having a list of studies from this group of expertise outweigh the risk of bias. In addition, the French literature was mostly collected using Google scholar. Moreover, conclusions are drawn here based on hundreds of publications, but it is important to remember that these publications are more likely to show positive “expected” results than results that are uncertain, negative, or “unexpected.” It is therefore a difficult task to estimate how many studies had negative or unexpected results and were not published, which means it is virtually impossible to estimate the “dark figure” of unpublished materials. Finally, the studies used different methods, which makes it difficult to compare findings. Various studies showed, for instance, that the effect of transit environments on safety was dependent on crime types, levels, and contexts, but it is unclear to what extent these differences might be merely an artefact of the types of employed methods.
Despite the limitations, a literature review of this type can be helpful for researchers, as it provides an up-to-date structured review of the relevant research domains in public transit safety. The review itself “adds value” (Wee and Banister 2016), because research gaps have been revealed, it is hoped, functioning as guidance for researchers who plan to do research in this area. A systematic international review of topics of this type can inform practitioners about the most common safety transit problems as well as the types of interventions that have been implemented around the world.
5 Recommendations
Our review of the literature points to several areas where more research is needed on the topic of crime and safety in transit environments, so we conclude this article with recommendations for further research and policy in specific areas.
First, we need to recognize that the literature is quite definitive about the complexity of transit environments and their impact on safety. Our findings show that it is not possible to find a single “physical (or social) characteristic of these environments” that, if tackled, will solve a safety problem. There is no doubt that transit safety demands a situational and dynamic perspective that is framed to the different stages of the trip at micro-level—the bus stop, the station, within the station, and so on—and at particular times. Conditions at any time will affect PT riders, environments, and contexts in different ways, against different types of problems—this is essential to the quality of both research and policy in the future. Another important area for future research is the testing of rigorous longitudinal methodologies that can provide assessments over time and be applied in contexts other than those that were initially tested. In addition, a minority of studies dealt with acts of terrorism in transit environments—an area of research that deserves more attention in the future. In particular for the French literature, more research that would inform planners and transit operators about the importance of understanding the relationship between crime and transit environments is desirable. Data permitting, a more quantitative take on this subject by French researchers would allow a generalization of the results in other contexts.
Second, safety conditions in transport nodes are not the same as the ones experienced or perceived on the way to them. Additionally, if policies are to be tailored to attend to the safety needs of those who declare they are most in fear, “fixing” the problem of victimization does not solve issues related to poor perceived safety. This distinction between crime and safety perception remains, yet it is still treated as unproblematic in transit environment research. Despite a growing literature on women’s safety (Ding et al. 2020; Gekoski et al. 2015; Kunieda and Gauthier 2007; Law 1999; Kirchhoff et al. 2007; Keane 1998), there is still a lack of research on the practical implementation of programs tackling the safety needs of vulnerable groups of PT users (e.g. disabled individuals, elderly, LBQTI status) or, if they exist, they disregard an intersectional perspective. In addition, more research is needed in a variety of areas that include the implications of excessive concern for safety expressed by vulnerable groups, the costs of “women’s safety work” in different country contexts, the normalization of inappropriate behaviors while in transit as well as an in-depth characterization of victims’ agency. There is also the need to further investigate the role of bystanders in PT environments and beyond (applying a “whole journey approach” to safety), and precautionary measures and their long-term impact on life opportunities for transit captives, particularly in contexts where the supply of public transportation is limited, for other suggestions see Ding et al. (2020). For policy, it is essential that personnel recruitment in transit systems aims at reducing safety inequalities among PT rider groups. Mobility and safety are essential qualities of sustainable cities. Yet, women around the world declare being victims of sexual harassment on a daily basis. Therefore, tailored education programs for university students in Architecture, Engineering, Urban Planning, Transport Sciences—to name a few—are essential to sensitize new generations to the omnipresent problem of unequal transit safety and to make them aware of possible ways to combat it.
Third, the quality of the cooperation between actors (transport operators, police, municipalities, crime prevention councils, NGOs, and private citizens) in tackling transit safety is worth investigation. The role of municipalities is fundamental, because they are responsible for day-to-day spatial planning decisions, ranging from designing a new residential area or subway station, to placing and maintaining physical infrastructure (e.g. streets and sidewalks)—all of high relevance for individuals’ safety and accessibility to public transportation. Safety and mobility with a “whole journey approach” require understanding the barriers of governance that lead to poor cooperation between actors within and across sectors and organizational scales. It is often unclear who is in charge of the safety conditions in the immediate vicinities of transportation nodes or in environments that are privately owned but are public, such as a station. The safety of PT travelers is compromised when the assignment of tasks between these stakeholders is unclear, creating a gray zone in which few actors are willing to take charge of problems or share costs beyond their predefined roles. This demands more than quick fixes to the physical environment at transportation nodes. Despite encouraging results with multi-pronged approaches to transit and safety, research is needed to inform “what works and what does not work” in terms of cooperation between public and private sectors and overall governance of PT. At the same time, achieving cooperation should not be the main goal of getting together. Partnership should be a means to support different actors to solve safety problems at transportation nodes—not an end in itself. Safety as an individual right and a public good needs to be further investigated in the context of mobility.
Fourth, we echo Newton (2004) on the need for studies that investigate if certain paths on the public transport network facilitate crime. In the past, the work by Belanger (1999) has investigated this subject by examining how far offenders traveled from their place of residence to the place where they committed subway crimes. The use of big data analysis in PT systems is a growing research area. Information from travel cards can provide information about erratic travel patterns that can be associated with criminal behavior or suicides (Ceccato et al. 2020), yet these research areas are in their infancy. Future research can work out how passengers’ routine mobility patterns can be analyzed using information from travel cards and better detect hotspots of crime by time slices, such as minutes—crucial information for crime prevention. By having the total number of passengers, measures of risk can be more precise in comparison with the traditional traveler-flow estimates. These types of measures will certainly allow us to implement a place-oriented public health perspective to transit safety (e.g. Branas et al. 2018) in which crime in PT can be treated as any other preventable harm, such as fall incidents, self-harm/suicides, or acts of terrorism.
Finally, transit safety research will open up research questions for a wider spectrum of sciences, from ethics to computer science. With the use of current technologies (e.g. CCTV, information from travel smart cards, apps, MaaS mobility as a service), on top of the new technologies under way (e.g. micromobility vehicles, virtual reality (VR), artificial intelligence (AI), autonomous vehicles (AV)), solutions as well new safety challenges will appear. One area of research is related to the potential impact of AVs on current PT supply, while prioritizing and accommodating the safety needs of travelers. Assessments of the efficiency of autonomous buses in ensuring the safety of PT riders along the trip and in “the last mile” are already opening a new research frontier. When autonomous buses are implemented, issues of trust and safety by passengers, particularly vulnerable users, will be relevant for further investigation. Not least, concerns about trust and data privacy are bound to become more important than they are today. When they do, it is important to evaluate the opportunities and risks for all types of users. Moreover, there is a need to promote in-depth critical discussions with city planners, transit operators, policy makers, real estate developers, architects, and designers about the impact of AVs on future cities’ designs and PT infrastructures. Research that examines the impact of new technologies on PT users is vital to ensuring mobility and safety for all.
References
Abenoza RF, Ceccato V, Susilo YO, Cats O (2018) Individual, travel, and bus stop characteristics influencing travelers’ safety perceptions. Transp Res Rec J Transp Res Board 2672:19–28
Adams W, Herrmann C, Felson M (2015) Crime, transportation and malignant mixes. In: Newton VCAA (ed) Safety and security in transit environments: an interdisciplinary approach. Basinstoke, Palgrave
Alessandrin A, César-Franquet L, Dagorn J (2016) Femmes et déplacements. https://entreleslignesentrelesmots.files.wordpress.com/2017/02/femmes-et-deplacements.pdf
Ariel B, Newton M, McEwan L, Ashbridge GA, Weinborn C, Brants HS (2019) Reducing assaults against staff using body-worn cameras (BWCs) in railway stations. Crim Justice Rev 44:76–93
Atkins ST (1990) Personal security as a transport issue: a state-of-the-art review. Transp Rev 10:111–125
Austin TL, Buzawa E (1984) Citizen perceptions on mass transit crime and its deterrence: a case study. Transp Q 38:103–120
Bachok S, Osman MM, Murad M, Ibrahim M (2014) An assessment of commuters’ perceptions of safety and comfort levels of ‘women-only coach’: the case study of KTM Komuter Malaysia. In: The 4th international conference on sustainable future for human security SUSTAIN 2013, vol 20, pp 197–205
Ball KS, Wesson CJ (2017) Perceptions of unwanted sexual behaviour on public transport: exploring transport density and behaviour severity. Crime Prevent Community Saf 19:199–210
Barjonet P, Gezentsvey M, Mores C (2010) Perception des risques et choix du mode de transport. Approche conceptuelle et modélisation prédictive. Flux 81:19–32
Barjonet P, Gezentsvey M, Mores C (2011) Perception du risque dans les transports en France et en Norvege (PETRIS–WP2)—Etude qualitative et quantitative. Ministere de l’Ecologie, de l’Energie, de Developpement durable et de la Mer Commissariat general du developpement durable Direction de la recherche et de l’innovation
Belanger M (1999) Crime mobility and public transport: the case of the New York City subway. Rutgers University, The State University of New Jersey
Beller A, Garelik S, Cooper S (1980) Sex crimes in the subway. Criminology 18:35–52
Billings SB, Leland S, Swindell D (2011) The effects of the announcement and opening of light rail transit stations on neighborhood crime. J Urban Affairs 33:549–566
Bivina GR, Gupta A, Parida M (2019) Influence of microscale environmental factors on perceived walk accessibility to metro stations. Transp Res Part D Transp Environ 67:142–155
Bivina GR, Gupta A, Parida M (2020) Walk accessibility to metro stations: an analysis based on meso- or micro-scale built environment factors. Sustain Cities Soc 55:102047
Block R, Davis S (1996) The environs of rapid transit stations: a focus for street crime or just another risky place? Preventing mass transit crime. Criminal Justice Press, Monsey, pp 237–257
Bon D, Scherer S, Zauberman R, Robert P, Heurtel H (2009) L'insécurité en Île-de-France. Rapport final: enquête: victimation et sentiment d’insécurité
Bonnet F (2008) Les effets pervers du partage de la sécurité. Polices publiques et privées dans une gare et un centre commercial. Sociol Trav 50:505–520
Bonnet F (2006) La production organisée de l'ordre. Contrôler des gares et des centres commerciaux à Lyon et à Milan. Sociologie, Institut d'études politiques de Paris—Sciences Po
Bowers K (2014) Risky facilities: crime radiators or crime absorbers. A comparison of internal and external levels of theft. J Quant Criminol 30:389–414
Bradet C, Normandeau A (1987) La criminalité et les transports publics. Déviance Soc 11:105–122
Branas CC, South E, Kondo MC, Hohl BC, Bourgois P, Wiebe DJ, Macdonald JM (2018) Citywide cluster randomized trial to restore blighted vacant land and its effects on violence, crime, and fear. Proc Natl Acad Sci USA 115:2946–2951
Brantingham P, Brantingham P (1995) Criminality of place—crime generators and crime attractors. Eur J Crim Policy Res 3:5–26
Browne TF (2010) La perception du risque terroriste et de ses conséquences sur la gestion de la sécurité dans le système de transport en commun de Montréal
Buckley JB (1996) Public transit and crime: a routine activities/ecological approach. Simon Fraser University
Burnett J, Pang AY-H (2004) Design and performance of pedestrian subway lighting systems. Tunn Undergr Space Technol 19:619–628
Burrows J (1980) Closed-circuit television and crime on the London Underground. In: Clarke RV, Mayhew P (eds) Designing out crime. HMSO, London, pp 75–83
Castagnino F (2016) Séparer pour mieux surveiller. Spatialité des risques et pratiques de surveillance en Gare du Nord. Flux 103–104:44–56
CEMT (2003) Vandalisme, terrorisme et sûreté dans les transports publics urbains de voyageurs, Éditions. OCDE
CRIME-CONCERN (2004) People’s perceptions of personal security and their about crime on public transport: research findings. Dft, London
Cao J, Duncan M (2019) Associations among distance, quality, and safety when walking from a park-and-ride facility to the transit station in the Twin cities. J Plan Educ Res 39:496–507
Capasso da Silva D, Rodrigues da Silva AN (2020) Sustainable modes and violence: perceived safety and exposure to crimes on trips to and from a Brazilian university campus. J Transp Health 16:100817
Casas I, Delmelle EC (2017) Tweeting about public transit—gleaning public perceptions from a social media microblog. Case Stud Transp Policy 5:634–642
Ceccato V (2013) Moving safely: crime and perceived safety in Stockholm’s subway stations. Lexington, Plymouth
Ceccato V (2017a) Women’s transit safety: Making connections and defining future directions in research and practice. Crime Prevent Community Saf 19:276–287
Ceccato V (2017b) Women’s victimisation and safety in transit environments. Crime Prev Community Saf 19:163–167
Ceccato V (2019) Eyes and apps on the streets: from surveillance to sousveillance using smartphones. Crim Justice Rev 44:25–41
Ceccato V, Cats O, Wang Q (2015) The geography of pickpocketing at bus stops: an analysis of grid cells. In: Ceccato V, Newton A (eds) Safety and security in transit environments. Palgrave Macmillan UK, London
Ceccato V, Loukaitou-Sideris A (2020) Transit crime and sexual violence in cities: international evidence and prevention. Routledge, London
Ceccato V, Masci S (2017) Airport environment and passengers’ satisfaction with safety. J Appl Secur Res 12:356–373
Ceccato V, Nalla MK (2020) Crime and fear in public places: towards safe, inclusive and sustainable cities. Taylor & Francis Group, New York
Ceccato V, Paz Y (2017) Crime in São Paulo’s metro system: sexual crimes against women. Crime Prev Community Saf 19:211–226
Ceccato V, Uittenbogaard AC (2013) Space-time dynamics of crime in transport nodes. Ann Assoc Am Geogr 104:131–150
Ceccato V, Uittenbogaard A, Bamzar R (2011) Security in Stockholm’s underground stations: The importance of environmental attributes and context. Secur J 26:33–59
Ceccato V, Wiebe D, Vrotsou K, Nyberg U, Grundberg A (2020) The situational conditions of suicide in transit environments: an analysis using CCTV footage. J Transp Health. https://doi.org/10.1016/j.jth.2020.100976
Ceccato V, Wiebe DJ, Eshraghi B, Vrotsou K (2017) Women’s mobility and the situational conditions of rape: cases reported to hospitals. J Interpers Violence 35(15–16):2917–2946. https://doi.org/10.1177/0886260517699950
Ceccato V (2018) Crime in transit environments: lessons from Stockholm (Sweden) and São Paulo (Brazil) metro systems: 交通环境犯罪: 从瑞典斯德哥尔摩和巴西圣保罗 地铁系统的经验总结. Landscape architecture
Ceccato V, Newton A (2015) Safety and security in transit environments: an interdisciplinary approach. Palgrave Macmillan, New York
Ceccato V, Näsman P, Langefors L (2020) Sexual violence on the move: an assessment of youth’s victimization in public transportation. Women Crim Justice. https://doi.org/10.1080/08974454.2020.1733732
Chaiken JM, Lawless M, Stevenson KA (1974) The impact of police activity on crime: robberies on the New York city subway system. Santa Monica, CA: RAND Corporation. https://www.rand.org/pubs/reports/R1424.html
Chantal D (2011) Transport et parité des sexes. Forum International des Transports. https://m.centre-hubertine-auclert.fr/sites/default/files/fichiers/transports-et-parite-des-sexes.pdf
Chowdhury S, Van Wee B (2020) Examining women’s perception of safety during waiting times at public transport terminals. Transp Policy 94:102–108
Church A, Frost M, Sullivan K (2000) Transport and social exclusion in London. Transp Policy 7:195–205
Clarke RV (ed) (1983) Situational crime prevention: its theoretical basis and practical scope. University of Chicago Press, Chicago
Clarke RV, Belanger M, Eastman JA (1996) Where angel fears to tread: a test in the New York city subway of the robbery/density hypothesis. Crime prevention studies: preventing mass transit crime. Criminal Justice Press, Monsey
Clarke R, Eck J (2007) Understanding risky facilities [Online]. Center for problem-oriented policing. https://popcenter.asu.edu/content/understanding-risky-facilities. Accessed 2020
Cohen LE, Felson M (1979) Social change and crime rate trends: a routine activity approach. Am Sociol Rev 44:588–608
Colard F (2018) Femmes et transports en commun. Des parcours de combattantes? http://www.femmesprevoyantes.be/wp-content/uploads/2018/12/transports-en-commun-WEB.pdf
Coppola P, Silvestri F (2020) Assessing travelers’ safety and security perception in railway stations. Case Stud Transp Policy 8:1127–1136
Cozens PM, Neale RH, Whitaker J, Hillier D (2002) Investigating perceptions of personal security on the Valley Lines rail network in South Wales (UK). World Transp Policy Pract 8(1):19–29
Cozens P, Neale R, Hillier D, Whitaker J (2004) Tackling crime and fear of crime while waiting at Britain’s Railway stations. J Public Transp 7:23–41
Cozens P, Neale R, Whitaker J, Hillier D (2003a) Investigating personal safety at railway stations using “virtual reality” technology. Facilities 21:188–194
Cozens P, Neale R, Whitaker J, Hillier D (2003b) Managing crime and the fear of crime at railway stations––a case study in South Wales (UK). Int J Transp Manag 1:121–132
Cozens PM, Saville G, Hillier D (2005) Crime prevention through environmental design (CPTED): a review and modern bibliography. Prop Manag 23:328–356
Crenshaw K (1989) Demarginalizing the intersection of race and sex: a black feminist critique of antidiscrimination doctrine, feminist theory and antiracist politics. University of Chicago Legal Forum. 139–167
Crossonneau N (2003) L’insécurité dans les transports publics urbains: bibliographie commentée. Centre d’études sur les réseaux, les transports, l’urbanisme et les constructions publiques (CERTU). https://hal-lara.archives-ouvertes.fr/hal-02150521/document
Currie G, Delbosc A, Mahmoud S (2013) Factors influencing young peoples’ perceptions of personal safety on public transport. J Public Transp 16:23–42
D’arbois H (2019) Sécurité dans les transports en commun: Le cas des usagers captifs. Note Rapide. 33. ONDRP, Paris
d’Arbois de Jubainville H, Vanier C (2017) Women’s avoidance behaviours in public transport in the Ile-de-France region. Crime Prev Community Saf 19:183–198
Debrincat M, Dupart C, Laurent C (2016) Étude sur le harcèlement sexiste et les violences sexuelles faites aux femmes dans les transports publics. FNAUT, Paris
Debrincat M, Dupart S, Moggio C (2017) Harcèlement sexiste dans les transports collectifs routiers et les pôles d’échanges multimodaux: L’analyse de la Fnaut, Paris
Delbosc A, Currie G (2012) Modelling the causes and impacts of personal safety perceptions on public transport ridership. Transp Policy 24:302–309
Diec J, Coxon S, De Bono A (2010) Designing a public train station shelter to minimise anti-social behaviour and crime in Melbourne's metropolitan rail environment. In: ATRF 2010: 33rd Australasian transport research forum, 2010
Ding H, Loukaitou-Sideris A, Agrawal AW (2020) Sexual harassment and assault in transit environments: a review of the English-language literature. J Plan Lit 35(3):267–280
Dunckel-Graglia A (2013) Women-only transportation: How “pink” public transportation changes public perception of women’s mobility. J Public Transp 16:85–105
Dunckel-Graglia A (2016) Finding mobility: women negotiating fear and violence in Mexico City’s public transit system. Gend Place Cult 23:624–640
Eck JE (2019) Place Managers and Crime Places. Oxford University Press
Evans G (2009) Accessibility, urban design and the whole journey environment. Built Environ 1978(35):366–385
Felson M, Belanger ME, Bichler GM, Bruzinski CD, Campbell GS, Fried CL, Grofik KC, Mazur IS, O'regan AB, Sweeney PJ, Ullman AL, Williams LM (1996) Redesigning hell: preventing crime and disorder at the port authority bus terminal. Prev Mass Transit Crime
Fillone AM, Mateo-Babiano I (2018) Do I walk or ride the rickshaw? Examining the factors affecting first- and last-mile trip options in the historic district of Manila (Philippines). J Transp Land Use 11:237–254
Fyhri A, Backer-Grøndahl A (2012) Personality and risk perception in transport. Accid Anal Prev 49:470–475
Gaylord MS, Galliher JF (1991) Riding the underground dragon: crime control and public order on Hong Kong’s mass transit railway. Br J Criminol 31:15–26
Gekoski A, Jacqueline M, Gray MH, Horvath SE, Aliye E, Adler J (2015) ‘What works’ in reducing sexual harassment and sexual offences on public transport nationally and internationally: a rapid evidence assessment. In: Transport BTPADF (ed). London
Gentry K (2015) Apple picking: the rise of electronic device thefts in boston subways. Macmillan, Palgrave
Gerell M (2018) Bus stops and violence, are risky places really risky? Eur J Crim Policy Res 24:351–371
Gilbert S, Schultz D (1996) Women and transit security: a new look at an old issue. In: Gilbert SSD (ed) Women’s travel issues second national conference: Baltimore
Gosselin C (2012) De la conception à la gestion des espaces en gare: La prévention au coeur de la stratégie en sûreté. IAU-ÎdF, Paris
Grandmaison R, Tremblay P (1997) Évaluation des effets de la télé-surveillance sur la criminalité commise dans 13 stations du métro de Montréal. Criminologie 30:93–110
le Grâet A, Vanier C (2016) Les atteintes personnelles dans les transports en commun: Résultats basés sur les déclarations des personnes de 14 ans et plus, interrogées lors des enquêtes «Caedre de vie et sécurité» 2009–2013. ONDRP, Paris
Gu H, Chen P, Guo Y, Yao M, Yang H, Hou J (2019) Detecting pickpocketing offenders by analyzing beijing metro subway data. In: 2019 the 4th IEEE international conference on big data analytics, March. 15–18. Suzhou, China
Guimarães T, Lucas K, Timms P (2019) Understanding how low-income communities gain access to healthcare services: a qualitative study in São Paulo, Brazil. J Transp Health 15:100658
Gómez AJ, Haarhoff E, García E (2020) Highway expansion and crime: challenges on urban development for sustainability. In: Bougdah HVA, Sotoca A, Trapani F, Migliore M, Clark N (eds) Urban and transit planning. Springer, Cham, pp 133–143
HCEEFH (2015) Avis sur le harcèlement sexiste et les violences sexuelles dans les transports en commun: Se mobiliser pour dire stop sur toute la ligne au harcèlement sexiste et aux violences sexuelles dans les transports. HCEFH, Paris
Hale C (1996) Fear of crime: a review of the literature. Int Rev Victimol 4:79–150
Hamelin F (2010) Les polices des transports face aux défis croisés de la mobilité, de la sûreté et de la sécurité. Flux 81:46–56
Hart TC, Miethe TD (2014) Street robbery and public bus stops: a case study of activity nodes and situational risk. Secur J 27:180–193
Higgins JPT, Green S (2011) Cochrane handbook for systematic reviews of interventions. In: Higgins JPTGS (ed) The cochrane collaboration. http://www.mri.gov.lk/assets/Uploads/Research/Cochrane-Hand-booktext.pdf
Hirtenlehner H, Farrall S (2014) Is the ‘shadow of sexual assault’ responsible for women’s higher fear of burglary? Br J Criminol 54(6):1167–1185
Hong J, Chen C (2014) The role of the built environment on perceived safety from crime and walking: examining direct and indirect impacts. Transportation 41:1171–1185
Horii M, Burgess A (2012) Constructing sexual risk: ‘Chikan’, collapsing male authority and the emergence of women-only train carriages in Japan. Health Risk Soc 14:41–55
Hsu H-P (2011) How does fear of sexual harassment affect women’s use of transit? Volume II: technical papers. In: Hsu H-P (ed) Proceedings of the 4th international conference on women’s issues in transportation. Washington, D.C., pp 85–94
Ihlanfeldt KR (2003) Rail transit and neighborhood crime: the case of Atlanta, Georgia. South Econ J 70:273–294
Ingalls GL, Hartgen D, Owens T (1993) Public fear of crime and its role in bus transit use. Transp Res Rec 1433:201–211
Iudici A, Bertoli L, Faccio E (2017) The ‘invisible’ needs of women with disabilities in transportation systems. Crime Prev Community Saf 19:264–275
Iudici A (2015) Sexual harassment against people with mental disabilities in transit environments: implications for services and clinics. In: Ceccato V, Newton A (eds) Safety and security in transit environments: an interdisciplinary approach. Palgrave Macmillan UK, London, pp 328–343
Jun P, Subeh C, Douglas W (2020) Gap between policymakers’ priorities and users’ needs in planning for accessible public transit system. J Transp Eng Part A Syst 146:04020020
Kash G (2019) Always on the defensive: the effects of transit sexual assault on travel behavior and experience in Colombia and Bolivia. J Transp Health 13:234–246
Keane C (1998) Evaluating the influence of fear of crime as an environmental mobility restrictor on women’s routine activities. Environ Behav 30:60–74
Kenney DJ (1986) Crime on the subways: Measuring the effectiveness of the guardian angels. Justice Q 3:481–496
Kim S, Ulfarsson GF, Hennessy JT (2007) Analysis of light rail rider travel behavior: impacts of individual, built environment, and crime characteristics on transit access. Transp Res Part A Policy Pract 41:511–522
Kirchhoff GF, Morosawa H, Barkhuizen J, Bussinger C, Daigaku T, Sutseyo H, Bey JF, Ungul E (2007) The Asian passengers’ safety study of sexual molestation on trains and buses: the Indonesian pilot study. Acta Criminol 20:1–13
Kooi BR (2013) Assessing the correlation between bus stop densities and residential crime typologies. Crime Prev Community Saf 15:81–105
Kunieda M, Gauthier A (2007) Gender and urban transport: smart and affordable. In: Module 7a. Sustainable transport sourcebook for policy makers in developing countries. GTZ, Eschborn
La Vigne N (1996) Safe transport: security by design on the washington metro. In: Preventing Mass Transit Crime, Clarke RV (ed.). US Department of Justice, pp 163–197
La Vigne NG (1997) Visibility and vigilance: metro's situational approach to preventing subway crime. National Institute of Justice-Research in Brief. U.S. Department of Justice
La Vigne N (2015) Crime in and around metro transit stations: Exploring the utility opportunity theories of crime. In: Newton VCA (ed) Safety and security in transit environments: an interdisciplinary approach. Palbrage, Basingstoke
Landman K (2012) Reconsidering crime and urban fortification in South Africa. In: Ceccato V (ed) The urban fabric of crime and fear. Springer, Dordrecht, pp 85–110.
Law R (1999) Beyond ‘women and transport’: towards new geographies of gender and daily mobility. Prog Hum Geogr 23:567–588
Lea SG, D’Silva E, Asok A (2017) Women’s strategies addressing sexual harassment and assault on public buses: an analysis of crowdsourced data. Crime Prev Community Saf 19:227–239
Levin L (2015) Gender equality and safety, a challenge for transport planning: moving away from stereotypes and stereotypical attitudes anda habits. In: Newton VCA (ed) Safety and security in transit environments: an interdisciplinary approach. Palgrave, Basingstoke
Levine NWM (1986) Bus crime in Los Angeles: II—victims and public impact. Transp Res Part A General 20:285–293
Levine N, Wachs M, Shirazi E (1986) Crime at bus stops: a study of environmental factors. J Archit Plan Res 3:339–361
Levine N, Wachs M (1985) Factors affecting the incidence of bus crime in Los Angeles, vol I and II
Levine N, Wachs M (1986) Tracking crime on buses. TR News 18–22
Liggett R, Loukaitou-Sideris A, Iseki H (2001) Bus stop-environment connection: do characteristics of the built environment correlate with bus stop crime? Transp Res Rec J Transp Res Board 1760:20–27
Liggett R, Loukaitou-Sideris A, Iseki H (2003) Journeys to crime: assessing the effects of a light rail line on crime in the neighborhoods. J Public Transp 6:85–115
Liu L, Jiang C, Zhou S, Liu K, Du F (2017) Impact of public bus system on spatial burglary patterns in a Chinese urban context. Appl Geogr 89:142–149
Liu L, Lan M, Eck JE, Kang EL (2020) Assessing the effects of bus stop relocation on street robbery. Comput Environ Urban Syst 80:101455
Loukaitou-Sideris A (1999) Hot spots of bus stop crime: the importance of environmental attributes. J Am Plann Assoc 65:395–411
Loukaitou-Sideris A (2006) Is it safe to walk? Neighborhood safety and security considerations and their effects on walking. J Plann Lit 20:219–232
Loukaitou-Sideris A (2012) Safe on the move: the importance of the built environment. In: Ceccato V (ed) The urban fabric of crime and fear. Springer, Dordrecht
Loukaitou-Sideris A, Eck JE (2007) Crime prevention and active living. Am J Health Promot 21:380–389
Loukaitou-Sideris A, Fink C (2008) Addressing women’s fear of victimization in transportation settings: a survey of U.S. Transit Agencies Urban Affairs Rev 44:554–587
Loukaitou-Sideris A, Liggett R, Iseki H (2002) The geography of transit crime: documentation and evaluation of crime incidence on and around the green line stations in Los Angeles. J Plan Educ Res 22:135–151
Loukaitou-Sideris A, Liggett R, Iseki H, Thurlow W (2001) Measuring the effects of built environment on bus stop crime. Environ Plan B Plan Des 28:255–280
Loukaitou-Sideris A (2008) How safe is the ride? Evaluation of design and policy responses to women’s fear of victimization and crime. Department of Urban Planning, UCLA School of Public Affairs, Los Angeles
Loukaitou-Sideris (2009) How to ease women’s fear of transportation environments: case studies and best practices. Mineta Transportation Institute: Report 09-01, San Jose
Lubitow A, Abelson MJ, Carpenter E (2020) Transforming mobility justice: gendered harassment and violence on transit. J Transp Geogr 82
Lynch G, Atkins S (1988) The influence of personal security fears on women’s travel patterns. Transportation 15:257–277
Madan M, Nalla M (2015) Sexual harassment in public spaces: examining gender differences in perceived seriousness and victimization. Int Crim Justice Rev 26(2):80–97
Mahmoud S, Currie (2010) The relative priority of personal safety concerns for young people on public transport. In: Mahmoud S, Currie G (eds) Australasian transport research forum conference. Canberra, Australia
Malochet V (2015) La gouvernance de la sécurité dans les transports publics franciliens. IAU-ÎdF, Paris
Malochet V, le Goff T (2013) Étude sur la sécurisation des transports publics franciliens. IAU-ÎdF, Paris
Mariotte S (2004) La vidéosurveillance dans la sécurisation des transports collectifs franciliens. IAURIF, Paris
Mariotte S, Heurtel H, le Delliou S (2004) Évaluation de l’impact de la vidéosurveillance sur la sécurisation des transports en commun en région Île-de-France. IAURIF, Paris
Marteache N (2018) “Please refrain from locking your bags”: theft from passengers’ checked-in luggage at US airports. Secur J 31:163–189
Marteache N, Bichler G, Enriquez J (2015) Mind the gap: perceptions of passenger aggression and train car supervision in a commuter rail system. J Public Transp 18:61–73
McCarthy OT, Caulfield B, O’Mahony M (2016) How transport users perceive personal safety apps. Transp Res Part F Traffic Psychol Behav 43:166–182
Mitra-Sarkar S, Partheeban P (2011) Abandon all hope, ye who enter here: understanding the problem of “eve teasing” in Chennai, India. In: Proceedings of the 4th international conference on women’s issues in transportation. Volume II. Technical Papers, Transportation Research Board, Washington, DC, pp 74–84
Mohamed AA, Stanek D (2020) The influence of street network configuration on sexual harassment patterns in Cairo. Cities 98:102583
Moher D, Liberati A, Tetzlaff J, Altman D (2009) Preferred reporting items for systematic reviews and meta-analyses: the PRISMA statement. PLoS Med 6:e1000097
Moore S (2011) Understanding and managing anti-social behaviour on public transport through value change: the considerate travel campaign. Transp Policy 18:53–59
Moreira GC, Ceccato V (2020) Gendered mobility and violence in the Sa˜o Paulo metro. Brazil. Urban Studies. 58(1):203–222
Natarajan M (2016) Rapid assessment of “eve teasing” (sexual harassment) of young women during the commute to college in India. Crime Sci 5:1–11
Natarajan M, Schmuhl M, Sudula S, Mandala M (2017) Sexual victimization of college students in public transport environments: a whole journey approach. Crime Prev Community Saf 19:168–182
Newton A (2004) Crime on public transport: ‘Static’ and ‘Non-Static’ (moving) crime events. Western Criminol Rev 5(3):25–42
Newton A (2008) A study of bus route crime risk in urban areas: the changing environs of a bus journey. Built Environ 34:88–103
Newton A (2018) Macro-level generators of crime, including parks, stadiums, and transit stations. The Oxford Handbook of Environmental Criminology, Oxford University Press, Oxford
Newton AD, Johnson SD, Bowers KJ (2004) Crime on bus routes: an evaluation of a safer travel initiative. Polic Int J Police Strat Manag 27:302–319
Newton A, Loukaitou-Sideris A, D’arbois De Jubainville H, Huang D, Norgaard JK, Solymosi R (2020) Precautions and responses. In: Ceccato V, Loukaitou-Sideris A (eds) Transit crime and sexual violence in cities: international evidence and prevention. Routledge, New York, pp. 276–294
Newton AD, Partridge H, Gill A (2014) Above and below: measuring crime risk in and around underground mass transit systems. Crime Sci 3:1–14
Newton AD, Partridge H, Gill A (2014) In and around: Identifying predictors of theft within and near to major mass underground transit systems. Secur J 27:132–146
Newton A (2014) Crime on public transport. In: Bruinsma G, Weisburd D (eds) Encyclopedia of criminology and criminal justice. Springer, New York, NY. https://doi.org/10.1007/978-1-4614-5690-2_301
Newton AD (2007) Routing out the hot-spots: toward using GIS and crime-place principles to examine criminal damage to bus shelters. In: GIS and Evidence-Based Policy Making. Innovations in GIS, 11. CRC Press, London, UK, pp 69–94
Newton A (2016) Transport technology and crime. In: The handbook of technology, crime and justice. Routledge, Routledge, Abingdon 2017, pp 281–294
Newton A (2018) Macro-level generators of crime, including parks, stadiums, and transit stations. In: Bruinsma GJN, Johnson SD (eds) The Oxford handbook of environmental criminology. Oxford University Press, New York, pp 497–517
Newton A, Bowers K (2007) The geography of bus shelter damage: the influence of crime, neighbourhood characteristics and land-use. Internet J Criminol. http://eprints.hud.ac.uk/id/eprint/474/
Noble J (2015a) L’insécurité personnelle dans les transports en commun. Déviance Soc 39:343–364
Noble J (2015b) L’insécurité personnelle des jeunes dans les transports en commun franciliens: une étude dispositionnelle du sentiment d’insécurité. Doctoral Dissertation. Université Paris-Nord
Noble J, Fussy F (2020) Le sentiment d'insécurité dans les transports collectifs franciliens en 2019. 845. Note rapide de l'Institut Paris Région. Institut Paris Région, Paris
Nordfjærn T, Şimşekoğlu Ö, Lind HB, Jørgensen SH, Rundmo T (2014) Transport priorities, risk perception and worry associated with mode use and preferences among Norwegian commuters. Acci Anal Prev 72:391–400
Nourani F, Antonello SL, Govone JS, Ceccato V (2020) Women and LGBTI youth as targets assessing transit safety in Rio Claro, Brazil. In: Ceccato V, Loukaitou-Sideris A (eds) Transit crime and sexual violence in cities international evidence and prevention. Routledge, New York
Orozco-Fontalvo M, Soto J, Arévalo A, Oviedo-TrespalacioS O (2019) Women’s perceived risk of sexual harassment in a Bus Rapid Transit (BRT) system: the case of Barranquilla, Colombia. J Transp Health 14:100598
Otis MD (2007) Perceptions of victimization risk and fear of crime among lesbians and gay men. J Interpers Viol 22:198–217
Otu SE, Agugua A (2020) An analysis of transit safety among college students in Lagos, Nigeria. In: Ceccato V, Nalla M (eds) Crime and fear in public places: towards safe, inclusive and sustainable cities. Routledge, London
Ouimet M, Tremblay P (2001) Trajets urbains et risques de victimisation: les sites de transit et le cas du métro de Montréal. Criminologie 34:157–176
Pearlstein A, Wachs M (1982) Crime in public transit systems: an environmental design perspective. Transportation 11:277–297
Phillips DC, Sandler D (2015) Does public transit spread crime? Evidence from temporary rail station closures. Reg Sci Urban Econ 52:13–26
Piza EL, Welsh BC, Farrington DP, Thomas AL (2019) CCTV surveillance for crime prevention. Criminol Public Policy 18:135–159
Piza EL, Kennedy D (2003) Transit stops, robbery, and routine activities: examining street robbery in the Newark, NJ Subway Environment
Poister TH (1996) Transit-related crime in suburban areas. J Urban Affairs 18:63–76
Priks M (2009) The effect of surveillance cameras on crime: evidence from the stockholm subway. Department of Economics Stockholm University, Stockholm
PriyaUteng T, Singh YJ, Lam T (2019) 12-safety and daily mobilities of urban women—methodolgies to confront the policy of “invisibility.” In: Lucas K, Martens K, Diciommo F, Dupont-Kieffer A (eds) Measuring transport equity. Elsevier, Amterdam
Reed TB, Wallace RR, Rodriguez DA (2000) Transit passenger perceptions of transit-related crime reduction measures. Transp Res Rec J Transp Res Board 1731:130–141
Richards LJI (1980) Passenger value structure model. Final report DOT contract TSC-1314. Dunlap and Associates, Inc., Darien
Riley NE, Dean DL (1985) Bus station security: crime at intercity bus stations. Transp Res Rec 1012:56–64
Rišová K, Madajová MS (2020) Gender differences in a walking environment safety perception: a case study in a small town of Banská Bystrica (Slovakia). J Transp Geogr 85:102723
Romero-Torres J, Ceccato V (2020) Youth safety in public transportation: the case of eastern Mexico City, Mexico. In: Ceccato V, Nalla M (eds) Crime and fear in public places: towards safe, inclusive and sustainable cities. Routledge, London, pp 145–159
Scarborough Women’s Centre/METRAC (1991) Making transit stops safer for women: Scarborough moves forward. Scarborough Women’s Centre/METRAC, Scarborough
Sedelmaier CM (2014) Offender-target redistribution on a new public transport system. Secur J 27:164–179
Sedelmaier CM (2003) Railroaded: the effects of a new public transportation system upon local crime patterns. Rutgers University, The State University of New Jersey.
Sham R, Hussein MZSM, Ismail HN (2013) A dilemma of crime and safety issues among vulnerable travellers in Malaysian urban environment. In: AicE-Bs 2013 London (Asia Pacific International Conference on Environment-Behaviour Studies), 4–6 September 2013, vol 105, pp 498–505
Shellow R, Romualdi JP, Bartel EW (1974) Crime in rapid transit systems: an analysis and a recommended security and surveillance system. Transp Res Rec 487:1-2.
Shen LD, Ospina D, Zhao F, Elbadrawi H (1997) Analyses of technologies and methodologies adopted by US transit agencies to enhance transit security. NUTI report, NUTI96FIU1.2
Shibata S, Hanyu K, Doi Hata T, Yamaoka Y (2014) Expectation and perception of crime and disorder events in railway stations in Tokyo. Secur J 27:210–225
Shibata S (2020) Are women-only cars (WOC) a solution to groping? A survey among college students in Tokyo/Kanagawa, Japan. Int J Comp Appl Crim Justice 44:293–305
Smit T, Landman K, Venter C (2015) The impact of crime and neighbourhood enclosures on travel behaviour and transport patterns in South Africa. In: Newton VCA (ed) Safety and security in transit environments: an interdisciplinary approach. Palgrave, Basingstoke
Smith MJ (2008) Addressing the security needs of women passengers on public transport. Secur J 21:117–133
Smith M, Clarke R (2000) Crime and public transport. Crime Justice 27:169–233
Smith MJ, Cornish DB (2006) Secure and tranquil travel—preventing crime and disorder on public transport. UCL Jill Dando Institute of Crime Science, London
Smith D, Winstanley S, Levine N (2013) Targeting crime on public transport: an example from Greater Manchester, England. In: CrimeStat IV: a spatial statistics program for the analysis of crime incident locations (version 4.0). Ned Levine & Associates ed, Houston
Smith M (1986) Transit crime study volume II: final report. U.S. Department of Justice National Institute ot Justice, New York
Sochor J (2012a) Mobility-enhancing ICT from an ethical perspective: the case of a navigation system for visually impaired persons. J Transp Res Board
Sochor J (2012b) Impacts of intelligent transportation systems on users’ mobility: a case study analysis. Licentiate Thesis in Transport Science, Stockholm, Sweden
Solymosi R, Borrion H, Fujiyama T (2015) Crowd spatial patterns at bus stops: secuirty implications and effects of warning messages. In: Newton VCA (ed) Safety and security in transit environments: an interdisciplinary approach. Palgrave, Basingstoke, pp 156–178
Solymosi RCK, Newton A (2018) Did they report it to stop it? A realist evaluation of the effect of an advertising campaign on victims’ willingness to report unwanted sexual behaviour. Secur J 31:570–590
Spicer V, Song J (2017) The impact of transit growth on the perception of crime. J Environ Psychol 54:151–159
SRI - Stanford Research Institute (1970) Reduction of robberies and assaults of bus drivers, vol. 1. Summary and Conclusions. National Technical Information Service, Springfield, VA
Stringer MS (2007) Hidden in plain sight: Sexual harassment and assault in the New York City subway system. Office of the Manhattan Borough President, New York
Sung-Suk VY (2009) Bus stops and crime: do bus stops increase crime opportunities in local neighborhoods? The State University of New Jersey, Rutgers
Swain S (2015) Securing the transport system. In: Routledge handbook of law and terrorism. Routledge
TCRP (2001) Guidelines for collecting, analyzing, and reporting transit crime data. Transportation Research Board, National Research Council, Washington, D.C.
Tilley N (1993) Understanding car parks, crime, and CCTV: evaluation lessons from safer cities. Home Office Police Dept., London
Tripathi K, Borrion H, Belur J (2017) Correction to: Sexual harassment of students on public transport: an exploratory study in Lucknow, India. Crime Prev Community Saf 20:223–223
Turner J (2012) Urban mass transit, gender planning protocols and social sustainability—the case of Jakarta. Gend Transp Trans Costs Compet Claims Transp Policy Gaps 34:48–53
UN-Habitat TSCP (2019) Safer cities programme [Online]. UN-Habitat, New York. Accessed 12 Feb 2020
Uittenbogaard A, Ceccato V (2014) Safety in Stockholm’s underground stations: an agenda for action. Eur J Crim Policy Res 20:73–100
Uittenbogaard A (2015) An assessment of guardianship opportunities as provided by the environments of transit stations. In: Newton VCA (ed) Safety and security in transit environments: an interdisciplinary approach. Palgrave, Basingstoke, pp 56-75
Umaña-Barrios N, Gil AS (2017) How can spatial design promote inclusivity, gender equality and overall sustainability in Costa Rica's urban mobility system? In: Urban transitions conference, Shanghai, September 2016, vol 198, pp 1018–1035
Vanier C, D’arbois H (2018b) Le sentiment d’insécurité dans les transports en commun: Situations anxiogènes et stratégies d’évitement. ONDRP, Paris
Vanier C, D’Arbois H (2017) Feeling unsafe in public transportation: a profile analysis of female users in the Parisian region. Crime Prev Community Saf 19:251–263
Vanier C, D’arbois H (2018a) Le sentiment d’insécurité dans les transports en commun: situations anxiogènes et stratégies d’évitement. ONDRP, Paris
Vigne NGL (1996) Safe transport: security by design on the washington metro. In: Crime prevention studies: preventing mass transit crime, vo1 6. Criminal Justice Press, Monsey
Vilalta CJ (2011) Fear of crime in public transport: research in Mexico City. Crime Prev Community Saf 13:171–186
Wallace RR, Rodriguez DA, White C, Levine J (1999) Who noticed, who cares? Passenger reactions to transit safety measures. Transp Res Rec 1666:133–138
Wang B, Zacharias J (2020) Noise, odor and passenger density in perceived crowding in public transport. Transp Res Part A Policy Pract 135:215–223
Webb B, Laycock GK (1992) Reducing crime on the London Underground: an evaluation of three pilot projects. Home Office, London
Weber BS (2019) Uber and urban crime. Transp Res Part A Policy Pract 130:496–506
Wee BV, Banister D (2016) How to write a literature review paper? Transp Rev 36:278–288
Weidner R (1996) Target-hardening at a new york city subway station: decreased fare evasion—at what price? In: Clarke RV (eds) Preventing mass transit crime. Crime Prevention Studies, Vol. 6, Monsey, NY: Criminal Justice Press, pp 5–91
Whitzman C (2007) Stuck at the front door: gender, fear of crime and the challenge of creating safer space. Environ Plan A Econ Sp 39:2715–2732
Whitzman C, Thompson J, Favarin S, Nourani F, Shibata S (2020) Incidence and reporting: making the invisible matter. In: Loukautou-Sideris VCAA (ed) Transit crime and sexual violence in cities: international evidence and prevention. Routledge, London
Wiebe DJ, Richmond TS, Poster J, Guo W, Allison PD, Branas CC (2014) Adolescents’ fears of violence in transit environments during daily activities. Secur J 27:226–241
Wilow M (2015) Déplacements des femmes et sentiment d’insécurité à Bruxelles: perceptions et stratégies. Brussels Studies. Collection générale, n° 87. http://journals.openedition.org/brussels/1274
Wilson JQ, Kelling GL (1982) Broken windows. Atlantic Mon 249:29–38
Yates A, Ceccato V (2020) Individual and spatial dimensions of women’s fear of crime: a Scandinavian study case. Int J Comp Appl Crim Justice 44(4):277–292
Yavuz N, Welch EW (2010) Addressing fear of crime in public space: gender differences in reaction to safety measures in train transit. Urban Stud 47:2491–2515
Yu S-SV, Smith MJ (2014) Commuters using public transit in New York City: using area-level data to identify neighbourhoods with vulnerable riders. Secur J 27:194–209
Zahnow R, Corcoran J (2019) Crime and bus stops: an examination using transit smart card and crime data. Environ Plan B Urban Anal City Sci. https://doi.org/10.1177/2399808319890614
Acknowledgements
We would like to thank Dr Yuan Pang Wang for sharing his knowledge and experience of systematic literature overviews with the authors. Authors would also like to thank the Swedish Transport Administration for funding this research via the project “The impact of station’s environments on crime and passenger safety”, Grant number TRV 2020/22903.
Funding
Open Access funding provided by Royal Institute of Technology. This study was carried out as part of the research project “The impact of station’s environments on crime and passenger safety”, funded by the Swedish Transport Administration, Grant number TRV 2020/22903.
Author information
Authors and Affiliations
Corresponding author
Ethics declarations
Conflict of interest
The author(s) declare that they have no competing interests.
Additional information
Publisher's Note
Springer Nature remains neutral with regard to jurisdictional claims in published maps and institutional affiliations.
Appendix
Appendix
Rights and permissions
Open Access This article is licensed under a Creative Commons Attribution 4.0 International License, which permits use, sharing, adaptation, distribution and reproduction in any medium or format, as long as you give appropriate credit to the original author(s) and the source, provide a link to the Creative Commons licence, and indicate if changes were made. The images or other third-party material in this article are included in the article's Creative Commons licence, unless indicated otherwise in a credit line to the material. If material is not included in the article's Creative Commons licence and your intended use is not permitted by statutory regulation or exceeds the permitted use, you will need to obtain permission directly from the copyright holder. To view a copy of this licence, visit http://creativecommons.org/licenses/by/4.0/.
About this article

Cite this article
Ceccato, V., Gaudelet, N. & Graf, G. Crime and safety in transit environments: a systematic review of the English and the French literature, 1970–2020. Public Transp 14, 105–153 (2022). https://doi.org/10.1007/s12469-021-00265-1
Accepted:
Published:
Issue Date:
DOI: https://doi.org/10.1007/s12469-021-00265-1