Abstract
Burial dissolution of feldspar and carbonate minerals has been proposed to generate large volumes of secondary pores in subsurface reservoirs. Secondary porosity due to feldspar dissolution is ubiquitous in buried sandstones; however, extensive burial dissolution of carbonate minerals in subsurface sandstones is still debatable. In this paper, we first present four types of typical selective dissolution assemblages of feldspars and carbonate minerals developed in different sandstones. Under the constraints of porosity data, water–rock experiments, geochemical calculations of aggressive fluids, diagenetic mass transfer, and a review of publications on mineral dissolution in sandstone reservoirs, we argue that the hypothesis for the creation of significant volumes of secondary porosity by mesodiagenetic carbonate dissolution in subsurface sandstones is in conflict with the limited volume of aggressive fluids in rocks. In addition, no transfer mechanism supports removal of the dissolution products due to the small water volume in the subsurface reservoirs and the low mass concentration gradients in the pore water. Convincing petrographic evidence supports the view that the extensive dissolution of carbonate cements in sandstone rocks is usually associated with a high flux of deep hot fluids provided via fault systems or with meteoric freshwater during the eodiagenesis and telodiagenesis stages. The presumption of extensive mesogenetic dissolution of carbonate cements producing a significant net increase in secondary porosity should be used with careful consideration of the geological background in prediction of sandstone quality.
1 Introduction
The term secondary porosity refers to pore space resulting from the post-depositional dissolution of detrital grains or cements (Taylor et al. 2010). Ten genetic mechanisms have been proposed for the generation of aggressive fluids capable of dissolving minerals in sandstones, which are meteoric water penetration (Emery et al. 1990), mixing corrosion (Edmunds et al. 1982; Plummer 1975), acidic fluids generated from CO2 produced by the thermal maturation of organic matter (Schmidt and McDonald 1979a; Surdam et al. 1989; Surdam and Boese 1984), carboxylic acids generated during the thermal maturation of organic matter (Surdam et al. 1989; Surdam and Boese 1984), acidic fluids generated by clay mineral reactions (Giles and Marshall 1986), acid fluids generated by thermogenic sulfate reduction (TSR) and bacterial sulfate reduction (BSR) (Machel 2001; Machel et al. 1995), deep hot fluids (Taylor 1996), acidic fluids generated by silicate hydrolysis (Hutcheon and Abercrombie 1990), acidic fluids generated by silicate–carbonate interactions (Smith and Ehrenberg 1989), aggressive fluids due to cooling of formation fluids (Giles and De Boer 1989), and hot alkaline brines (Pye 1985).
The idea that the sandstone porosity can be significantly increased via burial dissolution of minerals (e.g., carbonate cements, feldspars) at depths of approximately 3 km by CO2 and organic acids originating from kerogen maturation in source rocks was proposed in 1970s to 1980s (Schmidt and McDonald 1979a; Surdam et al. 1989; Surdam and Boese 1984) (Fig. 1a). Based on petrographic identification and interpretation, this idea has been prominent in the literature on sandstone diagenesis for about 40 years (Bjørlykke and Jahren 2012; Boggs 2011; Burley 1986; Dutton and Willis 1998; Higgs et al. 2010; Khidir and Catuneanu 2010; Kordi et al. 2011; Schmidt and McDonald 1979a; Shanmugam 1984; Xi et al. 2016; Wilkinson et al. 1997; Yuan et al. 2015a, b, c). At the same time, however, the advent of the deep burial dissolution proposals has caused intense debates (Fig. 1b). The opposing views are centered on the apparent lack of viable geochemical mechanisms by which dissolution and mass transfer could occur in the subsurface rocks (Bjørkum et al. 1998; Bjorlykke 1984; Bjørlykke and Brendsal 1986; Bjørlykke and Jahren 2012; Ehrenberg et al. 2012; Giles 1987; Giles and Marshall 1986; Giles and De Boer 1990; Taylor et al. 2010).

Secondary pores originating from the dissolution of feldspar grains in subsurface rocks are common and easily recognizable (Yuan et al. 2015a, b, c, 2019a, b; Dutton and Loucks 2010; Giles 1987; Taylor et al. 2010). However, even until now, there is still much debate about the reality of the significant dissolution of carbonate cements in buried sandstones (Bjørlykke 2014; Bjørlykke and Jahren 2012; Li et al. 2017; Taylor et al. 2010; Yuan et al. 2013a, b, 2015a, b, c). Recently, rock diagenesis and the significance of secondary pores generated by the burial dissolution of feldspars and carbonate minerals have been reviewed within the constraints of petrography, porosity data, and the openness versus closeness of geochemical systems (Bjørlykke 2014; Bjørlykke and Jahren 2012; Ehrenberg et al. 2012; Taylor et al. 2010; Yuan et al. 2013a, b). These reappraisals showed that burial-induced carbonate dissolution in sandstones and carbonates is commonly insignificant. This conclusion is not new (Ehrenberg et al. 2012); however, the retrospective nature of these new presentations is striking because the subjective idea that up to 20% secondary porosity can be formed by burial dissolution of minerals still persists in some very recent publications (Khidir and Catuneanu 2010; Kordi et al. 2011) and textbooks (Boggs 2011). Particularly, this idea is still prominent with regard to the origin of anomalously high porosity in the deeply buried sandstones in China (Bai et al. 2013; Si and Zhang 2008; Tang et al. 2013; Wang et al. 2013; Yuan et al. 2012; Zhu and Zhang 2009; Zhu et al. 2007).
According to laboratory water–rock interaction experiments, carbonate minerals can be dissolved more easily and to be dissolved much faster than feldspar minerals in open geochemical systems under steady-state conditions far from equilibrium (Bertier et al. 2006; Chen et al. 2008; Liu et al. 2012; Weibel et al. 2011; Yang et al. 1995), and the carbonate minerals seem likely to be the most important minerals for the development of secondary pores in buried sandstones (Giles and Marshall 1986; Schmidt and McDonald 1979a). However, things may be different in closed subsurface sandstone geochemical systems. Based on our studies, we identified four types of selective dissolution assemblages of feldspar and carbonate minerals in different sandstone rocks (Fig. 2), which may have some significant implications for this debate (Fig. 1) (Yuan et al. 2015a, b, c). At the same time, some recent papers presented the dissolution of silicate minerals with no dissolution of carbonate minerals in the Kimmeridge Clay mudstones (Macquaker et al. 2014) and in the Eocene sandstones in the Bohai Bay Basin (Yuan et al. 2015a, b, c). Also, Turchyn and DePaolo (2011) suggested that the dissolution of carbonate minerals in mudstones can be significantly suppressed by the presence of silicate minerals, and the dissolution rate is much smaller even when compared with the already-slow rates typical of carbonate-rich sediments (Turchyn and DePaolo 2011).

Micropetrographic evidence of the dissolution of feldspar and carbonate minerals in sandstone or mudstone rocks. a, b Extensive carbonate cementation and weak feldspar dissolution in buried sandstones in the Dongying Sag, East China (Yuan et al. 2015a, b, c), and in the Potiguar Basin, Brazil (Dos Anjos et al. 2000); c extensive dissolution of calcite with little dissolution of silicate grains in Quaternary marine terrace rocks (after Cavazza et al. 2009); cʹ dissolution of calcite cements, SEM image; d, e extensive dissolution of carbonate cements and feldspar grains, Well Yan16, 1929.4 m, Dongying Sag; f extensive dissolution of carbonates and feldspar grains in buried Miocene sandstones from the Picaroon field, offshore Texas (after Taylor 1990); g, h extensive feldspar dissolution with little dissolution of carbonate cement and detrital carbonate grains, in Well T720, 3535.0 m, Dongying Sag; i extensive feldspar dissolution with little dissolution of detrital carbonate grains, Well T720, 2843.56 m, Dongying Sag; j euhedral ankerite wrapped in Qa-II quartz cements T720, 3535.0 m, Dongying Sag; k Intact ankerite, well Tuo764, 4169.8 m, Dongying Sag; l well-preserved calcisphere and precipitated kaolinite in mudstones of Kimmeridge Clay Formation (Macquaker et al. 2014). F feldspar grains, Q quartz grains, R rock fragment grains, FD feldspar dissolution pores, An ankerite, Cc carbonate cements, Ca carbonate detrital grain, Cd carbonate dissolution pores, Qa quartz overgrowths, sc silicate grains, cv smectitic cement, PF pore-filling calcite
Stimulated by these recent reviews and the selective dissolution phenomena of feldspars and carbonate minerals in buried subsurface sandstones, the objectives of this article are to: (1) provide detailed petrographic evidence of selective dissolution assemblages of feldspars and carbonate minerals in buried sandstones; (2) discuss the significance of burial carbonate dissolution in buried sandstones with the constraints of porosity-depth data, water–rock experiments, and geochemical calculations; and (3) review the literature on the dissolution of carbonate minerals in buried sandstones with petrographic and geochemical constraints.
2 Evidence from the reservoirs
2.1 Petrography
Feldspar grains and carbonate cements are common minerals in subsurface sandstones. As both the feldspar and carbonate minerals can be dissolved by the acids (e.g., CO2 and organic acids) originating from thermal maturation of organic matter, the potential to generate secondary pores in sandstone reservoirs through the dissolution of the feldspar and carbonate mineral has been discussed a great deal. Petrographic evidence has been used to demonstrate the presence of secondary porosity in sandstones (Bjørlykke and Jahren 2012; Giles and Marshall 1986). The porosity related to framework grain dissolution (e.g., feldspars) can be recognized and statistically quantified (Taylor et al. 2010). Though extensive burial dissolution of carbonate cements has been suggested by many researchers (Schmidt and McDonald 1979a; Surdam et al. 1989; Surdam and Boese 1984), intergranular pores without carbonate cements should not be interpreted as secondary porosity unless considerable petrographic evidences of its former presence can be established (Taylor et al. 2010). Experiments under steady-state conditions far from equilibrium illustrate that the dissolution rates of carbonate minerals are much faster than the rate of feldspars. In the natural sandstone rocks, however, things are likely to be more complex. Based on our studies, we identified four types of typical selective dissolution assemblages of feldspar and carbonate minerals in sandstone rocks.
-
(1)
Type I: Little feldspar dissolution vs. extensive carbonate precipitation
In buried sandstones and sandstone outcrops, carbonate-cemented concretions are very common (Dos Anjos et al. 2000; Dutton 2008; Gluyas and Coleman 1992; Saigal and Bjørlykke 1987; Wang et al. 2016; Yuan et al. 2015a, b, c). Petrography and relevant stable isotope data usually suggest that the carbonate cements in such concretions formed soon after sediment deposition and prior to the occurrence of the key dissolution period in the rocks (Dutton 2008; Gluyas and Coleman 1992). In such concretions, large amounts of carbonate cements precipitated and preserved both the depositional fabric and the composition of the sand grains with little if any grain replacement. The early carbonate cements occupied almost all primary intergranular pores (Fig. 2a, b) and formed flow barriers (Saigal and Bjørlykke 1987), which led to little dissolution of both the feldspars and the carbonate cements in such concretions during the later burial (Fig. 2a, b). In buried sandstones, the development of such concretions usually occurs near the sandstone–mudstone interface and the thickness of these concretions ranges from centimeters to several meters (Dutton 2008; Gluyas and Coleman 1992; Mcbride and Milliken 2006).
-
(2)
Type II: Little feldspar dissolution vs. extensive carbonate dissolution
In buried sandstones, the phenomenon of little feldspar dissolution versus extensive carbonate dissolution is rare and few publications have ever reported on it. However, one paper reported on the extensive dissolution of early calcite cements (Fig. 2c, cʹ) in Quaternary beach deposits by meteoric water during periods of falling of sea levels (Cavazza et al. 2009). The microphotograph suggests little dissolution of the associated silicate minerals (Fig. 2c). The associated silicate minerals were dissolved much less extensively than the calcite cements, probably due to the short geological time period and the low temperature in the meteoric diagenetic environment (Cavazza et al. 2009). These observations are consistent with the laboratory experiments under steady-state conditions far from equilibrium in which calcite can be dissolved more easily than silicate minerals (Chen et al. 2008; Liu et al. 2012; Weibel et al. 2011).
-
(3)
Type III: Extensive feldspar dissolution and extensive carbonate dissolution
In buried sandstones, the dissolution of feldspar and carbonate minerals has been suggested as common occurrence by many authors (Schmidt and McDonald 1979a, 1979b; Surdam et al. 1989; Surdam and Boese 1984). Little convincing petrographic evidence, however, has been reported to support the coexistence of extensive feldspar dissolution and extensive carbonate dissolution in buried sandstones. One typical example was provided by Taylor (1990, 1996), who presented a striking and convincing microphotograph to show the dissolution of carbonate cements and detrital carbonate grains at Picaroon field (Fig. 2f) (Taylor 1990, 1996; Taylor et al. 2010). In the microphotographs, we can also identify the dissolution of feldspar grains (Fig. 2f). Another example we have identified is the Es3 sandstones from well Yan 16 in the Mingfeng area, Dongying Sag. In the thin sections from Well Yan16, we observed the typical dissolution of feldspar grains and ferroan calcite cements in the sandstones of the middle Es3 Formation (Fig. 2d, e). These sandstones are located close to some faults, which connect to the unconformity that developed at the end of the Eocene period. In these thin sections, the remnants of ferroan calcite cements were irregular and developed dissolved pores (Fig. 2d, e). The low-oxygen isotope data (− 15.02‰pdb ~ − 17.20‰pdb) of the ferroan calcite cements and the maximum depth (1920 m–1960 m with temperatures of 75–80 °C) suggest that the fluid that formed these carbonate cements had negative δ18O data (lower than − 8‰SMOW) (Matthews and Katz 1977), which support massive meteoric water flux in these sandstones (Fayek et al. 2001; Harwood et al. 2013).
-
(4)
Type IV: Extensive feldspar dissolution vs. little carbonate dissolution
Macquaker et al. (2014) reported the fabric observation of kaolinite precipitation (byproduct of the dissolution of aluminosilicate minerals) and no dissolution of the associated calcareous textures (Fig. 2l) in the Kimmeridge Clay Formation mudstones and regarded the phenomenon as surprising and significant (Macquaker et al. 2014). In both mudstones and sandstones, such phenomena have not yet received much attention, although they were mentioned in some publications (Armitage et al. 2010; Baker et al. 2000; Ceriani et al. 2002; Dos Anjos et al. 2000; Dutton and Land 1988; Fisher and Land 1987; Girard et al. 2002; Hendry et al. 1996; Milliken et al. 1994; Salem et al. 2000; Tobin et al. 2010). Using thin sections and scanning electron microscopy (SEM) from samples from the northern steep slope zone of the Dongying Sag, we identified the phenomena of typical extensive dissolution of feldspar grains with no/little dissolution of carbonate cements and detrital carbonate grains in the lower Es3 Formation and the Es4 Formation (Fig. 2g–k). The carbonate cements occurred as connected patches (Fig. 2a), single crystals (Fig. 2j, k) or grain-coating carbonate (Fig. 2g, h), and individual crystals commonly exhibited euhedral crystals faces abutting open pore space (Fig. 2k). The euhedral ankerite engulfed by the stage-II quartz overgrowths (Fig. 2j) suggests that the carbonate minerals were not leached when the stage-II feldspar dissolution and quartz cementation occurred in the acidic geochemical system. In addition, the detrital carbonate grains and grain-coating carbonate cements show no evidence of dissolution (Fig. 2g–i); moreover, carbonate overgrowths are often found accompanying the detrital carbonate grains. However, the feldspar grains engulfed by early grain-coating carbonate cements or close to detrital carbonate grains are dissolved extensively (Fig. 2g–i).
Overall, petrography textures suggest that carbonate mineral dissolution is not likely to occur all the time. Only in two cases, extensive carbonate dissolution in the sandstone reservoirs is likely to occur.
2.2 Porosity-depth data
The porosity evolution model proposed by Schmidt and McDonald (Fig. 1a) was initially accepted and embraced by many geologists (Bjørlykke and Jahren 2012; Boggs 2011; Burley 1986; Dutton and Willis 1998; Higgs et al. 2010; Khidir and Catuneanu 2010; Schmidt and McDonald 1979a; Shanmugam 1984; Wilkinson et al. 1997) to explain the fairly common occurrence of intergranular porosity in sandstone buried to significant depth. However, as a general rule, global porosity-depth data show a steady decrease in the sandstone P50, P10, and the maximum porosity trends as the depth increases (Fig. 3) (Ehrenberg et al. 2009; Ehrenberg and Nadeau 2005), which is inconsistent with the porosity evolution model proposed by Schmidt and McDonald in 1979 (Fig. 1a).

(after Ehrenberg and Nadeau 2005)
Porosity versus depth profile for global petroleum sandstone reservoirs. Statistical trends consist of P90 (90% of reservoirs have a porosity greater than this value), P50 (median), and P10.
Although anomalously high porosities do exist in some deeply buried sandstones (Bloch et al. 2002; Warren and Pulham 2001), studies on the origin of the anomalously high porosities suggest that the dissolution of grains or preexisting cements are just one subordinate aspect of this porosity. These anomalously high porosities can be attributed to early emplacement of hydrocarbons (Bloch et al. 2002; Gluyas et al. 1993; Wilkinson and Haszeldine 2011), fluid overpressure, or grain coats and grain rims (Bahlis and De Ros 2013; Bloch et al. 2002; Ehrenberg 1993); the mixture of porosity of rocks with different lithology from shallow to deep depths may also lead to the occurrence of anomalously high porosities in a porosity-depth profile (Bjørlykke 2014; Bjørlykke and Jahren 2012).
The Eocene sandstones in the northern steep slope zone in the Dongying Sag are an example exhibiting the impact of fluid overpressure, hydrocarbon emplacement, and mineral dissolution. Detailed geological settings are available in some papers (Cao et al. 2013; Guo et al. 2010, 2012; Yuan et al. 2013a, b). Subaqueous fans and lacustrine fans were deposited in the Eocene Es x4 –Es z3 Formations in the northern steep slope zone together with contemporary organic-rich mudstones and shales. The development of anomalously high porosities in the reservoirs has been reported (Cao et al. 2014). In this paper, two types of porosity-depth profiles were plotted and presented, using the 7936 core porosity data collected from the Shengli Oilfield Company. The lithology and oil-bearing properties of these samples were analyzed with core-logging materials. The fluid pressure relevant to these samples was analyzed using the equivalent depth method (Gao et al. 2008) using acoustic logging data with the constraint of the measured formation fluid pressure. And a database of the reservoir properties was established using the information of the porosity, depth, lithology, oil-bearing properties, and fluid pressure data. Type-A porosity-depth profiles were plotted using the porosity data of all reservoir samples (Fig. 4a1), and the porosity data of each individual lithology (Fig. 4a2–a7). Type-B porosity-depth profiles were plotted using the porosity data of the samples with normal pressure and low oil-bearing saturation (oil-free, oil trace, fluorescence, and oil patch), and the porosity data of the samples with overpressure and (or) with high oil-bearing saturation were not employed in the Type-B profiles. The Type-A porosity-depth profiles of the combined lithology (Fig. 4a1) show that anomalously high porosities do exist at the depth intervals of 2.8–3.7 km and 3.9–4.4 km, and the porosity-depth profiles of each individual lithology also show the existence of anomalously high porosities in some specific depth intervals (Fig. 4a2–a7). However, the Type-B porosity-depth profiles (Fig. 4b1–b7) show no existence of the anomalously high porosities when the impact of the fluid overpressure and hydrocarbon emplacement on the reservoir porosity was removed. This analysis suggests that even where anomalously high porosities exist in deeply buried reservoirs, significant dissolution of carbonate cements may not be the cause. This is consistent with the petrographic evidence of selective dissolution of feldspar in the presence of carbonate minerals and the precipitation of authigenic clays and quartz cements following the feldspar dissolution in these rocks (Yuan et al. 2013a, b).

Porosity-depth profiles of the sandstone reservoirs in the northern steep slope in the Dongying Sag. a1 Porosity versus depth profiles for the combined lithology; a2–a7 porosity versus depth profiles for a single lithology; b1 porosity versus depth profiles for combined lithology with normal pressure and low hydrocarbon saturation; b2–b7 porosity versus depth profiles for single lithology with normal pressure and low hydrocarbon saturation. The dashed blue lines in a1–a7 are the same as the solid blue lines in b1–b7
3 Water–rock experiments
3.1 Samples and methods
Pure calcite crystals were crushed, and the calcite grains with a size of 2–4 mm were selected. In each experiment, one grain with a polished surface was employed to investigate the dissolution features after the experiments. The grains were ultrasonically cleaned with analytical-grade distilled water three times to remove submicron-to-micron-sized particles adhering to the grains. The calcite grains were dried at 60 °C for 12 h and examined with a Coxem-EM-30 plus scanning electron microscope (SEM) to check the total removal of the small particles. Calcite grain samples were prepared using a high-precision electronic balance (error < 0.005 g). High salinity waters with different salinity were prepared with 99.99% NaCl, 99.99% CaCl2, and deionized water (DW). Glacial acetic acid with a purity of more than 99.5% was used to prepare acidic water with different pH.
The detailed experiment conditions are listed in Table 1. The calcite dissolution experiments at different temperatures (20 °C, 90 °C) were conducted in Hastelloy Reactors. For experiments with participation of CO2, CO2 gas with a purity of more than 99.995% was injected into the reactor by pumping to reach the designed \(p_{{\text{CO}}_2}\) of 50 bar. The experiments were conducted for 3, 8, and 15 days, respectively. After the experiments at 20 °C, the calcite grains were separated from the water quickly, while for the experiments at 90 °C, the reactor was firstly cooled to approximately 20 °C using cold water in less than 1 h, and then, the calcite grains were separated from the water. The water pH was tested after the separation of the water from minerals. The reacted calcite minerals were cleaned in DW three times to remove possible salt precipitated on the mineral surfaces. And the reacted calcite minerals were weighed after being dried at 60 °C for 12 h.
3.2 Experimental results and geological implication
The weight loss and relevant volume changes of the calcite minerals are presented in Table 1. The experiments A1–A3 demonstrate that low pH water with acetic acid (pH = 3.93–3.98) can dissolve calcite at 20 °C. As the water salinity and the Ca2+ concentration in water increase, the dissolution capacity of the acidic water decreases dramatically. Even with a high water/rock volume ratio (45:1), the ratio between the mass loss after dissolution and the primary weight of the calcite mineral prior to the experiments suggests that only a small amount of calcite was dissolved, and this can only have resulted in a few secondary pores in the calcite grains (less than 1%); even the dissolved calcite was not re-precipitated (Fig. 5). The results of the experiments D1–D7 at 90 °C show a similar trend.

SEM microphotographs of the calcite grain surfaces prior to and after the experiments. a, b Smooth surface of the polished calcite grain, some intercrystal pores can be identified occasionally (b); c, d dissolution of the polished calcite surface after dissolution experiments
The results of the experiments B1–B3 show that deionized water and saline water with a partial pressure of CO2 (\(p_{{\text{CO}}_2}\)) at 50 bar can dissolve calcite at 20 °C. A comparison of the results of the experiments B2 and B3 shows a decrease in the corrosion ability of the acidic water as the salinity increases. A comparison between the results of the experiments B1 and B3 shows that the calcite–CO2 interactions reached dynamic equilibrium in 8 days (maybe in an even shorter time) after the dissolution of 0.212 g calcite and a longer (15 days) exposure of calcite to the CO2-charged water did not result in more dissolution. This result indicates that in a relative closed geochemical system with a fixed \(p_{{\text{CO}}_2}\), the available water volume dominates the dissolution volume of the calcite, even if CO2 is available in sufficient quantities. Also, with a high water/rock volume ratio (45:1 or 90:1), only a small amount of calcite (less than 2%) was dissolved by the CO2-rich water.
A comparison of the results of the experiments C1, A3, and B1 shows that the coexistence of acetic acid and CO2 in saline water promotes more calcite dissolution than with only acetic acid or CO2 in the saline water. However, no more than 2.5% of the calcite was dissolved in the C1 experiments. Overall, the experiments with a high water/rock volume ratio, low pH, and sufficient CO2 resulted in the dissolution of only a small amount of calcite.
As low temperature, low pH, high \(p_{{\text{CO}}_2}\), and high water/rock ratio cannot generate a large volume of secondary pores by the dissolution of carbonate minerals, it is not likely that extensive carbonate dissolution will occur in buried sandstone geochemical systems with high temperature and low water/rock ratio. Many studies on water–rock interaction experiments also support this idea when the data were analyzed quantitatively, although dissolution does take place at low/high temperatures (Weibel et al. 2014). In addition, the dissolved carbonate minerals were commonly reported to be re-precipitated in long-term numerical simulation experiments (Bertier et al. 2006; Liu et al. 2012). As the initial pH values (< 4) of the waters used in the experiments were much lower than those of most formation waters and the water/rock ratios were much higher than those in subsurface rocks (Birkle et al. 2009; Birkle et al. 2002; Egeberg and Aagaard 1989; Frape et al. 1984; Surdam et al. 1985), we conclude that the calcite dissolution in deeply buried sandstones without a favored pathway (e.g., faults) is likely to be weaker than in the experiments.
4 Aggressive fluids and mass transfer in sediments
4.1 Pyrolysis experiments of kerogen
Hydrous and anhydrous pyrolysis experiments with pure kerogen or source rocks have been used to investigate the maturation of organic matter in source rocks with respect to the generation of organic acids and CO2 (Barth et al. 1988; Barth et al. 1996; Barth and Bjørlykke 1993). Using worldwide source rocks and different types of kerogens with various total organic carbon (TOC) contents and different maturities, more than 110 pyrolysis experiments have been conducted in the last 40 years to analyze the yield of organic acids and CO2 during kerogen maturation (Table 2) (Barth et al. 1988; Barth et al. 1996; Barth and Bjørlykke 1993; Chen et al. 1994; Kawamura et al. 1986; Kawamura and Kaplan 1987; Meng et al. 2008; Zeng et al. 2007; Zhang et al. 2009). The results of the experiments demonstrate that the maximum yield of acetic acids and total organic acids (TOA) is 0.685 × 10⁻³ mol/g TOC and 1.34 × 10⁻³ mol/g TOC, respectively. The experiments with the acetic acids yield more than 0.5 × 10⁻³ mol/g TOC account for only approximately 5% of the total experiments, and the experiments with the TOA yield more than 0.6 × 10⁻³ mol/g TOC account for 10% of the total experiments. In the pyrolysis experiments, CO2 has a yield equivalent to (0.30–10.9) × 10−3 mol/g TOC, which is higher than that of the organic acids. Commonly, high TOC and high maturation result in low yields of organic acids and CO2 of one unit kerogen.
4.2 Acids in pore water
The dissolution of feldspar grains is a natural consequence of water–rock interactions under conditions of increasing burial depth and temperatures (Giles and De Boer 1990; Taylor et al. 2010). Although organic acids and CO2 were commonly suggested as the cause of feldspar dissolution (Giles and De Boer 1989; Schmidt and McDonald 1979a; Surdam et al. 1989; Surdam and Boese 1984), Giles and De Boer (1990) suggested that no unusual or special source of acidic pore fluids is required for this dissolution process (Giles and De Boer 1990). To dissolve carbonate minerals characterized by retrograde solubility (Giles and De Boer 1989), however, there must be a supply of a large amount of acidic water that has the capacity to provide H+.
-
(1)
Various organic acids from kerogens are present in most of the formation waters in petroliferous basins. Acetic acid with a relative content of approximately 80% dominates the organic acids in most cases (Surdam and Crossey 1987; Surdam et al. 1989; Surdam and Boese 1984). It was suggested by Surdam et al. (1984, 1987, 1989) and Meshri (1986) that organic acids were more aggressive than CO2 and could be responsible for the dissolution of silicate and carbonate minerals (Meshri 1986; Surdam and Crossey 1987; Surdam et al. 1989; Surdam and Boese 1984). The leaching of calcite by acetic acid can be expressed as CaCO3 + CH3COOH—Ca2+ + HCO3− + CH3COO−. Using the data of the concentration of organic acid in oilfield waters, Surdam (1984, 1987) further suggested that large volumes of water-soluble organic acids are generated during the thermocatalytic degradation of kerogen in the range of 80–120 °C and the concentration of organic acids can even reach up to 10000 ppm (Surdam et al. 1989; Surdam and Crossey 1987; Surdam and Boese 1984). The concentrations of organic acids are lower when the temperatures are below 80 °C or above 120 °C due to the bacterial destruction and thermal destruction of the short-chained organic acids, respectively (Surdam et al. 1989; Surdam and Crossey 1987). The concentration data of the organic acids in the formation waters from global petroleum sandstone reservoirs show that more than 90% of the pore waters contain organic acids at concentrations less than 3000 mg/L (Fig. 6a) (Cai et al. 1997; Fisher 1987; Kharaka 1986; MacGowan and Surdam 1988; Meng et al. 2006; Meng et al. 2011; Surdam et al. 1989; Surdam and Crossey 1987; Wang et al. 1995, 2007; Xiao et al. 2005). In the petroliferous basins in China, the concentrations of organic acids in the formation waters are usually less than 2500 mg/L (Fig. 6b). With high geothermal gradients (around 35 °C/1 km), the highest concentrations of organic acids developed at the depth of 1500–3500 m in the basins in East China; in contrast, the highest concentrations developed at the depth of 4500–6000 m in the basins in West China with low geothermal gradients (approximately 20 °C/1 km) (Fig. 6b) (Cai et al. 1997; Fisher 1987; Kharaka 1986; MacGowan and Surdam 1988; Meng et al. 2006; Meng et al. 2011; Surdam et al. 1989; Surdam and Crossey 1987; Wang et al. 1995, 2007; Xiao et al. 2005).
Fig. 6 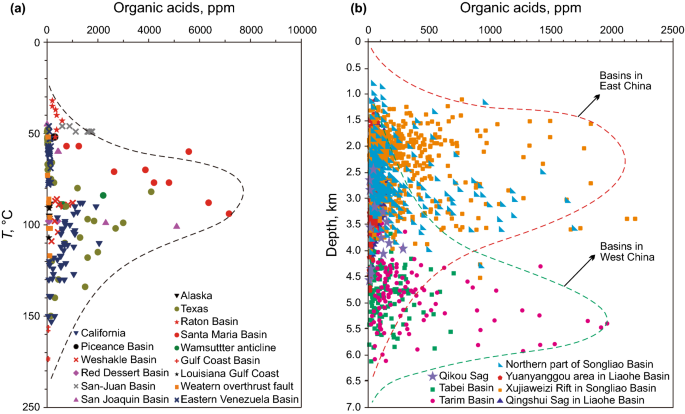
(data from Kharaka 1986; Fisher 1987; Surdam and Crossey 1987; MacGowan and Surdam 1988; Surdam et al. 1989; Wang et al. 1995; Cai et al. 1997; Xiao et al. 2005; Meng et al. 2006; Wang et al. 2007; Meng et al. 2011)
Concentrations of organic acids in the pore water of sandstone reservoirs in oil and gas basins. a Organic acids in global sedimentary basins; b organic acids in sedimentary basins in China.

In rocks with a high mudstone/sandstone ratio (e.g., 10:1), about 60 mol of acetic acids can be produced in 1 m3 source rocks if an average TOC of 5% in the mudstone and an organic acid yield of 0.5 × 10⁻³ mol/g TOC (Table 2) are available in the source rocks. Because organic acids concentrate at temperatures of 80–120 °C, most organic acids are assumed to be released from the source rocks to the reservoirs in the depth interval of 1500–4000 m. From 1500–4000 m, the sandstone porosities generally decrease from 35% to 15% and the mudstone porosities decrease from 20% to 5% (Gluyas and Cade 1997; Pittman and Larese 1991; Ramm 1992). As organic acids are water soluble (Barth and Bjørlykke 1993), we assume that all the pore water expelled from the mudstones to the sandstone reservoirs have a high concentration of organic acids (10,000 ppm acetic acid). In this case, the organic acids expelled to the reservoirs can dissolve only 0.46% volume of calcite with a thorough consumption of the available acids. In another case, if diffusion or hydrocarbon migration can transport more organic acids to the sandstone reservoirs (Barth and Bjørlykke 1993; Thyne 2001), only 2% volume of calcite can be dissolved in the sandstone reservoirs. The organic acids are weak acids and the equilibrium constant of the calcite-leaching reaction by organic acids decreases from 8.5 × 10⁻⁴ at 25 °C to 7.9 × 10⁻⁵ at 100 °C (Giles and Marshall 1986). Under constraints of the equilibrium constant, the calcite volume that can be dissolved in the reservoirs is reduced significantly. In addition, most source rocks contain considerable carbonate minerals and silicate minerals (Ehrenberg et al. 2012; Giles and Marshall 1986; Taylor et al. 2010); these minerals first consume some of the organic acids generated in the mudstones, which also decreases the volume of acids expelled to the reservoirs and the leaching ability of the organic acids in the reservoirs (Barth et al. 1996; Barth and Bjørlykke 1993).
-
(2)
CO2 is present in most oil-gas sandstone reservoirs, though most natural gas accumulations contain less than 10% CO2 (Seewald 2003). It was suggested by Smith and Ehrenberg (1989), Ribstein et al. (1998), and Seewald (2003) that the CO2 content in natural gases generally increases with increasing temperature and burial depth, and the \(p_{{\text{CO}}_2}\) increases systematically in the temperature range from 40 to 200 °C (Fig. 7) (Curtis 1978; Ribstein et al. 1998; Schmidt and McDonald 1979a; Seewald 2003; Smith and Ehrenberg 1989). The CO2 in the reservoirs originates from the degradation of organic matter or from water–rock interactions (Curtis 1978; Ribstein et al. 1998; Schmidt and McDonald 1979a; Seewald 2003; Smith and Ehrenberg 1989). In the range of 80–120 °C, the release of CO2 from kerogen in the source rocks is inevitably one important source and it was suggested by Schmidt (1979a, b), Surdam (1984), and Surdam and Crossey 1987) that this CO2 source is one of the most important carbonic acids for carbonate dissolution (Schmidt and McDonald 1979a; Surdam and Crossey 1987; Surdam and Boese 1984). Because of the constraints of the mass balance calculation, Lundegard et al. (1984) suggested that even if all the CO2 generated from kerogen was expelled from the source rocks to the sandstones, only 1%–2% of secondary porosity could be generated (Lundegard et al. 1984).
Fig. 7 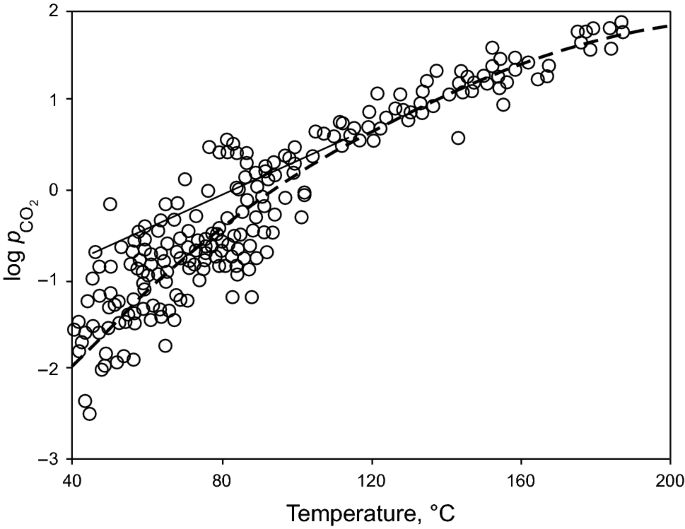
Partial pressure of CO2 (\(p_{{\text{CO}}_2}\)) in sedimentary basins (after Coudrain-Ribstein et al. 1998). The dashed line represents CO2 fixed by equilibrium between calcite, dolomite, chlorite, kaolinite, and chalcedony (Coudrain-Ribstein et al. 1998). The solid line represents fitted line for US Gulf Coast data after Smith and Ehrenberg (1989)

In contrast to Schmidt (1979a, b) and Surdam (1984), Smith and Ehrenberg (1989) proposed that the increased CO2 abundance results in precipitation rather than dissolution of carbonate minerals at the depth interval with temperature ranging from 80°C to 120 °C, in which the organic acids have the highest concentrations and control the alkalinity of the carbonate–silicate–organic acid–carbonic acid–\(p_{{\text{CO}}_2}\) system.
Using numerical simulations with the constraints of thermodynamics, Huang et al. (2009) calculated the pH values of different carbonate–H2O–CO2 geochemical systems in the equilibrium state (Fig. 8a) and the dissolution/precipitation volumes of the calcite or dolomite minerals in these systems at temperatures of 28–235 °C, pressure of 1–70 MPa, depth of 1–7 km, and a specific molar content of CO2 (Fig. 8b–d). The results show that the systems with a higher CO2 content have lower pH values and this results in the dissolution of more carbonate minerals at depths shallower than 2000 m. At depths deeper than 2000 m, however, more carbonate minerals are precipitated in the systems with more CO2, even if the systems have lower pH values of approximately 4.8 (Fig. 8) (Huang et al. 2009). Using laboratory water–rock interaction experiments, Song and Huang (1990) also demonstrated that calcite can be precipitated even when the pH is lower than 5 (Song and Huang 1990).

(after Huang et al. 2009)
a Plot of pH values versus depth for CaCO3–H2O–CO2 equilibrium systems with different CO2 contents; b–d volume increment of calcite and dolomite by per liter liquid (V) versus depth for CaCO3–H2O–CO2, CaMg(CO3)2–H2O–CO2 systems, the CO2 mol fractions are 0.1%, 1%, and 10%, respectively, after the systems reached equilibrium.
As carbonate minerals are characterized by retrograde solubility, cooling of hot fluids have been suggested to dissolve carbonate minerals during the uplift stage of the formation or during injection of deep hot water to shallow formations. Using numerical simulations with the constraints of thermodynamics, Yuan et al (2015a, b, c) modeled the calcite dissolution in two systems with temperature decreasing from 200 °C to 50 °C (Fig. 9). In the system with fixed \(p_{{\text{CO}}_2}\) (223 bar) during the cooling processes, 1 kg of water may dissolve 5.01 g calcite (Case-1), while in the system when \(p_{{\text{CO}}_2}\) decreases from 223 bar at 200 °C to 0.32 bar at 50 °C (according to the equation log \(p_{{\text{CO}}_2}\) = −1.45 + 0.019 T) (Smith and Ehrenberg 1989), 1 kg of water can dissolve only 0.027 g calcite (Case-2). In such cases, the pore water in sandstones with 20% porosity can only dissolve calcite (with specific gravity of 2.7 g/cm3) to increase porosity by 0.037% and 0.0002%, respectively, with the occurrence of retrograde dissolution.

Numerical simulation results of the cooling of hot fluids from 200 to 50 °C in a calcite–CO2–H2O system with initial log (\(p_{{\text{CO}}_2}\)) values of 2.35. Case-1: Simulation was conducted with a fixed \(p_{{\text{CO}}_2}\); Case-2: Simulation was conducted with a variable \(p_{{\text{CO}}_2}\) (Yuan et al. 2015a, b, c)
4.3 Buffer system and pH needed for burial carbonate dissolution
Diagenetic reactions in intermediate to deep burial regimes are mutually rock buffered (Bjørlykke and Jahren 2012; Hutcheon and Abercrombie 1990; Macquaker et al. 2014; Smith and Ehrenberg 1989; Taylor et al. 2010; Turchyn and DePaolo 2011). The carbonate minerals were commonly suggested to react faster with acids than the aluminosilicate minerals (Bjørlykke and Jahren 2012). In the buried aluminosilicate–carbonate mineral–acid system, however, Smith and Ehrenberg (1989), Hutcheon and Abercrombie (1990), and Turchyn and DePaolo (2011) suggested that the aluminosilicate minerals–water interaction rather than the carbonate mineral–water reaction was the main acid-buffering mechanism (Bjørlykke and Jahren 2012; Hutcheon and Abercrombie 1990; Macquaker et al. 2014; Smith and Ehrenberg 1989; Taylor et al. 2010; Turchyn and DePaolo 2011). The buffer intensity of silicate minerals can be ten times that of calcite in an acidic system at high temperature (Hutcheon and Abercrombie 1990). The pH of most current oil–gas waters is higher than 5.5 due to the buffering effect of various aluminosilicate mineral–water interactions (Birkle et al. 2009; Birkle et al. 2002; Egeberg and Aagaard 1989; Frape et al. 1984; Surdam et al. 1985), and the extensive dissolution of carbonate minerals is unlikely in reservoirs with such a relative weaker acidity. This concept is a rather radical departure from the conventional system, but it is now being verified by the significant fabric observation of extensive feldspar dissolution and no/little carbonate dissolution in many buried sandstones (Armitage et al. 2010; Baker et al. 2000; Ceriani et al. 2002; Dos Anjos et al. 2000; Dutton and Land 1988; Fisher and Land 1987; Girard et al. 2002; Hendry et al. 1996; Milliken et al. 1994; Salem et al. 2000; Tobin et al. 2010) and some mudstones (Macquaker et al. 2014; Turchyn and DePaolo 2011). Yuan et al. (2015a, b, c) proposed the mechanism of selective dissolution of feldspars in the presence of carbonate minerals to generate secondary minerals in buried sandstones by organic-original CO2 (Yuan et al. 2015a, b, c). In addition, the dissolution of feldspars can, in turn, promote the precipitation of carbonate minerals (Tutolo et al. 2015). The C–O isotopic data of carbonate cements developed in subsurface rocks suggest the generation of organic-derived and inorganic-derived CO2. The most carbon in these various types of CO2, however, is subsequently sequestered by the precipitation of carbonate cements in both source rocks and reservoirs (Curtis 1978; Giles and Marshall 1986; Seewald 2003).
4.4 Mass transfer problem
In order to generate enhanced secondary porosity, the solutes (Ca2+, Mg2+, HCO3−, CO32−) released by the dissolution of carbonate minerals need to be removed from the dissolution zone in the sandstone reservoirs (Bjørlykke and Jahren 2012; Ehrenberg et al. 2012; Giles 1987; Taylor et al. 2010). Advection, diffusion, and convection are the three possible mechanisms that control the mass transfer in the sedimentary basins. However, none of the advective, diffusive, or convective mass transfer supports significant transfer of the solutes released from carbonate dissolution in the buried sandstones without favorable flow conduits (e.g., faults and fractures) in the mesodiagenetic stage (Bjørlykke and Jahren 2012; Ehrenberg et al. 2012; Giles 1987; Taylor et al. 2010).
-
(1)
Advective transfer
Mass transport of a component by the advective flow in subsurface porous rocks can be expressed by
where qA is the advective flux of the species, q is the specific discharge, and C is the component’s concentration. The solubility of calcite is a function of the \(p_{{\text{CO}}_2}\) and temperature in the burial sediments, and the calcite solubility is less than 0.01 mol/L in systems at temperatures ranging from 80 °C (with 1 bar \(p_{{\text{CO}}_2}\)) to 160 °C (20 bar \(p_{{\text{CO}}_2}\)) (Giles and De Boer 1989). Assuming that a set of sediments has a mudstone/sandstone ratio of 10:1 and the mudstone porosity decreases from 20% to 5% as the burial depth increases from 2000 m to 4000 m (Pittman and Larese 1991), all the water in the mudstone units would be expelled to the sandstone units. The water from the mudstone, even with very low salinity, can dissolve and remove only approximately 0.05% volume of the calcite mineral in the sandstone units under the mechanism of advective flow.
-
(2)
Diffusive transfer
Mass transport by diffusion (Mt) in porous rocks can be expressed by Fick’s law:
where Mt is the diffusion flux, D0 is the diffusion coefficient of solutes in water (cm2/s), C is the component’s concentration, and θ2 is the tortuosity factor of the sedimentary rock.
Tortuosity is generally a ratio of pore connectivity length to sediment sample length; thus, its value is always greater than 1. In porous sedimentary rocks, the tortuosity of the flow path is determined by porosity, permeability, and pore structure. Tortuosity can be expressed by Archie’s equation (Archie 1942) as:
where η is an adjustable exponent (Boudreau 1996). The empirical fit value of η reported by Boudreau (1996) is 2.14 ± 0.03, with an average value of 2.14. Diffusion in a porous sediment system is much slower than in an equivalent volume of water because the convoluted path the solutes must follow to circumvent sediment particles (Boudreau 1996).
The pore water composition in the middle-deep buried sandstones is generally close to saturation with respect to most minerals after long-term contact of the pore water and minerals. The solute concentration gradients (Ca2+, Mg2+, HCO −3 , CO 2−3 ) are generally very low in the sandstone beds with relative homogeneous composition (Bjørlykke 2014; Bjørlykke and Jahren 2012), which prevents the large-scale diffusive transfer of these masses, even in a long geological time.
-
(3)
Convective transfer
Thermal convection is a potential mechanism for mass transfer in buried sandstones with high porosity and permeability. Mathematical calculations of thermal convection, however, demonstrated that even thin interbedded layers of mudstones within permeable sandstone sequences will split potentially larger convection cells into smaller units of sandstone beds which may then be too small to exceed the critical Rayleigh number. After extensive compaction and cementation, convective circulation of pore water is not likely to occur in the sandstone beds with interbedded mudstones characterized by extremely low porosity and low permeability (Bjørlykke 1993; Bjørlykke et al. 1988), particularly after the formation of tight marginal cemented barriers formed by precipitation of eodiagenetic carbonate cements in the marginal sandstones close to the mud/sand surfaces (Saigal and Bjørlykke 1987).
Overall, large-scale carbonate dissolution is not supported by any of the mass transfer mechanisms in buried geochemical systems without favorable flow conduits.
5 Published examples of carbonate dissolution in sandstones
Many papers on mineral dissolution in buried sandstones have been published in the last 40 years. After a careful analysis of the included petrography evidence on the dissolution of carbonate minerals, we categorize these publications into three groups.
5.1 Papers lacking convincing petrography evidence but including hypothesis
Schmidt and McDonald (1979a, b) first proposed the idea that significant secondary porosity (up to 20%) can be generated through burial dissolution of carbonate cements by CO2 during the organic maturity stage (Fig. 1) (Schmidt and McDonald 1979a). In their paper, however, no convincing carbonate dissolution phenomena such as the microscope photography in Taylor (1996) or the SEM microphotography in Weedman et al. (1996) and Khidir and Catuneanu (2003) were presented (Khidir and Catuneanu 2003; Schmidt and McDonald 1979b; Taylor 1996; Weedman et al. 1996). Instead, most intergranular pores without carbonate cements were interpreted as secondary pores formed by the dissolution of carbonate cements (Taylor et al. 2010). Based on the CO2/organic acids leaching hypothesis, and the negative relationship between porosity and the amount of carbonate cements in reservoirs, extensive burial dissolution of carbonate minerals has also been suggested by many other authors in the last few decades (Dutton and Willis 1998; Gibling et al. 2000; Harris and Bustin 2000; Higgs et al. 2010; Irwin and Hurst 1983; Khidir and Catuneanu 2010; Kordi et al. 2011; Mcbride 1988; Shanmugam 1984; Wilkinson et al. 1997). Similar to Schmidt and McDonald (1979a, b), no convincing petrography evidence on carbonate dissolution was provided in these publications.
5.2 Papers with convincing petrographic evidence
Some studies with convincing petrographic evidence of the dissolution of carbonate cements in buried sandstones have been published. Review of these works suggests that most of the extensive dissolutions were related to deep hot fluids (Taylor 1996; Taylor et al. 2010) and cold meteoric fresh water (Bouch et al. 2006; Cavazza et al. 2009; Khidir and Catuneanu 2003; Poursoltani and Gibling 2011; Yuan et al. 2017; Zaid 2012), while organic CO2 leaching resulting in very limited dissolution (Lu et al. 2011; Weedman et al. 1996).
-
(1)
Dissolution related to deep hot fluids. Taylor (1996, 2010) presented a striking exception in the deeply buried (4.9–5.2 km) Miocene sandstones in the Picaroon field, offshore Texas. The anomalously high porosities (20%–29%) in the sandstone reservoirs are largely a result of the porosity enhancement by the dissolution of carbonate minerals (Taylor 1996; Taylor et al. 2010). A detailed petrographic study has established evidence for the partial dissolution of pore-filling calcite cements and detrital carbonate grains in the most porous sands (Fig. 2f), and 6%–15% of the calcite cements were estimated to have been removed from the reservoirs. However, the aggressive fluids that leached the cements were not acids originating from kerogen maturation but deep hot fluids with high salinity and high concentrations of Sr, Ba, Fe, Pb and Zn. The Corsair fault systems played a very important role in introducing such hot fluids into the Miocene sandstones. As Taylor et al. (2010) suggested, the geological conditions in the Picaroon field that provide access to deep fluid sources are somewhat extraordinary (Taylor 1996; Taylor et al. 2010).
-
(2)
Dissolution related to meteoric water. Convincing petrographic evidence of carbonate dissolution in sandstones with meteoric freshwater incursion was provided by some studies. The isotopic composition of the carbonate cements or the burial history of the rocks suggests that the dissolutions were induced by meteoric freshwater during the early eodiagenetic stage or the uplift telodiagenetic stage (Bouch et al. 2006; Cavazza et al. 2009; Khidir and Catuneanu 2003; Poursoltani and Gibling 2011; Yuan et al. 2017; Zaid 2012). For example, Khidir and Catuneanu (2003) presented convincing SEM photomicrographs to show the dissolution of carbonate cements in the Scollard sandstones outcrop. The sandstones were not buried at depths where the temperature reached 120 °C, and the δ18O composition of the included calcite cements and relevant calculated water δ18O composition suggested a meteoric origin of the diagenetic fluids. Poursoltani and Gibling (2011) provided an example of the dissolution of carbonate cements in sandstones with developed fault systems that were formed during an uplift period; the calcite cements were suggested to be leached by meteoric water. Cavazza et al. (2009) provided excellent outcrop photographs, microscope photos, and SEM images to show carbonate cement dissolution in the Quaternary marine terraces outcrop sandstones; the dissolution was the leaching result of meteoric flow during the falling period of sea level.
-
(3)
Organic CO2 leaching with weak dissolution. Some authors have presented convincing petrographic evidence of carbonate dissolution that was induced by organic CO2 originating from the thermal evolution of kerogen. The authors, however, also stated that only a small amount of carbonate minerals were dissolved under the constraints of fluid chemistry modeling or mass balance calculation (Lu et al. 2011; Weedman et al. 1996).
Overall, review of the published papers suggests that the extensive dissolution of carbonate minerals in the sandstones was generally attributed to the high flux of deep hot fluids provided via fractures or the meteoric freshwater available during the eodiagenetic and telodiagenetic stages.
5.3 Papers with dissolution of feldspars but no carbonate
Some studies have reported the phenomena of extensive feldspar dissolution in buried sandstones, but the carbonate cements and detrital carbonate grains in the sandstones showed no signs of extensive dissolution (Armitage et al. 2010; Baker et al. 2000; Ceriani et al. 2002; Dos Anjos et al. 2000; Dutton and Land 1988; Fisher and Land 1987; Girard et al. 2002; Hendry et al. 1996; Milliken et al. 1994; Salem et al. 2000; Tobin et al. 2010). For example, Yuan et al (2015a, b, c) presented convincing photomicrographs to show the selective dissolution of feldspar minerals in the presence of carbonate minerals including detrital carbonate grains and early precipitated calcite cements. These carbonate cements display euhedral crystal faces where they border open primary pores, and the detrital carbonate grains show no corroded fabrics that occur in feldspar grains. Aside from the geological examples of buried sandstones, numerical simulation results also demonstrated that the feldspar dissolution induced by carbonic acid in the subsurface sandstones would be accompanied by carbonate precipitation in systems in the long term, and these relevant carbonate cements serve as an analogue of late-stage carbonate cements in the subsurface sandstones (Barclay and Worden 2000; Wilson et al. 2000).
6 Conclusions
-
(1)
Four types of selective dissolution assemblages of feldspar and carbonate minerals can be identified in sandstones. A critical eye must be cast on the identification of mineral dissolution and intergranular secondary pores in sandstones so that possible subjective conclusions can be avoided.
-
(2)
Petrographic data, porosity data, water–rock experiments, geochemical calculations of aggressive fluids, and mass transfer do not support significant mesodiagenetic carbonate dissolution in buried sandstones. A review of relevant publications suggests that the extensive dissolution of carbonate minerals was generally attributed to a high flux of deep hot fluids provided via fractures or the meteoric freshwater available during the eodiagenetic and telodiagenetic stages.
References
Archie GE. The electrical resistivity log as an aid in determining some reservoir characteristics. Trans AIME. 1942;1(146):54–62. https://doi.org/10.2118/942054-G.
Armitage PJ, Worden RH, Faulkner DR, et al. Diagenetic and sedimentary controls on porosity in lower carboniferous fine-grained lithologies, Krechba field, Algeria: a petrological study of a caprock to a carbon capture site. Mar Pet Geol. 2010;27(7):1395–410. https://doi.org/10.1016/j.marpetgeo.2010.03.018.
Bahlis AB, De Ros LF. Origin and impact of authigenic chlorite in the Upper Cretaceous sandstone reservoirs of the Santos Basin, eastern Brazil. Pet Geosci. 2013;19(2):185–99. https://doi.org/10.1144/petgeo2011-007.
Bai R, Zhang JG, Li W, et al. Diagenesis and favorable diagenetic facies of Chang 6 Reservoir in the Zhiluo Oilfield, northern Shanxi. Geol Bull China. 2013;32(5):790–8 (in Chinese).
Baker JC, Havord PJ, Martin KR, et al. Diagenesis and petrophysics of the early Permian Moogooloo sandstone, southern Carnarvon basin, Western Australia. AAPG Bull. 2000;84(2):250–65. https://doi.org/10.1306/c9ebcdbf-1735-11d7-8645000102c1865d.
Barclay SA, Worden RH. Geochemical modelling of diagenetic reactions in a sub-arkosic sandstone. Clay Miner. 2000;35(1):57. https://doi.org/10.1180/000985500546729.
Barth T, Bjørlykke K. Organic acids from source rock maturation: generation potentials, transport mechanisms and relevance for mineral diagenesis. Appl Geochem. 1993;8(4):325–37. https://doi.org/10.1016/0883-2927(93)90002-X.
Barth T, Borgund AE, Hopland AL, et al. Volatile organic acids produced during kerogen maturation—amounts, composition and role in migration of oil. Org Geochem. 1988;13(1):461–5. https://doi.org/10.1016/B978-0-08-037236-5.50053-1.
Barth T, Andresen B, Iden K, et al. Modelling source rock production potentials for short-chain organic acids and CO2: a multivariate approach. Org Geochem. 1996;25(8):427–38. https://doi.org/10.1016/s0146-6380(96)00147-7.
Bertier P, Swennen R, Laenen B, et al. Experimental identification of CO2–water–rock interactions caused by sequestration of CO2 in Westphalian and Buntsandstein sandstones of the Campine Basin (NE-Belgium). J Geochem Explor. 2006;89(1–3):10–4. https://doi.org/10.1016/j.gexplo.2005.11.005.
Birkle P, Rosillo Aragon JJ, Portugal E, et al. Evolution and origin of deep reservoir water at the Activo Luna oil field, Gulf of Mexico, Mexico. AAPG Bull. 2002;86(3):457. https://doi.org/10.1306/61EEDB0C-173E-11D7-8645000102C1865D.
Birkle P, García BM, Milland Padrón CM. Origin and evolution of formation water at the Jujo-Tecominoacán oil reservoir, Gulf of Mexico. Part 1: Chemical evolution and water–rock interaction. Appl Geochem. 2009;24(4):543–54. https://doi.org/10.1016/j.apgeochem.2008.12.009.
Bjørkum PA, Oelkers EH, Nadeau PH, et al. Porosity prediction in quartzose sandstones as a function of time, temperature, depth, stylolite frequency, and hydrocarbon saturation. AAPG Bull. 1998;82(4):637–48.
Bjorlykke K. Formation of secondary porosity: How important is it? Clastic diagenesis. AAPG Mem. 1984;37:277–86.
Bjørlykke K. Fluid flow in sedimentary basins. Sediment Geol. 1993;86(1–2):128–37. https://doi.org/10.1016/0037-0738(93)90137-T.
Bjørlykke K. Relationships between depositional environments, burial history and rock properties. Some principal aspects of diagenetic process in sedimentary basins. Sediment Geol. 2014;301:1–14. https://doi.org/10.1016/j.sedgeo.2013.12.002.
Bjørlykke K, Jahren J. Open or closed geochemical systems during diagenesis in sedimentary basins: Constraints on mass transfer during diagenesis and the prediction of porosity in sandstone and carbonate reservoirs. AAPG Bull. 2012;96(12):2193–214. https://doi.org/10.1306/04301211139.
Bjørlykke K, Brendsal A. Diagenesis of the Brent sandstone in the Statfjord field, North Sea. The Society of Economic Paleontologists and Mineralogists (SEPM) roles of organic matter in sediment diagenesis (SP38) 1986; p. 157–67.
Bjørlykke K, Mo A, Palm E. Modelling of thermal convection in sedimentary basins and its relevance to diagenetic reactions. Mar Pet Geol. 1988;5(4):338–51. https://doi.org/10.1016/0264-8172(88)90027-X.
Bloch S, Lander RH, Bonnell L. Anomalously high porosity and permeability in deeply buried sandstone reservoirs: origin and predictability. AAPG Bull. 2002;86(2):301–28.
Boggs S. Principles of sedimentology and stratigraphy. Cambridge: London Pearson; 2011. p. 583.
Bouch J, Hough E, Kemp SJ, et al. Sedimentary and diagenetic environments of the Wildmoor Sandstone Formation (UK): implications for groundwater and contaminant transport, and sand production. Geol Soc Lond Spec Publ. 2006;263(1):129–53.
Boudreau BP. The diffusive tortuosity of fine-grained unlithified sediments. Geochim Cosmochim Acta. 1996;60(16):3139–42. https://doi.org/10.1016/0016-7037(96)00158-5.
Burley SD. The development and destruction of porosity within Upper Jurassic reservoir sandstones of the Piper and Tartan Fields, Outer Moray Firth, North Sea. Clay Miner. 1986;21(4):649–94. https://doi.org/10.1180/claymin.1986.021.4.14.
Cai CF, Mei BW, Ma T, et al. The source, distribution of organic acids in oilfield waters and their effects on mineral diagenesis in Tarim Basin. Acta Sedimentol Sin. 1997;15(03):105–11 (in Chinese).
Cao YC, Yuan GH, Li XY, et al. Types and characteristics of anomalously high porosity zones in Paleogene mid-deep buried reservoirs in the northern slope, Dongying sag. Acta Pet Sin. 2013;34(4):683–91. https://doi.org/10.7623/syxb201304008.
Cao YC, Yuan GH, Li XY, et al. Characteristics and origin of abnormally high porosity zones in buried Paleogene clastic reservoirs in the Shengtuo area, Dongying Sag, East China. Pet Sci. 2014;11:346–62. https://doi.org/10.1007/s12182-014-0349-y.
Cavazza W, Braga R, Reinhardt EG, et al. Influence of host-rock texture on the morphology of carbonate concretions in a meteoric diagenetic environment. J Sediment Res. 2009;79(6):377–88. https://doi.org/10.2110/jsr.2009.047.
Ceriani A, Di Giulio A, Goldstein RH, et al. Diagenesis associated with cooling during burial: an example from Lower Cretaceous reservoir sandstones (Sirt Basin, Libya). AAPG Bull. 2002;86(9):1573. https://doi.org/10.1306/61EEDD0A-173E-11D7-8645000102C1865D.
Chen CP, Mei BW, Jia FJ. Experimental study on simulation of the generation of low-molecular weight organic acids from source rocks. Geochimica. 1994;23(2):155–60 (in Chinese).
Chen CP, Gu X, Zhou SM, et al. Experimental research on dissolution dynamics of main minerals in several aqueous organic acid solutions. Acta Geol Sin. 2008;82(7):1007–12. https://doi.org/10.3321/j.issn:0001-5717.2008.07.019.
Curtis CD. Possible links between sandstone diagenesis and depth-related geochemical reactions occurring in enclosing mudstones. J Geol Soc. 1978;135(1):107–17. https://doi.org/10.1144/gsjgs.135.1.0107.
Dos Anjos SM, De Ros LF, de Souza RS, et al. Depositional and diagenetic controls on the reservoir quality of Lower Cretaceous Pendencia sandstones, Potiguar rift basin, Brazil. AAPG Bull. 2000;84(11):1719–42. https://doi.org/10.1306/8626c375-173b-11d7-8645000102c1865d.
Dutton SP. Calcite cement in Permian deep-water sandstones, Delaware Basin, west Texas: Origin, distribution, and effect on reservoir properties. AAPG Bull. 2008;92(6):765–87. https://doi.org/10.1306/01280807107.
Dutton SP, Land LS. Cementation and burial history of a low-permeability quartzarenite, Lower Cretaceous Travis Peak Formation, East Texas. Geol Soc Am Bull. 1988;100(8):1271–82. https://doi.org/10.1130/0016-7606(1988)100%3c1271:CABHOA%3e2.3.CO;2.
Dutton SP, Loucks RG. Diagenetic controls on evolution of porosity and permeability in lower Tertiary Wilcox sandstones from shallow to ultradeep (200–6700 m) burial, Gulf of Mexico Basin, U.S.A. Mar Pet Geol. 2010;27(1):69–81. https://doi.org/10.1016/j.marpetgeo.2009.12.010.
Dutton SP, Willis BJ. Comparison of outcrop and subsurface sandstone permeability distribution, lower Cretaceous Fall River Formation, South Dakota and Wyoming. J Sediment Res. 1998;68(5):890. https://doi.org/10.2110/jsr.68.890.
Edmunds WM, Bath AH, Miles DL. Hydrochemical evolution of the East Midlands Triassic sandstone aquifer, England. Geochim Cosmochim Acta. 1982;46(11):2069–81. https://doi.org/10.1016/0016-7037(82)90186-7.
Egeberg PK, Aagaard P. Origin and evolution of formation waters from oil fields on the Norwegian shelf. Appl Geochem. 1989;4(2):131–42. https://doi.org/10.1016/0883-2927(89)90044-9.
Ehrenberg SN. Preservation of anomalously high porosity in deeply buried sandstones by grain-coating chlorite: examples from the Norwegian continental shelf. AAPG Bull. 1993;77(7):1260–86. https://doi.org/10.1306/bdff8e5c-1718-11d7-8645000102c1865d.
Ehrenberg SN, Nadeau PH. Sandstone vs. carbonate petroleum reservoirs: a global perspective on porosity-depth and porosity-permeability relationships. AAPG Bull. 2005;89(4):435–45. https://doi.org/10.1306/11230404071.
Ehrenberg SN, Nadeau PH, Steen Ø. Petroleum reservoir porosity versus depth: Influence of geological age. AAPG Bull. 2009;93(10):1281–96. https://doi.org/10.1306/06120908163.
Ehrenberg SN, Walderhaug O, Bjørlykke K. Carbonate porosity creation by mesogenetic dissolution: Reality or illusion? AAPG Bull. 2012;96(2):217–33. https://doi.org/10.1306/05031110187.
Emery D, Myers KJ, Young R. Ancient subaerial exposure and freshwater leaching in sandstones. Geology. 1990;18:1178–81. https://doi.org/10.1130/0091-7613(1990)0182.3.CO;2.
Fayek M, Harrison TM, Grove M, et al. In situ stable isotopic evidence for protracted and complex carbonate cementation in a petroleum reservoir, North Coles Levee, San Joaquin Basin, California, USA. J Sediment Res. 2001;71(3):444–58. https://doi.org/10.1306/2DC40954-0E47-11D7-8643000102C1865D.
Fisher JB. Distribution and occurrence of aliphatic acid anions in deep subsurface waters. Geochim Cosmochim Acta. 1987;51(9):2459–68. https://doi.org/10.1016/0016-7037(87)90297-3.
Fisher RS, Land LS. Diagenetic history of Eocene Wilcox sandstones, South-Central Texas. Geochim Cosmochim Acta. 1987;51(11):3073–4. https://doi.org/10.1016/0016-7037(86)90104-3.
Frape SK, Fritz P, McNutt RT. Water–rock interaction and chemistry of groundwaters from the Canadian Shield. Geochim Cosmochim Acta. 1984;48(8):1617–27. https://doi.org/10.1016/0016-7037(84)90331-4.
Gao JG, Gao SX, Wang FH, et al. Characteristics of formation pressure and its influences on reservoirs of the fourth member of the Shahejie Formation in Shengtuo area of Dongying Depression. Pet Geol Recovery Effic. 2008;15(1):35–8 (in Chinese).
Gibling MR, Martel AT, Nguyen MH, et al. Fluid evolution and diagenesis of a Carboniferous channel sandstone in the Prince Colliery, Nova Scotia, Canada. Bull Can Pet Geol. 2000;48(2):95–115. https://doi.org/10.2113/48.2.95.
Giles MR. Mass transfer and problems of secondary porosity creation in deeply buried hydrocarbon reservoirs. Mar Pet Geol. 1987;4(3):188–204. https://doi.org/10.1016/0264-8172(87)90044-4.
Giles MR, De Boer RB. Secondary porosity: creation of enhanced porosities in the subsurface from the dissolution of carbonate cements as a result of cooling formation waters. Mar Pet Geol. 1989;6(3):261–9. https://doi.org/10.1016/0264-8172(89)90005-6.
Giles MR, De Boer RB. Origin and significance of redistributional secondary porosity. Mar Pet Geol. 1990;7(4):378–97. https://doi.org/10.1016/0264-8172(90)90016-A.
Giles MR, Marshall JD. Constraints on the development of secondary porosity in the subsurface: re-evaluation of processes. Mar Pet Geol. 1986;3(3):243–55. https://doi.org/10.1016/0264-8172(86)90048-6.
Girard J, Munz IA, Johansen H, et al. Diagenesis of the Hild Brent sandstones, northern North Sea: isotopic evidence for the prevailing influence of deep basinal water. J Sediment Res. 2002;72(6):746–59. https://doi.org/10.1306/040102720746.
Gluyas J, Cade CA. Prediction of porosity in compacted sands. In: Kupecz JA, Gluyas J, Bloch S, editors. Reservoir quality prediction in sandstones and Carbonates. Dhanhran: AAPG Memoir 69; 1997. p. 19–27.
Gluyas J, Coleman M. Material flux and porosity changes during sediment diagenesis. Nature. 1992;356(6364):52–4. https://doi.org/10.1038/356052a0.
Gluyas JG, Robinson AG, Emery D, et al. The link between petroleum emplacement and sandstone cementation. Geol Soc Lond. 1993;4:1395–402. https://doi.org/10.1144/0041395.
Guo X, He S, Liu K, et al. Oil generation as the dominant overpressure mechanism in the Cenozoic Dongying depression, Bohai Bay Basin, China. AAPG Bull. 2010;94(12):1859–81. https://doi.org/10.1306/05191009179.
Guo X, Liu K, He S, et al. Petroleum generation and charge history of the northern Dongying Depression, Bohai Bay Basin, China: Insight from integrated fluid inclusion analysis and basin modelling. Mar Pet Geol. 2012;32(1):21–35. https://doi.org/10.1016/j.marpetgeo.2011.12.007.
Harris RG, Bustin RM. Diagenesis, reservoir quality, and production trends of Doig Formation sand bodies in the Peace River area of Western Canada. Bull Can Pet Geol. 2000;48(4):339–59. https://doi.org/10.2113/48.4.339.
Harwood J, Aplin AC, Fialips CI, et al. Quartz cementation history of sandstones revealed by high-resolution SIMS oxygen isotope analysis. J Sediment Res. 2013;83(7):522–30. https://doi.org/10.2110/jsr.2013.29.
Hendry JP, Trewin NH, Fallick AE. Low-Mg calcite marine cement in Cretaceous turbidites: origin, spatial distribution and relationship to seawater chemistry. Sedimentology. 1996;43(5):877–900. https://doi.org/10.1111/j.1365-3091.1996.tb01508.x.
Higgs KE, Arnot MJ, Browne GH, et al. Reservoir potential of Late Cretaceous terrestrial to shallow marine sandstones, Taranaki Basin, New Zealand. Mar Pet Geol. 2010;27(9):1849–71. https://doi.org/10.1016/j.marpetgeo.2010.08.002.
Huang KK, Huang SJ, Tong HP, et al. Thermodynamic simulation of carbonate-carbon dioxide equilibrium system during diagenetic processes. Acta Pet Sin. 2009;25(10):2417–24 (in Chinese).
Hutcheon I, Abercrombie H. Carbon dioxide in clastic rocks and silicate hydrolysis. Geology. 1990;18:541–4. https://doi.org/10.1130/0091-7613(1990)018%3c0541:CDICRA%3e2.3.CO;2.
Irwin H, Hurst A. Applications of geochemistry to sandstone reservoir studies. Geol Soc Lon Spec Publ. 1983;12(1):127–46. https://doi.org/10.1144/GSL.SP.1983.012.01.13.
Kawamura K, Kaplan IR. Dicarboxylic acids generated by thermal alteration of kerogen and humic acids. Geochim Cosmochim Acta. 1987;51(12):3201–7. https://doi.org/10.1016/0016-7037(87)90128-1.
Kawamura K, Tannenbaum E, Huizinga BJ, et al. Volatile organic acids generated from kerogen during laboratory heating. Geochem J. 1986;20:51–9. https://doi.org/10.2343/geochemj.20.51.
Kharaka YK. Role of organic species dissolved in formation waters from sedimentary basins in mineral diagenesis. The Society of Economic Paleontologists and Mineralogists (SEPM) roles of organic matter in sediment diagenesis (SP38) 1986; p. 111–22.
Khidir A, Catuneanu O. Sedimentology and diagenesis of the Scollard sandstones in the Red Deer Valley area, central Alberta. Bull Can Pet Geol. 2003;51(1):45.
Khidir A, Catuneanu O. Reservoir characterization of Scollard-age fluvial sandstones, Alberta foredeep. Mar Pet Geol. 2010;27(9):2037–50. https://doi.org/10.1016/j.marpetgeo.2010.05.001.
Kordi M, Turner B, Salem AMK. Linking diagenesis to sequence stratigraphy in fluvial and shallow marine sandstones: evidence from the Cambrian-Ordovician lower sandstone unit in southwestern Sinai, Egypt. Mar Pet Geol. 2011;28(8):1554–71. https://doi.org/10.1016/j.marpetgeo.2011.05.003.
Li F, Li W, Yu Z, et al. Dawsonite occurrences related to the age and origin of CO2 influx in sandstone reservoirs: a case study in the Songliao Basin, NE China. Geochem Geophys Geosyst. 2017;18(1):346–68. https://doi.org/10.1002/2016GC006555.
Liu F, Lu P, Griffith C, et al. CO2–brine–caprock interaction: reactivity experiments on Eau Claire shale and a review of relevant literature. Int J Greenh Gas Control. 2012;7:153–67. https://doi.org/10.1016/j.ijggc.2012.01.012.
Lu J, Wilkinson M, Haszeldine RS, et al. Carbonate cements in Miller field of the UK North Sea: a natural analog for mineral trapping in CO2 geological storage. Environ Earth Sci. 2011;62(3):507–17. https://doi.org/10.1007/s12665-010-0543-1.
Lundegard PD, Land LS, Galloway WE. Problem of secondary porosity: Frio Formation (Oligocene), Texas Gulf Coast. Geology. 1984;12(7):399–402. https://doi.org/10.1130/0091-7613(1984)12%3c399:POSPFF%3e2.0.CO;2.
MacGowan DB, Surdam RC. Difunctional carboxylic acid anions in oilfield waters. Org Geochem. 1988;12(3):245–59. https://doi.org/10.1016/0146-6380(88)90262-8.
Machel HG. Bacterial and thermochemical sulfate reduction in diagenetic settings—old and new insights. Sediment Geol. 2001;140(1):143–75. https://doi.org/10.1016/S0037-0738(00)00176-7.
Machel HG, Krouse HR, Sassen R. Products and distinguishing criteria of bacterial and thermochemical sulfate reduction. Appl Geochem. 1995;10(4):373–89. https://doi.org/10.1016/0883-2927(95)00008-8.
Macquaker JHS, Taylor KG, Keller M, et al. Compositional controls on early diagenetic pathways in fine-grained sedimentary rocks: implications for predicting unconventional reservoir attributes of mudstones. AAPG Bull. 2014;98(3):587–603. https://doi.org/10.1306/08201311176.
Matthews A, Katz A. Oxygen isotope fractionation during the dolomitization of calcium carbonate. Geochim Cosmochim Acta. 1977;41(10):1431–8. https://doi.org/10.1016/0016-7037(77)90249-6.
Mcbride EF. Contrasting diagenetic histories of concretions and host rock, Lion Mountain Sandstone (Cambrian), Texas. GSA Bull. 1988;100(11):1803–10. https://doi.org/10.1130/0016-7606(1988)100%3c1803:CDHOCA%3e2.3.CO;2.
Mcbride EF, Milliken K. Giant calcite-cemented concretions, Dakota Formation, central Kansas, USA. Sedimentology. 2006;53(5):1161–79. https://doi.org/10.1111/j.1365-3091.2006.00813.x.
Meng YL, Gao JJ, Liu DL, et al. Diagenetic facies analysis and anomalously high porosity zone prediction of the Yuanyanggou Area in the Liaohe Depression. J Jilin Univ (Earth Science Edition). 2006;36(2):227–33. https://doi.org/10.3969/j.issn.1671-5888.2006.02.013.
Meng YL, Li B, Wang ZG, et al. Overpressure retardation of organic acid generation and clastic reservoirs dissolution in central Huanghua Depression. Pet Explor Dev. 2008;35(1):40–3. https://doi.org/10.1016/S1876-3804(08)60006-3.
Meng YL, Liu WH, Meng FJ, et al. Distribution and origin of anomalously high porosity zones of the Xujiaweizi Fault Depression in Songliao Basin. J Palaeogeogr. 2011;13(1):75–84 (in Chinese).
Meshri ID. On the reactivity of carbonic and organic acids and generation of secondary porosity. The Society of Economic Paleontologists and Mineralogists (SEPM) roles of organic matter in sediment diagenesis (SP38) 1986; p. 123–28.
Milliken KL, Mack LE, Land LS. Elemental mobility in sandstones during burial: whole-rock chemical and isotopic data, Frio Formation, South Texas. J Sediment Res. 1994;64(4):788. https://doi.org/10.1306/d4267ec4-2b26-11d7-8648000102c1865d.
Pittman ED, Larese RE. Compaction of lithic sands: experimental results and applications (1). AAPG Bull. 1991;75(8):1279–99. https://doi.org/10.1306/0c9b292f-1710-11d7-8645000102c1865d.
Plummer LN. Mixing of sea water with calcium carbonate ground water. Quant Stud Geol Sci. 1975;142:219–38.
Poursoltani MR, Gibling MR. Composition, porosity, and reservoir potential of the Middle Jurassic Kashafrud Formation, northeast Iran. Mar Pet Geol. 2011;28(5):1094–110. https://doi.org/10.1016/j.marpetgeo.2010.11.004.
Pye KDK. Formation of secondary porosity in sandstones by quartz framework grain dissolution. Nature. 1985;317(6032):54–6. https://doi.org/10.1038/317054a0.
Ramm M. Porosity-depth trends in reservoir sandstones: theoretical models related to Jurassic sandstones offshore Norway. Mar Pet Geol. 1992;9(5):553–67. https://doi.org/10.1016/0264-8172(92)90066-N.
Ribstein CA, Gouze P, Marsily GD. Temperature-carbon dioxide partial pressure trends in confined aquifers. Chem Geol. 1998;145(1):73–89. https://doi.org/10.1016/S0009-2541(97)00161-7.
Saigal GC, Bjørlykke K. Carbonate cements in clastic reservoir rocks from offshore Norway–relationships between isotopic composition, textural development and burial depth. Geol Soc Lon Spec Publ. 1987;36(1):313–24. https://doi.org/10.1144/GSL.SP.1987.036.01.22.
Salem AM, Morad S, Mato LF, et al. Diagenesis and reservoir-quality evolution of fluvial sandstones during progressive burial and uplift: evidence from the Upper Jurassic Boipeba Member, Reconcavo Basin, Northeastern Brazil. AAPG Bull. 2000;84(7):1015–40. https://doi.org/10.1306/a9673b9e-1738-11d7-8645000102c1865d.
Schmidt V, McDonald DA. Texture and recognition of secondary porosity in sandstones. SPEM. 1979a;25:209–25.
Schmidt V, McDonald DA. The role of secondary porosity in the course of sandstone diagenesis. SPEM. 1979b;25:175–207.
Seewald JS. Organic-inorganic interactions in petroleum-producing sedimentary basins. Nature. 2003;426(6964):327–33. https://doi.org/10.1038/nature02132.
Shanmugam G. Secondary porosity in sandstones: basic contributions of Chepikov and Savkevich. AAPG Bull. 1984;68(1):106–7.
Si XQ, Zhang JL. Mechanism of secondary pore of the beach bar sandstones in the upper Es4 of the Palaeogene, Boxing Sag. Geol Sci Technol Inf. 2008;27(1):59–63. https://doi.org/10.3969/j.issn.1000-7849.2008.01.010.
Smith JT, Ehrenberg SN. Correlation of carbon dioxide abundance with temperature in clastic hydrocarbon reservoirs: relationship to inorganic chemical equilibrium. Mar Pet Geol. 1989;6(2):129–35. https://doi.org/10.1016/0264-8172(89)90016-0.
Song HR, Huang SY. Crystallized precipitation of carbonate. Carsol Sin. 1990;9(2):105–18 (in Chinese).
Surdam RC, Crossey LJ. Integrated diagenetic modeling: a process-oriented approach for clastic systems. Annu Rev Earth Planet Sci. 1987;15(1):141–70. https://doi.org/10.1146/annurev.ea.15.050187.001041.
Surdam RC, Boese SW, Crossey LJ. The chemistry of secondary porosity: Part 2: Aspects of Porosity Modification. In: Classic diagenesis. AAPG Memoir 37; 1984, p. 127–49.
Surdam RC, Crossey LJ, Eglinton G, et al. Organic–inorganic reactions during progressive burial: key to porosity and permeability enhancement and preservation [and discussion]. Philos Trans R Soc A Math Phys Eng Sci. 1985;315(1531):135–56. https://doi.org/10.1098/rsta.1985.0034.
Surdam RC, Crossey LJ, Hagen ES, et al. Organic-inorganic interactions and sandstone diagenesis. AAPG Bull. 1989;73(1):1–23. https://doi.org/10.1306/703c9ad7-1707-11d7-8645000102c1865d.
Tang JP, Huang WH, Li M, et al. Diagenetic environment evolution of deep sandstones in the upper Es4 of the Palaeogene in Lijin Sag. Editor Comm Earth Sci J China Univ Geosci. 2013;38(4):843–52. https://doi.org/10.3799/dqkx.2013.082.
Taylor TR. The influence of calcite dissolution on reservoir porosity in Miocene sandstones, Picaroon Field, offshore Texas Gulf Coast. J Sediment Res. 1990;60(3):322. https://doi.org/10.1306/212f9192-2b24-11d7-8648000102c1865d.
Taylor TR. Association of allochthonous waters and reservoir enhancement in deeply buried Miocene sandstones: Picaroon field, Corsair trend, offshore Texas. Silic Diag Fluid Flow Concepts Appl. 1996;55:37–48.
Taylor TR, Giles MR, Hathon LA, et al. Sandstone diagenesis and reservoir quality prediction: Models, myths, and reality. AAPG Bull. 2010;94(8):1093–132. https://doi.org/10.1306/04211009123.
Thyne G. A model for diagenetic mass transfer between adjacent sandstone and shale. Mar Pet Geol. 2001;18(6):743–55. https://doi.org/10.1016/S0264-8172(01)00025-3.
Tobin RC, McClain T, Lieber RB, et al. Reservoir quality modeling of tight-gas sands in Wamsutter field: integration of diagenesis, petroleum systems, and production data. AAPG Bull. 2010;94(8):1229–66. https://doi.org/10.1306/04211009140.
Turchyn AV, DePaolo DJ. Calcium isotope evidence for suppression of carbonate dissolution in carbonate-bearing organic-rich sediments. Geochim Cosmochim Acta. 2011;75(22):7081–98. https://doi.org/10.1016/j.gca.2011.09.014.
Tutolo BM, Luhmann AJ, Kong X, et al. CO2 sequestration in feldspar-rich sandstone: coupled evolution of fluid chemistry, mineral reaction rates, and hydrogeochemical properties. Geochim Cosmochim Acta. 2015;160:132–54. https://doi.org/10.1016/j.gca.2015.04.002.
Wang ZY, Wang FP, Lin XY, et al. Pore types and origin of secondary pores of Triassic and Jurassic in North Tarim. Oil Gas Geol. 1995;16(03):203–10 (in Chinese).
Wang C, Zhao HL, Shao HM, et al. Formation time of secondary pores in the sandstone and hydrocarbon reservoir of Denglouku Formation in Songliao Basin. Acta Pet Et Mineral. 2007;26(3):253–8. https://doi.org/10.3969/j.issn.1000-6524.2007.03.007.
Wang YZ, Cao YC, Xi KL. New view on the concept of secondary pore developing zones and its significance of petroleum geology. J Jilin Univ (Earth Science Edition). 2013;43(3):659–68 (in Chinese).
Wang J, Cao Y, Liu K, et al. Pore fluid evolution, distribution and water–rock interactions of carbonate cements in red-bed sandstone reservoirs in the Dongying Depression, China. Mar Pet Geol. 2016;72:279–94. https://doi.org/10.1016/j.marpetgeo.2016.02.018.
Warren EA, Pulham AJ. Anomalous porosity and permeability preservation in deeply buried Tertiary and Mesozoic sandstones in the Cusiana field, Llanos foothills, Colombia. J Sediment Res. 2001;71(1):2–14. https://doi.org/10.1306/081799710002.
Weedman SD, Brantley SL, Shiraki R, et al. Diagenesis, compaction, and fluid chemistry modeling of a sandstone near a pressure seal: lower Tuscaloosa Formation, Gulf Coast. AAPG Bull. 1996;80(7):1045–63.
Weibel R, Kjøller C, Bateman K, et al. Mineral changes in CO2 experiments: examples from Danish onshore saline aquifers. Energy Proc. 2011;4:4495–502. https://doi.org/10.1016/j.egypro.2011.02.405.
Weibel R, Kjøller C, Bateman K, et al. Carbonate dissolution in Mesozoic sand- and claystones as a response to CO2 exposure at 70 C and 20 MPa. Appl Geochem. 2014;42:1–15. https://doi.org/10.1016/j.apgeochem.2013.12.006.
Wilkinson M, Haszeldine RS. Oil charge preserves exceptional porosity in deeply buried, overpressured, sandstones: Central North Sea, UK. J Geol Soc. 2011;168(6):1285–95. https://doi.org/10.1144/0016-76492011-007.
Wilkinson M, Darby D, Haszeldine RS, et al. Secondary porosity generation during deep burial associated with overpressure leak-off: Fulmar Formation, United Kingdom Central Graben. AAPG Bull. 1997;81(5):803–13.
Wilson AM, Boles JR, Garven G. Calcium mass transport and sandstone diagenesis during compaction-driven flow: Stevens Sandstone, San Joaquin basin, California. GSA Bull. 2000;112(6):845–56. https://doi.org/10.1130/0016-7606(2000)112%3c845:CMTASD%3e2.0.CO;2.
Xi K, Cao Y, Haile BG, Zhu R, et al. How does the pore-throat size control the reservoir quality and oiliness of tight sandstones? The case of the Lower Cretaceous Quantou Formation in the southern Songliao Basin, China. Mar Pet Geol. 2016;76:1–15. https://doi.org/10.1016/j.marpetgeo.2016.05.001.
Xiao LH, Meng YL, Niu JY, et al. Diagenetic history and diagenetic stages’ prediction of Shahejie Formation in the Qikou Sag, Chinese. J Geol. 2005;40(3):346–62. https://doi.org/10.3321/j.issn:0563-5020.2005.03.005.
Yang JJ, Huang YM, Zhang WZ, et al. Experimental approach of dissolution of feldspar sandstone by acetic acid. Pet Explor Dev. 1995;22(04):82–6 (in Chinese).
Yuan J, Yuan LR, Yang XJ, et al. Diagenetic evolution model of the deep formation of Ji-yang Sub-basin, Paleogene. Acta Sediment Sin. 2012;30(002):231–9 (in Chinese).
Yuan GH, Cao YC, Yuan GH, et al. Porosity enhancement potential through mineral dissolution by organic acids in the diagenetic process of clastic reservoir. Earth Sci Front. 2013a;5(20):207–19 (in Chinese).
Yuan GH, Cao YC, Xi KL, et al. Feldspar dissolution and its impact on physical properties of Paleogene clastic reservoirs in the northern slope zone of the Dongying sag. Acta Pet Sin. 2013b;34(5):853–66. https://doi.org/10.7623/syxb201305006.
Yuan G, Cao Y, Gluyas J, et al. Feldspar dissolution, authigenic clays, and quartz cements in open and closed sandstone geochemical systems during diagenesis: typical examples from two sags in Bohai Bay Basin, East China. AAPG Bull. 2015a;99(11):2121–54. https://doi.org/10.1306/07101514004.
Yuan G, Cao Y, Jia Z, et al. Selective dissolution of feldspars in the presence of carbonates: the way to generate secondary pores in buried sandstones by organic CO2. Mar Pet Geol. 2015b;60:105–19. https://doi.org/10.1016/j.marpetgeo.2014.11.001.
Yuan G, Gluyas J, Cao Y, et al. Diagenesis and reservoir quality evolution of the Eocene sandstones in the northern Dongying Sag, Bohai Bay Basin, East China. Mar Pet Geol. 2015c;62:77–89. https://doi.org/10.1016/j.marpetgeo.2015.01.006.
Yuan G, Cao Y, Zhang Y, et al. Diagenesis and reservoir quality of sandstones with ancient “deep” incursion of meteoric freshwater: an example in the Nanpu Sag, Bohai Bay Basin, East China. Mar Pet Geol. 2017;82:444–64. https://doi.org/10.1016/j.marpetgeo.2017.02.027.
Yuan G, Cao Y, Zan N, et al. Coupled mineral alteration and oil degradation in thermal oil-water-feldspar systems and implications for organic-inorganic interactions in hydrocarbon reservoirs. Geochim Cosmochim Acta. 2019a;248:61–87. https://doi.org/10.1016/j.gca.2019.01.001.
Yuan G, Cao Y, Schulz H, et al. A review of feldspar alteration and its geological significance in sedimentary basins: from shallow aquifers to deep hydrocarbon reservoirs. Earth Sci Rev. 2019b;191:114–40. https://doi.org/10.1016/j.earscirev.2019.02.004.
Zaid SM. Provenance, diagenesis, tectonic setting and geochemistry of Rudies sandstone (Lower Miocene), Warda Field, Gulf of Suez, Egypt. J Afr Earth Sci. 2012;66–67:56–71. https://doi.org/10.1016/j.jafrearsci.2012.03.008.
Zeng JH, Lin ZQ, Wu Q, et al. Experimental study on the generation of organic acids from source rocks and its effect factors. Acta Sediment Sin. 2007;25(6):847–51. https://doi.org/10.3969/j.issn.1000-0550.2007.06.005.
Zhang YW, Zeng JH, Zhang SW, et al. Simulated experimental study of interaction between fluid and source rock. Acta Geol Sin. 2009;83(3):445–53. https://doi.org/10.3321/j.issn:0001-5717.2009.03.012.
Zhu GY, Zhang SC. Hydrocarbon accumulation conditions and exploration potential of deep reservoirs in China. Acta Pet Sin. 2009;30(06):793–802 (in Chinese).
Zhu XM, Wang YG, Zhong DK, et al. Pore types and secondary pore evolution of paleogene reservoir in the Jiyang Sag. Acta Geol Sin. 2007;81(2):197–204. https://doi.org/10.3321/j.issn:0001-5717.2007.02.008.
Acknowledgements
This study was funded by the Natural Science Foundation of China Project (Nos. 41602138, 41872140, 41911530189), the National Science and Technology Special Grant (No. 2016ZX05006-007; No. 2016ZX05006-003), the Fundamental Research Funds for the Central Universities (18CX07007A), and the State Key Laboratory of Organic Geochemistry, GIGCAS (No. SKLOG-201709).
Author information
Authors and Affiliations
Corresponding authors
Additional information
Edited by Jie Hao
Rights and permissions
Open Access This article is distributed under the terms of the Creative Commons Attribution 4.0 International License (http://creativecommons.org/licenses/by/4.0/), which permits unrestricted use, distribution, and reproduction in any medium, provided you give appropriate credit to the original author(s) and the source, provide a link to the Creative Commons license, and indicate if changes were made.
About this article

Cite this article
Yuan, GH., Cao, YC., Gluyas, J. et al. How important is carbonate dissolution in buried sandstones: evidences from petrography, porosity, experiments, and geochemical calculations. Pet. Sci. 16, 729–751 (2019). https://doi.org/10.1007/s12182-019-0344-4
Received:
Published:
Issue Date:
DOI: https://doi.org/10.1007/s12182-019-0344-4