
Abstract
This is a viewpoint paper on recent progress in the understanding of the microstructure–property relations of advanced high-strength steels (AHSS). These alloys constitute a class of high-strength, formable steels that are designed mainly as sheet products for the transportation sector. AHSS have often very complex and hierarchical microstructures consisting of ferrite, austenite, bainite, or martensite matrix or of duplex or even multiphase mixtures of these constituents, sometimes enriched with precipitates. This complexity makes it challenging to establish reliable and mechanism-based microstructure–property relationships. A number of excellent studies already exist about the different types of AHSS (such as dual-phase steels, complex phase steels, transformation-induced plasticity steels, twinning-induced plasticity steels, bainitic steels, quenching and partitioning steels, press hardening steels, etc.) and several overviews appeared in which their engineering features related to mechanical properties and forming were discussed. This article reviews recent progress in the understanding of microstructures and alloy design in this field, placing particular attention on the deformation and strain hardening mechanisms of Mn-containing steels that utilize complex dislocation substructures, nanoscale precipitation patterns, deformation-driven transformation, and twinning effects. Recent developments on microalloyed nanoprecipitation hardened and press hardening steels are also reviewed. Besides providing a critical discussion of their microstructures and properties, vital features such as their resistance to hydrogen embrittlement and damage formation are also evaluated. We also present latest progress in advanced characterization and modeling techniques applied to AHSS. Finally, emerging topics such as machine learning, through-process simulation, and additive manufacturing of AHSS are discussed. The aim of this viewpoint is to identify similarities in the deformation and damage mechanisms among these various types of advanced steels and to use these observations for their further development and maturation.
1 Introduction
This paper presents and critically discusses some of the recent progress in the field of advanced high-strength steels (AHSS). These materials receive most of their beneficial properties (but also some of their weaknesses) from a carefully balanced microstructure, where multiple phases, metastable austenite and the resulting deformation-driven athermal transformation phenomena and twinning effects, complex dislocation substructures, the precipitation state, and the broad variety of interfaces are particularly important features.[1,2,3,4,5,6,7,8] Therefore, the focus of this viewpoint article is placed on those properties that are related to the alloys’ complex and often hierarchical microstructures. Most of the discussion is about wrought AHSS, suited for sheet production, but other synthesis-related topics such as additive manufacturing with advanced steels are covered as well.[9,10,11]
As some of the key physical metallurgy principles, but also some of the challenges, are common to different types of AHSS, the paper is not organized along specific steel groups alone but rather along certain types of microstructures and the associated micromechanical strengthening, strain hardening, and damage mechanisms.
Revealing the microstructure–property relations that are characteristic of the different types of AHSS requires the use of advanced microstructure characterization tools, applied over a wide range of length scales[12,13,14,15,16,17,18,19,20,21,22,23,24] and with high chemical sensitivity.[25,26,27,28,29,30] Therefore, some of the latest progress in the field of the characterization of AHSS will be highlighted as well.
When predicting properties of AHSS from microstructure observations, phenomenological or empirical models alone are often not satisfactory, as some of the deformation mechanisms and particularly their interactions are often too complex to be properly captured by mean-field approximations. Therefore, recent progress in full-field crystal micromechanical modeling, taking the most important microstructure features into account, is presented to guide microstructure-based AHSS development.[31,32,33,34,35,36,37,38,39,40,41,42]
Besides this focus on mechanisms some special topics such as steels with high Young’s modulus,[43,44,45,46] additive manufacturing,[11,47,48] hydrogen embrittlement,[49,50,51,52,53] through-process modeling[54,55,56], and machine learning applied to AHSS[57] are discussed as well but topics such as corrosion and welding are beyond the scope of this paper.
2 Microstructure Mechanisms Utilized in Advanced High-Strength Steels
2.1 Key Thermodynamic Concepts for Advanced High-Strength Steel Design
Reliable thermodynamic databases are essential tools in the design of AHSS.[58,59,60,61,62,63,64] They need to cover a number of alloying (Mn, Al, Cr, Ni, Si, C, N, B) and tramp elements (Zn, Cu, H, P, S), doped on purpose or entering through ores and scraps. Each of these elements contributes differently to the stability of the iron-rich solutions (liquid, ferrite, austenite (γ), and epsilon (ε)) and the second-phase precipitates.[65,66,67,68,69] The purpose of this section is to present a few key concepts relevant to the thermodynamically guided design of AHSS. The intention is not to present a general review about alloy thermodynamics here. Likewise, it is not intended to present and review all the different thermodynamic assessments available in the literature. Sources of binary, ternary, and quaternary systems which are relevant for high and medium-Mn steels can be found in the literature, e.g., in Reference 70.
2.1.1 Long and short-range chemical ordering
We assume a phase composed of elements A and B, distributed on two sublattices (e.g., one consisting of the corner sites of the unit cells and the other of the body-centered sites in a B2 structure).[71,72] The description of a phase through such interlocking sublattices on which the components can mix is a standard routine in computational alloy thermodynamics. It is a phenomenological approach that allows to treat both, random and ordered solutions but it does not pre-define any crystal structure. In a random distribution, elements A and B have equal probability of occupation on the two sublattices. Long-range order (LRO) means that element A prefers one sublattice and B the other. Short-range order (SRO) means that the atoms with given site fractions do not arrange themselves at random within each sublattice.[72,73] Upon alloying and/or temperature reduction, there is a critical ordering temperature in which the solution starts to display LRO. Short-range order persists beyond the transition temperature in which LRO vanishes.[74,75] Ordering has important consequences for the mechanical properties of AHSS and metallic materials in general and it is therefore an important phenomenon that should be taken into account in alloy design. Figure 1 shows the calculated effect of Si addition on a Fe7Mn-xSi (wt pct) alloy at 600 °C. The black line shows the volume fraction of austenite. The blue and red lines show the occupation of the two sublattices of ferrite as a function of the Si content. It is important to notice that there is a critical composition in which the Si starts to preferentially occupy one of the sublattices. Yet, even below this composition, SRO is still present to some degree.

Effect of Si addition on a Fe7Mn-xSi (wt pct) alloy at 600 °C. The black line shows the volume fraction of austenite. The blue and red lines show the occupation of the two sublattices of ferrite in function of the silicon content. Calculations were performed using the TCFE9 database from Thermocalc® (Color figure online)
2.1.2 The effect of magnetism on phase diagram calculation
The ferromagnetism exhibited by BCC Fe is probably the best-known variant of spin polarization where the coupling of the electronic structure among adjacent atoms favors parallel spin configurations between nearest neighbors and the critical ordering temperature is known as the Curie temperature (TC).[76] In other phases, such as CBCC (alpha) Mn and FCC iron, the exchange forces favor anti-parallel spins between nearest neighbors which is known as anti-ferromagnetism and the critical ordering temperature is known as the Néel temperature (TN). Above the critical temperature, the material is called paramagnetic and it is characterized by a random distribution of directions for the local moments, but short-range magnetic order (SRO) still persists.[77] Many AHSS use an elevated Mn content the consideration of magnetic effects on phase stability becomes increasingly important in alloy design.
The Inden–Hillert–Jarl formalism is the basis for most of the functions that incorporate magnetic ordering contributions in Calphad databases.[73,78,79] From the heat capacity, the magnetic contribution \( {}^{\text{mg}}G_{\text{m}}^{\alpha } \) to the Gibbs free energy can be obtained:
where \( \beta \) is the mean magnetic moment per mole of formula unit, \( f\left( \tau \right) \) is a function of \( \tau = T /T_{\text{c/N}}^{\xi }, \) and \( T_{\text{c/N}} \) is the Curie temperature for the ferromagnetic transition or the Néel temperature of the phase \( \xi \).[77] Figure 2(a) shows the effect of different alloying elements on the Curie temperature of BCC iron. With the exception of cobalt, all the elements decrease the Curie temperature of BCC iron. Mn strongly decreases the Curie temperature of BCC iron and the thermodynamic stability of this phase, making Mn a strong FCC stabilizer. Besides, the increase of the enthalpy of BCC iron upon alloying with Mn creates a metastable miscibility gap in the BCC phase at lower temperatures. Figure 2(b) shows the metastable magnetic miscibility gap of the BCC phase in the Fe-Mn system including the chemical spinodal, the solvus lines between the two BCC phases, and the Curie temperature (without partition of elements). The metastable miscibility gap is highly relevant for the nucleation of austenite, as discussed next.[80,81]

(a) Effect of different alloying elements on the Curie temperature of iron. (b) Metastable miscibility gap of the BCC phase in the Fe-Mn system including the chemical spinodal, the solvus lines between the two BCC phases, and the Curie temperature (without partition of elements). Calculations were performed using the TCFE9 database from Thermocalc®
2.1.3 Thermodynamic aspects of phase transitions with and without chemical partitioning in advanced high-strength steels
Quantitative understanding of phase transformations, their kinetics, and driving forces are key aspects required for the knowledge-based design of AHSS.[62,66,82,83,84] Yet, the driving force concept is often an incomplete or even misleading concept in AHSS design and generally in materials science, since its definition changes according to the specific type of phase transition addressed. Phase transitions can happen either with or without chemical partition of the elements.[2,85,86,87,88,89,90] The partitioning driving force (\( \Delta G_{m}^{P} \)) is given by[67]
where \( \mu_{i}^{\alpha } \) are the chemical potentials evaluated for the actual matrix composition \( x_{j}^{\alpha } \). The composition of γ, \( x_{i}^{\gamma } \), is obtained from a multidimensional (multicomponent) tangent plane to the γ Gibbs-energy curve parallel to the tangent plane of α for the matrix composition under consideration. Phase transitions that occur with partitioning of the elements require long-range diffusion and are often described as diffusion-controlled phase transitions. Ferrite formation from the austenite, ferrite-to-austenite reversion, and carbide precipitation in steels are all important examples of diffusion-controlled transitions which are highly relevant for processing AHSS.[88,91] Para-equilibrium (PE) is one important special case of a diffusion-controlled phase transition in which only fast diffusion species (typically interstitials such as carbon, nitrogen, and hydrogen) partition across the reaction interface (while there still exists a difference in the chemical potential of the slow diffusion species, typically the substitutional elements).[69,92,93,94,95,96] Cementite is frequently formed by a reaction governed by para-equilibrium during low-temperature heat treatment.
Partitionless phase transitions are those in which both, parent and daughter phases have the same composition. Martensitic phase transitions are the best-known examples of partitionless phase transitions in which the daughter phase (e.g., α′- or ε-martensite) is formed from the parent phase (e.g., austenite) by a displacive mechanism (collective military movement of the lattice atoms) upon quenching or mechanical deformation. Notwithstanding, partitionless phase transitions can include diffusive steps as well and thus be controlled by short-range diffusion (atomic jump) of the atoms across the moving interface. Such interface-controlled reactions are called massive transitions. The driving force for a partitionless transition (\( \Delta G_{m}^{NP} \)) is therefore the difference of the free energy between the parent (\( G_{m}^{\gamma } ) \)) and daughter (\( G_{m}^{\alpha } ) \) phases without any change in composition:
The temperature at which \( \Delta G_{m}^{NP} = 0 \) and both phases have the same free energy is referred to as the T-zero temperature. The T-zero concept provides an important and required measure for quantitatively predicting partitionless phase transitions, but it is not a sufficient criterion since it does not incorporate any consideration about the nucleation mechanism or about any other energetic contribution such as for instance elastic energy contributions or inelastic misfit work such as the build-up of geometrically necessary dislocations.[97,98,99,100,101,102,103,104]
As an example for the case of AHSS, Figure 3(a) gives a portion of the equilibrium Fe-Mn phase diagram showing the austenite-ferrite region and the T-zero temperature for the austenite-ferrite phase transition. The partitionless driving force for ferrite formation is positive below the T-zero temperature. Figure 3(b) shows the partitioning driving force (J/mol) for the austenite-ferrite phase transition. Both driving forces increase by decreasing the temperature and the Mn content. Nevertheless, the increase of the partitioning driving force by decreasing the temperature might be elusive, since these transitions require atomic diffusion which is reduced at lower temperatures. Therefore, diffusional formation of ferrite is possible in steels with low Mn content (e.g., DP steels), but unlikely in AHSS with higher Mn content such as medium and high-Mn steels.

(a) Equilibrium Fe-Mn phase diagram showing the austenite-ferrite region and the T-zero temperature for the austenite-ferrite phase transition. (b) Partitioning driving force (J/mol) for the austenite-ferrite phase transition. Calculations were performed using the TCFE9 database from Thermocalc®
2.1.4 Stacking fault energy of the austenite, thermodynamic stability of epsilon iron, and the design of austenite metastability
The thermodynamic and kinetic stability of the (retained, partitioning-stabilized, reversed) austenite is an essential design criterion for AHSS as the degree of (meta-)stability determines the rate of transformation from the austenite into α’-martensite (and sometimes also into hexagonal ε-martensite) and thus also the associated accommodation and strain hardening phenomena.[105]
While most alloys go through a state of thermodynamic metastability at some stage during the manufacturing and processing chain, an important design task for AHSS is to chemically tune and microstructurally engineer the austenite’s stability.[41,106,107,108,109,110,111] The stability of austenite in AHSS is adjusted via compositional (i.e., chemical partitioning), thermal (i.e., kinetic pathways), mechanical partitioning (determining the local mechanical load on the austenite), and microstructure (microstructure-dependent size effects and geometrical confinement) effects so that displacive transformations can be triggered when the material is mechanically loaded. Depending on the chemically tuned thermodynamic stability of the austenite, its spatial confinement, the misfit volume and topology between the host and the product phase(s) and their respective dispersion, deformation-driven athermal transformations can lend AHSS high gain in strain hardening, formability, and damage tolerance.[14,16,111,112] This multitude of inelastic accommodation effects, contributing to the high local strain hardening capacity of AHSS, is attributed to the fact that the athermal deformation mechanisms are neither affine nor commensurate, i.e., their progress requires additional dislocation slip and mechanical twinning to accommodate and compensate for local shape and volume mismatch in the vicinity of the transformation products.
The most important phenomena in this context are the martensitic phase transformation and associated accommodation plasticity (TRIP) and twinning-induced plasticity (TWIP) effects that can occur, both enabled by the presence of thermodynamically metastable austenite. Interestingly, it is particularly this counterintuitive design criterion of the austenite’s thermodynamic ‘weakness,’ i.e., its reduced thermodynamic stability, that triggers deformation mechanisms such as TRIP or TWIP which then produce enhanced strength and damage tolerance of the entire bulk material, Figure 4.

Microstructure section showing the TRIP effect in a Fe-Mn-C steel with metastable austenite. Dislocations inside the metastable host austenite are formed at the tip of a transforming martensite region
The stability of the austenite can be described in terms of the stacking fault energy (SFE, Γ). According to Reference 113, the SFE of FCC alloys can be calculated as follows:
where ρ is the molar surface density along {111} planes and σγ/ε is the γ/ε interfacial energy. \( \Delta G^{\gamma \to \varepsilon } \) is the partitionless driving force (or free energy difference) between the FCC (austenite) and HCP (ε) phases which can be evaluated using a thermodynamic database. The interfacial energy σγ/ε is compositionally and temperature dependent as well.[114] As discussed below in more detail, the SFE is a key concept and critical parameter for the design of AHSS which can be effectively used to predict the mechanical behavior of different steel variants, particularly the interplay of Mn, C, Si, and Al and their influence on the austenite stability against athermal transformation.
2.1.5 Thermodynamics of segregation at lattice defects
Solute segregation to grain boundaries plays a key role in temper embrittlement and austenite reversion in AHSS. Segregation to lattice defects alters the chemical composition locally, contributing to phase nucleation at decorated defects. Gibbs[115] described interfaces as having a “phase-like” behavior in order to explain the adsorption phenomena and obtained a simple expression for the free energy of the interface. When derived for a single temperature, this expression is known as the Gibbs adsorption isotherm: \( Ad\sigma + \sum n_{i} d\mu_{i} = 0 \), where A is the dividing area of the interface, σ is the interface energy per area, \( n_{i} \) is the number of atoms of a given element, and \( \mu_{i} \) is the chemical potential of a given element in the boundary. The Gibbs adsorption isotherm potentially allows the quantitative description of segregation to defects, yet, its applicability is limited as the defect or interface energy is often not known as a function of temperature and concentration.[80] Therefore, a model of the free energy of a given defect is required to describe the segregation behavior in different alloy systems. For substitutional solid solutions, bond-breaking models provide a good approximation of the free energy of the grain boundary by scaling the excess enthalpy of the solid solution with the coordination number.[116] According to this model, the excess enthalpy of the grain boundary \( \Delta H_{\text{xs}}^{\text{gb}} \) can be approximated from the excess enthalpy of the bulk \( \Delta H_{\text{xs}}^{\text{b}} \) (which here also includes a magnetic contribution, which is not negligible in Fe-Mn alloy systems):
where the bond counts are captured by the z symbols, i.e., \( z^{gb} \) is the (reduced) number of bonds inside the grain boundary and \( z^{\text{b}} \) is the number of bonds in the bulk (i.e., 12 in FCC). The enthalpy symbols \( \Delta H_{\text{mix}}^{\text{b}} ,\; \Delta H_{\text{mix}}^{\text{gb}} \), \( \Delta H_{\text{mag}}^{\text{b}} , \;\Delta H_{\text{mag}}^{\text{gb}} \) , and \( \Delta H_{\text{xs}}^{\text{b}} \) refer to the mixing (mix) enthalpy in the bulk and grain boundary, the excess magnetic (mag) enthalpy in the bulk and grain boundary, and the total excess (xs) enthalpy in the bulk crystal, respectively. Using these mean-field approximations, it is possible to describe grain boundary segregation in Fe-Mn alloys using available bulk thermodynamics. Assuming steady-state diffusional equilibrium between the bulk and grain boundary, the equilibrium Mn composition at the grain boundary is such that it satisfies the condition in which the (relative) chemical potentials of the components in the bulk (\( \mu_{\text{Mn}}^{\text{b}} - \mu_{\text{Fe}}^{\text{b}} \)) and grain boundary (\( \mu_{\text{Mn}}^{\text{gb}} - \mu_{\text{Fe}}^{\text{gb}} \)) are equal:
Figures 5(a) and (b) provide graphical representations of the Mn segregation before and after the formation of austenite, respectively. The equilibrium segregation is given by a parallel tangent construction (which is equivalent to the condition of equal diffusional chemical potential) between the free energy curves of the bulk (black curve) and grain boundary (red curve). In the first case (a), the ferrite composition is assumed to be the global composition before the formation of austenite. In the second case (b), the ferrite composition was given by the common tangent construction after the formation of austenite. The constructions correctly described the experimental measurements which show that the amount of Mn segregated to the grain boundaries is drastically reduced after austenite formation. Figure 5(b) shows segregation isotherms at different temperatures assuming a grain boundary with a coordination shift of Δz = − 2 relative to the BCC lattice (z = 8). The total amount of segregation (grain boundary composition) is consistently reduced when the temperature is increased. At lower temperatures, systems with positive excess enthalpy of mixing (like the BCC Fe-Mn system) will have a miscibility gap both at the bulk and at the grain boundary. Due to the segregation phenomena, the first-order transition of the grain boundary will take place at lower bulk concentrations than the first-order transition of the bulk. From the kinetics perspective, the first-order transition of the grain boundary corresponds to a spinodal type of segregation or adsorption and the first-order transition of the bulk corresponds to the well-known spinodal decomposition.[80] The critical composition is shifted to lower Mn values at higher temperatures due to the asymmetry of the Gibbs energy as a function of the Mn composition and the miscibility gap. Such behavior has important consequences for the role of Mn segregation during the nucleation of austenite.[80]

Figure has been reproduced and adapted with permission from Ref. [29]
Graphical representation of the calculation of equilibrium composition of the grain boundary, characterized by reduced coordination of z = 6 (segregation/adsorption) by the parallel tangent construction: (a) Equilibrium composition of the grain boundary before the formation of austenite represented using Gibbs Free-energies. (b) Equilibrium composition of the grain boundary after the formation of austenite represented using Gibbs free-energies. (c) Segregation isotherms at different temperatures. (d) Grain boundary energy of mixing at 15 °C (including magnetism) before and after segregation at 450 °C. The spinodal segregation drastically increases the grain boundary energy at lower temperatures and the formation of austenite leads to a decrease of this energy. GB: grain boundary; LE: local equilibrium. Grain boundary coordination z = 6; BCC matrix coordination z = 8.
The segregation of Mn to grain boundaries is a well-known cause of embrittlement in Mn-containing AHSS.[117,118,119,120,121,122,123,124] The cause for the Mn embrittlement can be inferred from the excess enthalpy of mixing of Fe and Mn for the BCC phase. At a given tempering temperature, Mn will segregate to the grain boundary due to the lower enthalpy of mixing of this element with Fe at the grain boundary.[119,125,126] Nevertheless, the mixing enthalpy of Mn and Fe is still positive and the total enthalpy of the boundary is increased by segregating Mn. As a result, when the alloy is cooled down and the atomic mobility is reduced, the grain boundary is ‘quenched’ into a higher energy state compared to its state before the segregation took place. For compositions above the critical composition for spinodal segregation (or first-order transition), the amount of segregation will be remarkably higher than the compositions below this critical composition. Therefore, the increase of the enthalpy of the boundary and the associated embrittlement due to the reduced cohesive energy of the boundary is much higher above the critical composition. This sharp transition is demonstrated schematically in Figure 5(d) which shows the mixing energy of the boundary before and after the segregation.[29]
2.2 The Influence of Grain Size on Deformation Mechanisms in Advanced High-Strength Steels
AHSS can be processed to have different grain size scales ranging from submicron level to a few tens of micrometers.[4,127,128,129,130,131] General techniques to realize grain refinement in bulk AHSS include thermomechanically controlled processing (TMCP), severe plastic deformation (SPD), and austenite reverted transformation (ART). The review in this section addresses the influence of grain size on various deformation mechanisms including dislocation slip, TRIP and TWIP effects.[132,133,134] Here, both approach are discussed, i.e., AHSS with a TRIP effect as well as other high-strength steels (e.g., interstitial-free (IF) and austenitic stainless steels). The latter have been extensively studied in terms of the grain size effect,[16,111,132,135] and the information acquired from these single-phase steels can in principle be applied in AHSS.[136,137,138,139,140] It should be noted that here only grain size effects down to ~ 100 nm are reviewed, since a grain size level below this value has rarely been fabricated or reported in bulk AHSS.
The grain size effect on dislocation activity lies in the influence of grain boundaries on blocking, generating, and absorbing dislocations. The blocking effect of grain boundaries on gliding dislocations has been well established by the dislocation pile-up model (i.e., the Hall–Petch relation). Such blocking effect is more pronounced for planar slip than that for wavy slip. In the latter case, dislocations tend to arrange in cells. The mean free path of gliding dislocations is thus determined by the cell size, which means that dislocations have little chance to impinge on grain boundaries. However, when the grain size is reduced to an ultrafine level comparable to the cell size, dislocation tangling is unlikely to occur. In this case, dislocations would traverse the whole grain, piling-up at the grain boundaries or being absorbed into the grain boundaries by an atomic re-shuffling mechanism.[141] These two competing processes would determine the total dislocation density, which influences the work-hardening rate. Based on a simple physical model proposed by Bouaziz et al.,[142] there exists a critical grain size above which dislocation storage dominates and below which dislocation absorption is prevalent.
With respect to the grain size effect on the TRIP effect, contradictory observations have been reported in the literature. While most studies show that smaller grain size suppresses the TRIP effect (i.e., increases austenite’s mechanical stability),[129,143,144] the non-effective or even decreasing role of grain refinement on austenite’s mechanical stability has been documented.[135,145] These inconsistent results are in part due to the difficulty of deconvoluting the direct effect of austenite grain size from other microstructural and micromechanical factors (e.g., phase constituents, composition, grain morphology, defect density, and stress/strain partitioning). Some of these factors changed during the processing to realize grain refinement could also influence the mechanical stability of austenite. Another reason is that most related studies are only concluded based on a non-systematic grain size range (e.g., above 1 μm), or based on a comparison between two samples with an upper and lower grain size bound. Nevertheless, it has been proposed that a smaller grain size can increase the elastic strain energy associated with austenite-to-martensite transformation, thus suppressing martensite nucleation.[129,144] For the case of strain-induced martensite, some observations show that its nucleation is preferably occurring at various interacting shear systems consisting of ε-martensite, stacking fault bundles, or mechanical twins.[143,146] In this context, the number of these intersection sites among crossing shear systems might be reduced by grain refinement, thus the nucleation sites for martensite are decreased. On the other hand, Matsuoka et al.[145] found that deformation-induced martensite formation tended to result in the most advantageous martensite variants (near single-variant transformation), in order to release the unidirectional tensile strain. This behavior is regardless of grain size and differs from athermal martensitic transformation where a transition from a multi-variant (low-energy consuming) to a single-variant transformation (high-energy consuming) mode occurs with decreasing grain size. Therefore, it was concluded in their study that grain size (down to ~1 μm) only influenced the thermal stability, but not the mechanical stability of austenite.[145]
Compared with the grain size effect on the TRIP effect, the grain size dependence of the TWIP effect in austenitic steels seems more clear. It is generally reported that grain refinement makes the formation of deformation twins more difficult, although it might not completely suppress deformation twinning. For example, Ueji et al.[147] have observed in a deformed TWIP steel (true strain 0.2) that the percentage of grains containing deformation twins dropped from ~ 50 to ~ 17 pct when the grain size was reduced from 49.6 to 1.8 μm. Gutierrez-Urrutia et al.[148] reported a strong decrease in the twin area fraction due to grain refinement, i.e., from 0.2 for a grain size of 50 μm to 0.1 for a grain size of 3 μm at a global strain of 0.3. The explanation for this behavior normally lies in the increasing effect of grain refinement on the critical twinning stress. Some investigations[148,149] suggested a Hall–Petch-type relation between the twinning stress and austenite grain size. This has later been confirmed by the experimental results from Rahman et al.[150] who measured the twinning stress in a 0.7C-15Mn-2Al-2Si TWIP steel using a series of cyclic tensile tests. They found that the twinning stress was decreased from 316 to 62 MPa when the grain size was increased from 0.7 to 62 μm and attributed this behavior to the reduced slip length and dislocation/stacking fault density by grain refinement. However, it was reported by Bouaziz et al.[151] for a 0.6C-22Mn TWIP steel that the grain size did not influence the twinning stress, but rather increased the initiation strain for twinning. Although such conclusion was derived from their modeling results which seems less convincing compared with the work of Rahman et al.,[150] it might reflect that different steels (thus different stacking fault energies) might show a different grain size dependence of the TWIP effect, which needs to be systematically investigated.
2.3 The Design of Lightweight Steels and the Dynamic Slip Band Refinement Mechanism
One of the key challenges in the design of AHSS is to ensure a sufficiently high ductility reserve that is maintained over a wide range of the loading path for different types of sheet forming operations and crash scenarios. One issue is to avoid microstructurally initiated damage evolution during forming. Another aspect is to shift the onset of plastic instabilities towards higher loads and strains. The continuum mechanical Considère criterium[152] is a well-known and helpful stability parameter in that context. It teaches that no necking occurs (under tensile loads) when the strain hardening rate exceeds the true stress. However, if the strain hardening rate equals the true stress, necking commences, due to a plastic exhaustion effect. Therefore, especially for AHSS with high yield strength, deformation mechanisms that lend the material a high strain hardening rate, especially at high deformation levels, are required to render the steel mechanically more stable also at higher loads. Deformation mechanisms that have been shown to be beneficial in that context are for instance the TRIP and TWIP effects, as they can be compositionally tuned to act also at high strains. Another deformation mechanism that provides high strain hardening is the gradual increase in the total dislocation density over the course of plastic deformation. However, dynamic dislocation recovery, i.e., extensive cross-slip and double cross-slip as well as the associated recombination and annihilation effects may counteract this mechanism and cause significant reduction of the strain hardening rate, especially at large strains. This applies particularly for steels with BCC lattice structure, where the dislocations have high mobility and high cross-slip rates.
In contrast, steels with FCC crystal structure show generally much more sluggish dislocation recovery in comparison to steels with BCC lattice structure. Good examples are high-Mn lightweight steels, such as those pertaining to the Fe-Mn-C-Al-Si alloy class.[105,153] It was observed in these AHSS that high strain hardening rates can be therefore achieved utilizing massive dislocation accumulation and gradual slip pattern refinement.[153,154] This was, for example, realized in a high-Mn lightweight steel with composition Fe-30.4Mn-8Al-1.2C (wt pct). This material has a relatively high SFE of about 85 mJ/m2 and thus also a relatively high austenite mechanical stability.[154] It reveals neither a TRIP effect nor does it undergo mechanical twinning, i.e., it also shows no TWIP effect.[155]
For better understanding the reason of such a high strain hardening rate in a material without any martensite or twin formation both, in the as-quenched state (where the steel contains no κ-carbides) and also in the precipitation-hardened state (containing L′12-type κ-carbides), the microstructure evolution of this high-Mn lightweight steel was studied in detail through microstructure mapping during interrupted tensile testing.[154,156]
It was found in these experiments that the material deforms under both conditions by planar slip, that is, in the as-quenched and also in the precipitation-containing state. This finding indicates a low-dislocation cross-slip frequency. This effect leads to substantially reduced dynamic recovery and, thus, to high strain hardening, as shown in Figure 6.

The figure has been reprinted with permission from Ref. [156] (Color figure online)
The results from mechanical testing, plotted here as true (logarithmic) stress–strain curves of the alloy in both, the as-quenched state (black solid line) and also in the precipitation-hardened state (red solid line). The strain hardening curves for the material in both microstructural states are shown as dashed lines. The alloy is a lightweight steel with composition Fe-30.4Mn-8Al-1.2C (wt pct).
The results obtained from the tensile tests reveal a deformation-dependent gradual reduction of the spacing among adjacent coplanar slip bands with increasing strain, Figure 7. The flow stress can be calculated using the data of the coplanar slip band spacing and the dislocation passing stress acting among such parallel slip bands according to
where K is a geometry factor, M = 3.06 is the Taylor factor, G = 70 GPa is the shear modulus, D the slip band spacing, and b = 0.26 nm the magnitude of the Burgers vector, Figure 7.

The figure is reprinted with permission from Ref. [156]
This image shows the development of the microstructure in a lightweight steel with composition Fe-30.4Mn-8Al-1.2C (wt pct) as a function of the true strain, imposed by tensile loading. The deformation substructure, revealed here by electron channeling contrast imaging (ECCI), is characterized by the formation of multiple groups of parallel slip bands, the spacing among which becomes gradually refined with increasing deformation. (a) through (d) Formation of deformation twins was not observed (for conciseness merely the precipitation-hardened material is presented here). (e) Evolution of the mean slip band spacing D during tensile straining for the material in the as-quenched state and in the precipitation-hardened state. The mean slip band spacing D evolves in a similar fashion in both cases.
The total flow stress for this mechanism can be calculated according to
The first term σ0 includes all static flow stress contributions that are independent on the plastic strain. In the present steel these are the Peierls–Nabarro lattice friction stress, solid-solution strength, Hall–Petch effect,[157,158] short-range order strengthening, and precipitation hardening.[159] After aging at 600 °C for 24 hours the yield strength increased by about 480 MPa, Figure 6. The microstructure after the heat treatment contains a high fraction of ordered κ-carbides. The observed increase of the yield strength is primarily attributed to the κ-carbides and shearing of these by dislocations within the slip bands, Figure 8. The overall evolution of the flow stress during tensile testing, shown in Figure 6, can be well described by Eqs. [7] and [8] using σ0 = 540 MPa for the as-quenched state and σ0 = 1020 MPa for the precipitation-hardened state, a K-value of 1 and the D values as quantified in Figure 7, suggesting that dynamic slip band refinement is the main strain hardening mechanism in these materials.

Two DF-TEM images, taken on a lightweight steel with composition Fe-30.4Mn-8Al-1.2C (wt pct), both showing cut and sheared κ-carbides at a strain of 0.02 (with the g = (010) superlattice reflection used for DF imaging and viewing direction close to the [110] zone axis). The image has been reprinted with permission from Ref. [156]
Figure 9 gives a schematic illustration of the evolution of the slip band pattern upon plastic deformation. At the beginning of plastic flow, the initially grown-in dislocations start moving and multiplying. Interactions among the dislocations generate further sources that start operating by the Frank–Read bow-out mechanism. Due to the planar dislocation glide and the suppression of cross-slip, the glide plane gradually fills up with dislocations (Figure 9(b)). These piled-up dislocations create back stresses that gradually build-up as a function of strain and act against the Frank–Read source. The back stresses increase as the number of emitted dislocations grows. As soon as the local stress at the Frank–Read source falls below the critical semi-loop activation stress, the source stops emitting fresh dislocation loops. This mechanism leads to the evolution of a microstructure that is characterized by glide planes filled with multiple parallel dislocations. The accommodation of further plastic deformation then requires consequently the formation of more dislocations. Hence, new Frank–Read sources must become active elsewhere, e.g., in the middle among existing exhausted slip bands, leading to new ones (Figure 9(d)). As more slip bands are formed, the observed slip band structure thus refines during straining (Figures 9(e) and (f)). The reduced slip band spacing in turn causes strain hardening, mainly due to the increasing dislocation passing stress which scales inversely with their distance.

The figure has been reprinted with permission from Ref. [154]
Schematic illustration of the microstructure evolution in lightweight AHSS with planar slip. (a) Activation of Frank–Read dislocation sources. (b) The glide planes fill up with planar arrays of parallel dislocations. (c) Frank–Read sources become gradually exhausted due to the build-up of back stresses. (d) Activation of new dislocation sources. (e, f) Newly activated Frank–Read sources will undergo the same evolution as the first activated Frank–Read sources. The process sketched here explains the mechanisms behind the gradual refinement of the slip band substructure.
In either case, viz. in the as-quenched state and also in the precipitation-hardened material state, dynamic slip band refinement was identified as the prevalent strain hardening mechanisms, explaining the high strain hardening capacity of this alloy class. When comparing the strain hardening rates of the steel in both microstructure states (Figure 6), it becomes further apparent that the strain hardening rate of the material in precipitation-hardened state is slightly lower than that of the same alloy in the as-quenched state. This applies particularly in the higher deformation regime. This effect has been discussed in terms of the loss of structural and compositional integrity of the κ-carbides during straining.[156,160] This means that the κ-carbides are increasingly cut, sheared, and fragmented by the moving planar dislocation arrays, Figure 8. Additionally, dislocations bind and drag out some of the carbon from the κ-carbides, an effect which may lead to a reduction of the antiphase boundary (ABP) energy inside of the κ-carbides.
2.4 The Role of Kappa Carbides in FeMnAlC Weight-Reduced Steels
Weight-reduced AHSS with high Mn and C content offer a good combination of strength, ductility, and toughness as well as up to 8 pct reduced mass density due to their high Al and C content.[110,156,161,162] Steels with such compositions gain strength through their perovskite (Fe,Mn)3AlC κ-carbides with L′12 crystal structure, as outlined in the preceding section, Figure 8. In order to study the nature of the dislocation/κ-carbide interaction and the influence of precipitation hardening on strain hardening and flow stress, several lightweight steels with single-phase austenitic matrix were investigated.[154,156]
In the following some features of these steels are discussed here in detail, using Fe-30.4Mn-8Al-1.2C (wt pct) as representative model alloy example. After homogenization and microstructure refinement, the material was solution treated for 2 hours at 1100 °C and then quenched. Atom probe tomography (APT) revealed in some cases minor B enrichment, but no substantial enrichment of Al, C, and Mn at grain boundaries.[154] For κ-carbides such chemical decoration details can matter, as interface segregation can favor formation of (often incoherent and blocky) grain boundary κ0-carbides. These can undergo cracking, entailing damage initiation in these otherwise highly formable materials.[159,163,164,165] Heat treatment at 600 °C for 24 hours leads to the formation of κ-carbides inside the grains, causing an increase in proof stress, Figure 6. For interpreting the precipitation hardening effect in a quantitative manner, the particle size, shape, and inter-particle spacing were analyzed. As a full topological and chemical high-resolution characterization cannot be achieved by using TEM mapping alone, since it shows projections of the 3D microstructure, APT analysis was additionally done, Figure 10.

The figure has been reprinted with permission from Ref. [156]
Atom probe tomographic characterization of the precipitate morphology, chemistry, and arrangement. (a) Morphology and arrangement of the perovskite κ-carbides as observed by several APT measurements in 3D. (b) Topological reconstruction of the κ-carbides. (c) Representative 2D sketches of how these κ-carbide nanostructures appear when viewed in the transmission electron microscope.
Figure 8 had shown that the cutting and shearing of the κ-carbides by dislocations proceeds along the {111} slip planes. Similar to the as-quenched material, planar slip prevails as well as dynamic slip band refinement during straining, Figure 7, leading to a high strain hardening rate, Figure 6. The cutting and shearing of the ordered L′12-type κ-carbides occurs along the FCC slip system {111} 〈110〉. This means that the Burgers vector of a perfect lattice dislocation in the FCC γ–matrix is a/2 〈110〉 and it amounts to only half of the vector required to restore the ordered κ-carbide structure back into its perfect lattice. Therefore, a lattice dislocation cannot enter the κ-carbide unless a planar defect is formed. The planar fault extending between two such super-partials inside of the carbide is referred to as APB. The energy of the APB acts as an energy barrier against κ-carbide cutting.[166,167] To quantify the precipitation strengthening contributed by this cutting and shearing mechanism, the APB energy of the L′12-type (Fe,Mn)3AlC κ-carbides has been calculated by ab initio simulations.[159,160] It was found that the energies for the perfectly stoichiometric κ-carbides turned out to be much too high for explaining the observed shearing by dislocations. It was then concluded, aided by additional simulations assuming C deficiency in the κ-carbides, that this effect related indeed to their reduced C content. Instead of the stoichiometrically expected C value of 20 at. pct, it was found that the true C concentration of the κ-carbides was much lower, namely, only about 13 at. pct.[159,160,168] For studying this effect in more detail, two extreme precipitation cases were studied in that context, namely, one with full occupancy of the body-centered interstitial sites by C and a C-free L12 Fe3Al structure. The resulting APB energy value of κ-carbide in the current alloy was expected to fall in the range ~ 350 to 700 mJ/m2. The measured particle radius of around 10 nm indicates that for the given volume fraction of around 0.2, this would translate to a strengthening effect of 900 to 1800 MPa. However, experimentally, the κ-carbides formed during the aging were found instead to increase the yield strength by only ~ 500 MPa, Figure 6. This discrepancy was discussed in terms of the influence of dislocation pile-up stresses before the κ-carbide interfaces. It was suggested that such pile-ups create stresses at their tips that assist particle cutting and subsequent shearing, Figure 8. Such dislocation pile-up scenarios of dislocations in the grain interior have been indeed observed in the steel in its as-quenched state with some degree of chemical short-range ordering in the matrix.
Dislocation pile-up calculations suggest that 4 to 8 dislocations are needed for reducing the strengthening effect to ~ 500 MPa, matching the experimental findings.[154] An additional reason for the lower yield strength increase by the κ-carbides compared to the expected value is the reduced concentration of alloying elements in the matrix due to partitioning occurring because of the κ-carbide formation. This leads to less solid-solution hardening in the matrix and to a lower driving force for short-range ordering.[159,160,168]
The influence of κ-carbide damage, particular at the grain boundaries, and of κ-carbide cutting on the overall strain hardening rate are discussed above. In the following, elemental depletion associated with dislocation shearing after a true strain of 0.15 is discussed. In the TEM micrograph shown in Figure 11(a), two κ-carbide precipitates have been fully cut and split into two adjacent portions, highlighted by blue arrows. The slight mismatch between them indicates that the two half parts had been divided by dislocation cutting. The yellow arrows indicate the positions of smaller fragments of such sheared κ-carbides. The same specimen was subsequently also analyzed for chemical composition by using APT, Figure 11(b). It should be underlined that for this purpose exactly the same region of material was probed in direct sequence by both, TEM and APT, using a fully correlative analysis method, so that structure and chemistry can be compared one-to-one.[13,169,170,171] Figure 11(b) shows the reconstruction obtained from APT probing together with the TEM image. For revealing the location of the carbon, a lower threshold value of 7.5 at. pct for the corresponding iso-concentration surface (Figure 11(d)) reveals two interesting features resulting from the carbide cutting process. The first one is the observation of small C-enriched carbide fragments. The second one are C segregation features along certain directions, indicated by black arrows in Figure 11(c). In order to reveal the arrangement and shape of the κ-carbides also clearly in the APT reconstruction, iso-concentration surfaces of 9 at. pct C have been rendered in Figure 11(c). The results reveal that the linear solute enrichment features are also found for the case of Al (Figure 11(e)).

Figure reprinted with permission from Ref. [156]
Correlative TEM-APT analysis of dislocation-sheared κ-carbides at a true strain of 0.15. (a) Atom probe tip as viewed in TEM showing traces of dislocation shear passing through a precipitate. (b) The same atom probe TEM image as shown in (a) but with some of the chemical results overlaid from the atom probe analysis. (c) Atom probe results of the same tip. The dashed black circle highlights the inhomogeneity of C, revealing the positions of the separated carbide half portions. (d) The black arrows mark in the same atom probe tip linear solute segregation features, most likely C-decorated dislocations. (e) Al distribution in the same atom probe tip.
Different from the usual carbide morphology in this alloy type (Figure 8(a)), these linear enrichment features imply that the κ-carbides have been fragmented and dissolved during the plastic deformation. Considering the high bonding between the segregated solutes and crystalline defects, it is highly possible that the solute segregation zones are dislocation lines. This means that the dislocation slip has not only split the κ-carbides, but the cutting dislocations have also dragged atoms along with them into the adjacent matrix, an effect that had before been reported for dislocation slip and carbide cutting in pearlite.[172,173,174] According to ab initio calculations, a reduced C content in the κ-carbides results in a reduction of the APB energy, also contributing to local softening.
Another important aspect related to carbides in these AHSS lies in their coherence. For avoiding interfacial embrittlement through precipitation hardening, heat treatment should be conducted in a way to avoid formation of semi-coherent or incoherent κ0-carbides at grain boundaries. Formation of less coherent precipitates has been found after prolonged heat treatments (e.g., after 1-month annealing at 600 °C for the composition studied here). This occurred through a discontinuous precipitation reaction. More specific, it was found that a grain boundary starts to move and transforms the γ/κ microstructure into a thermodynamically more stable lamellar structure. This lamellar structure was composed of grain boundary κ0-carbides, solute-depleted grain boundary γ0-phase and α-ferrite (Figure 12).

Figure reprinted with permission from Ref. [159] (Color figure online)
Microstructure view of a Fe-29.8Mn-7.7Al-1.3C (wt pct) alloy aged at 600 °C for 3 months: SE image showing the grain boundary (κ0 + γ0 + α) phases and grain interior (κ + γ) phases. Red arrows mark grain boundary position at the beginning and blue arrows at the end of the discontinuous precipitation reaction (Color figure online).
APT probing revealed that even after 3 months of aging period at 600 °C both, the coherent grain interior κ-carbides ((Fe1.99Mn1.10Al0.91)(C0.60Vac0.40)) and the semi-coherent/incoherent grain boundary κ0-carbides ((Fe-1.7Mn-1.3Al0.96)(C-0.8Vac-0.2)) deviated from the ideal L′12 (Fe,Mn)3AlC κ-carbide stoichiometry.[156,160] Density functional theory (DFT) calculations revealed that the off-stoichiometry was due to the formation of C vacancies and \( {\text{Mn}}_{\text{Al}}^{\gamma } \) anti-sites. This effect was attributed to the minimization of the elastic strain energy between matrix and precipitates.[159] Due to elastic coherency strains in case of the coherent κ-carbides inside of the grains, it was concluded that around 40 pct of the carbon sublattice sites were not occupied by C. Such vacancies are expected to act as possible trapping sites for solute hydrogen, especially when located at the κ/γ interface.[175] This might be a beneficial side effect when aiming at improving the material’s resistance against hydrogen embrittlement.[176] However, it is also important to suppress the formation of plastic instabilities such as shear bands by avoiding high rates of local softening and also to avoid the formation of grain boundary κ0-carbides, when a high resistance against hydrogen embrittlement is required.[177,178] More research in this field is necessary.
2.5 Yielding Mechanisms and Serrated Flow in Advanced High-Strength Steels
Upon room-temperature tensile testing both, continuous and discontinuous yielding can occur in AHSS, depending on their compositions (mainly interstitial solute contents) and microstructural state. Discontinuous yielding is characterized by a yield point drop followed by a stress plateau (also referred to as yield point elongation, YPE) in the tensile stress–strain curves and the formation of Lüders bands. This localized deformation is normally considered to be detrimental for the formability and ductility, as well as the surface quality of sheet products during metal forming operations. It is thus important to understand the fundamental mechanisms of discontinuous yielding and its governing factors. For the occurrence of discontinuous yielding, two essential conditions are required, namely, an initially low density of mobile dislocations and a rapid dislocation multiplication (or an avalanching-driven increase in the number of mobile dislocations). Specifically, three dislocation-based mechanisms have been proposed, which are described as follows.
The most widely accepted mechanism is the locking–unlocking model based on Cottrell and Bilby’s theory.[179] It suggests that solutes segregate to grown-in dislocations (i.e., forming the Cottrell atmospheres) and lock them. For the occurrence of plastic deformation, dislocations must break away from these atmospheres, which requires a higher stress compared with the stress to drive further dislocation glide. This unlocking effect results in abrupt and rapid plastic flow avalanches, causing a yield drop and the nucleation of the Lüders bands.
The second model was proposed by Johnston and Gilman,[180] slightly later after Cottrell. The mechanism is based on changes in the multiplication and velocity of the dislocations, suggesting three promoting factors for discontinuous yielding: an initially low density of mobile dislocations, rapid dislocation multiplication upon loading, and a relatively low sensitivity of dislocation velocity to applied stress. The physical interpretation of the mechanism is as follows. The small number of grown-in mobile dislocations moves slowly at the beginning of loading, due to the relatively low stress level. The plastic flow caused by the gliding of these dislocations at this stage is negligible. With increasing stress, dislocations move faster and multiply rapidly, resulting in an increase of the dislocation velocity and density (i.e., plastic strain rate of the specimen). The stress would cease to increase (i.e., the appearance of the upper yield point) when the plastic strain rate of the specimen equals the applied strain rate (crosshead speed divided by the gauge length).
The third mechanism is derived from some recent studies on ultrafine grained materials (grain size below ~ 1 μm). It has been observed that in some materials such as pure Al, austenitic steels and interstitial-free (IF) steels which normally show a continuous yielding behavior, discontinuous yielding becomes prevalent when their grain sizes are reduced to an ultrafine level.[181] This phenomenon is here referred to as ‘ultrafine grain-induced discontinuous yielding.’ This behavior is related to the high area fraction of the grain boundaries which act as both sinks for grown-in dislocations and sources for generating new dislocations.[182] More specific, the trapping role of the grain boundaries effectively reduces the number of mobile dislocations initially present in the materials. The dislocation nucleation process at grain boundary sources (e.g., ledges) needs to overcome an energy barrier,[183] which means that the nucleation stress is higher than the stress needed for dislocation glide. On the other hand, the large number of dislocation nucleation sources, available due to the large grain boundary area in such alloys, could result in a rapid increase in the mobile dislocation density upon loading. These factors contribute to plastic flow avalanches, thus promoting the occurrence of discontinuous yielding.
It is important to mention that these three mechanisms are not mutually exclusive. For example, the presence of solute atmospheres provides one distinct mechanism for immobilizing grown-in dislocations, thus promoting discontinuous yielding regardless of the active dislocation avalanching mechanisms (i.e., dislocation unlocking from the atmospheres or new dislocation generation from interfaces).
With this set of mechanisms, the various yielding phenomena in different types of AHSS can be readily explained. In first-generation AHSS (e.g., DP, TRIP, CP, and martensitic steels), Q&P steels, austenitic TWIP steels and lightweight steels, continuous yielding normally prevails. This is due to the presence of a sufficient amount of mobile dislocations in the initial microstructure. These mobile dislocations are provided either by some BCC phases containing a large number of dislocations (e.g., martensite and bainite[25,64,184,185]), or geometrically necessary dislocations at interfaces formed during thermomechanical processing (e.g., in DP steels[3,98,186,187]), or austenite where the interaction between dislocations and interstitial solutes are weak. However, when the grain size of some of these steels (e.g., TWIP steels[157,188,189,190,191,192,193]) is reduced to an ultrafine level, the yielding behavior could change to a discontinuous pattern.[147] Among all the AHSS grades, discontinuous yielding is most frequently reported in medium-Mn steels which are cold rolled and intercritically annealed.[143,194] The typical microstructure of these steels consists of ultrafine grained austenite and ferrite with a globular grain morphology. Sun et al.[143] have recently shown that the austenite-ferrite interfaces acted as preferential nucleation sites for dislocations in both ferrite and austenite, which suggests that the ultrafine grain size should play a significant role in the occurrence of discontinuous yielding in these types of steels.
In addition to Lüders banding, the Portevin–Le Chatelier (PLC) effect is another plastic instability phenomenon which can occur in some AHSS. The PLC effect is characterized by serrated plastic flow in the tensile stress–strain curves, the formation of spatio-temporal organized deformation bands and a negative strain rate sensitivity. However, it should be also noted that Mulford and Kocks[195] argued that the dynamic strain aging mechanism could possibly operate over a wider range of temperatures and strain rates than those identified phenomenologically through the appearance of jerky flow. They also suggested that the negative rate sensitivity would be associated with the strain hardening contribution to the flow stress from the beginning of plastic straining and that the total rate sensitivity becomes negative only after this strain hardening contribution prevails.
The PLC effect is normally proposed to be due to dynamic strain aging (DSA), i.e., the dynamic locking–unlocking process between mobile dislocations and diffusing solute atoms.[196] According to the DSA theory, the PLC effect will set in under conditions where the waiting time of gliding dislocations that are temporarily arrested by obstacles (e.g., forest dislocations, precipitates, and interface boundaries) is comparable or longer than the diffusing time required by solute atoms to lock the arrested dislocations.[196]
The room-temperature PLC phenomenon has commonly been observed in high-Mn austenitic steels containing a relatively low amount of Al (e.g., below 2.5 wt pct Al in Fe-18Mn-0.6C steels[197]). However, this observation seems difficult to be explained by the classical DSA model mentioned above, because the bulk diffusivity of C in austenite at room temperature is probably too low to arrest dislocations. The calculated thermal activation energy for the PLC effect in Fe-C-Mn steels was reported to be at least two times lower than that for bulk C diffusion[198,199] Therefore, several other micromechanical DSA models have been proposed to account for the PLC effect in high-Mn steels, such as the reorientation of C-Mn point defect complexes in stacking fault regions,[191] the short-range diffusion of C within dislocation cores,[200] and the interaction between C-vacancy pairs and dislocation stress field.[201] More detailed reviews about DSA in high-Mn steels can be found in References 193 and 202.
Medium-Mn steels, containing an ultrafine grained ferrite and austenite microstructure with a globular grain morphology, have also been documented to show the PLC effect upon room-temperature deformation. The proposed DSA/PLC mechanisms in high-Mn austenitic steels cannot be directly adopted for this type of steels, due to their very different microstructure and deformation mechanisms (i.e., composite-like ultrafine grained microstructure, phase boundary dislocation emission, and TRIP effect in medium-Mn steels). Further, the austenite phase in medium-Mn steels is not likely to be responsible for the PLC effect, because this phenomenon occurs even after most of the austenite has mechanically transformed to α’-martensite.[203] This indicates that the room-temperature PLC effect in such steels should be due to some unique mechanisms, which have not yet been understood. It has been noted in some medium-Mn steels that the PLC effect only occurs in the intermediate austenite stability range.[194] Sun et al.[203] also found that the formation of PLC bands is always accompanied by local martensite formation inside these bands. These findings imply a possible interaction between PLC effect and deformation-induced martensite transformation. More detailed investigations are needed to better understand this point and reveal the underlying mechanisms of DSA/PLC in medium-Mn steels.
2.6 The Role of Phase Boundaries in Advanced High-Strength Steels
Most types of AHSS are architected for multiphase microstructures with different combinations of strong phases (e.g., quenched or tempered martensite, bainite, and various types of precipitates) and more compliant, ductile phases (e.g., ferrite and austenite). Consequently, a large area fraction of phase boundaries exists in these microstructures. In some cases, phase boundaries even become the dominant and most relevant type of planar defects. For example, Figure 13 shows a typical microstructure of an intercritically annealed medium-Mn steel, which possesses an ultrafine grained ferrite-austenite duplex microstructure (ferrite fraction 40 to 45 vol pct) with globular (Figure 13(a)) or laminated grain morphology (Figure 13(b)), respectively. The two phases are spatially arranged in the form of an alternating pattern, resulting in an extremely large fraction of phase boundaries (up to ~ 90 pct). These phase boundaries differ from random high-angle grain boundaries in terms of the interfacial energy determined by the interface structure and chemistry.[29,80,84,91] Such an intrinsic difference between the phase boundary and grain boundary is also expected to result in different behaviors with respect to H trapping and HE response, interface decohesion and failure, corrosion and stress corrosion cracking. For example, the binding energy between hydrogen and austenite-ferrite phase boundary was reported to be above ~ 50 kJ/mol,[204] i.e., much higher compared with the values for the ferrite and austenite grain boundary (below ~30 kJ/mol, as reported by most studies[205,206,207]).

Typical EBSD phase plus image quality (IQ) maps, interface mapping, and calculated fraction of different types of interfaces in an ultrafine grained duplex medium-Mn steel (chemical composition 0.2C-10Mn-3Al-1Si, in wt pct) with (a) globular grain morphology (cold rolled and intercritically annealed at 750 °C for 5 minutes) and (b) laminated grain morphology (two-step annealed with first step at 1000 °C for 10 min and second step at 750 °C for 5 min). (The fraction of interfaces was calculated based on the length of a specific interface divided by the total length of phase, low/high-angle grain, and annealing twin boundary; Interface length was measured by EBSD and analyzed by the TSL-OIM software; GB: grain boundary; TB: twin boundary)
In has been observed in some AHSS, that a high content of solutes can be enriched around the phase boundary areas, resulting in a spike in the concentration profile across the phase boundary (Figure 14). One reason for such enrichment could be similar as that for grain boundary segregation, that is, due to the minimization of the total Gibbs energy of the system (equilibrium segregation) or quench-induced solute-vacancy complexes (non-equilibrium segregation). Another reason lies in the requirement to maintain the local thermodynamic equilibrium at the phase boundary, along with the low solute diffusivity at least in one of the abutting phases.[208] This effect can cause local non-equilibrium solute content and chemical gradients around such heterophase interfaces due to insufficient partitioning kinetics, an effect also referred to as ‘kinetic freezing.’[208]

Another notable feature related to phase boundaries is the enhanced dislocation accumulation close to the interface regions, which is either due to the volume expansion often associated with the austenite-to-martensite transformation or due to the often high mechanical contrast between the two adjacent phases. This enhanced interfacial dislocation activity can have substantial influence on some macroscopic properties such as plastic yielding, work hardening, failure, and hydrogen embrittlement resistance. This effect can be revealed by analyzing the following two examples. The heat treatment of DP steels always involves an annealing step, i.e., samples are heated up to the austenite-ferrite two-phase domain, held for some time, followed by rapid cooling. Upon the cooling step, all or part of the austenite transforms to martensite, resulting in around 2 to 4 pct volume expansion due to the change of the lattice structure.[210] The volume expansion has to be accommodated by the adjacent ferrite, which creates a high density of dislocations near the phase boundaries. For example, it has been shown in a DP steel that the density of geometrically necessary dislocations (GNDs) varies from ~ 2.5 × 10¹⁴ m−2 close to the ferrite-martensite phase boundaries to ~ 2.5 × 10¹³ m−2 in the ferrite grain interior (Figure 15(a)). This high number density of dislocations might not be completely pinned by C atoms. The unpinned mobile dislocations in ferrite can thus provide the initial plastic flow, which is considered as one important reason for the continuous yielding and initial high work-hardening rate in DP steels.[97] The other example derives from some recent observations by Sun et al.,[143] who investigated the initiation of plastic flow in an ultrafine grained medium-Mn steel with an almost fully recrystallized austenite and ferrite microstructure. They observed that under loading, phase boundaries acted as preferable nucleation sites for both, new partial dislocations in austenite, and full dislocations in ferrite. This dislocation generation mechanism along with the high area fraction of phase boundaries were proposed to be the main reason accounting for discontinuous yielding in their steels.

(a) EBSD image quality (IQ) map and calculated distribution of GNDs in a ferrite-martensite dual-phase (DP) steel[97]; (b) in situ three-point bending tests combined with ECCI, showing dislocation emission at austenite-ferrite phase boundaries in an ultrafine grained duplex medium-Mn steel, reconstructed with permission from Ref. [143] (D2, D3: deformation stage 2 and 3; SFs: stacking faults)
This concise overview reveals the differences between a phase boundary and other planar defects (e.g., grain boundaries) and how such differences can result in property changes. This indicates that phase boundaries in multiphase AHSS might require separate treatments and their structure and chemistry need to be investigated in more detail.[169,174,189,211] In principle, there should be a large processing scope of tuning the characteristics of phase boundaries with respect to their density, chemical enrichment, arrangement, and percolation. In this context, a new strategy based on the engineering of phase boundaries to tailor properties might emerge. To give an example, Dmitrieva et al.[97] have shown that during the aging process (at 450 °C) of a martensite-retained austenite maraging-TRIP steel, a very high amount of Mn (up to 27 at. pct) was enriched at the areas adjacent to the moving phase boundary which constructed a new austenite layer with high mechanical stability (Figure 14(b)). This nano-layered stable austenite was proposed to be responsible for the high ductility and toughness of the steel after aging.
2.7 Effects of Boron in Mn-Containing Press Hardened High-Strength Steels
Press hardened steels are used in a hot forming sheet manufacturing process which is also referred to as form hardening. Prior to press hardening, the sheet is usually reheated into a fully austenitic state. After transferring to the press, the forming takes place in the austenitic temperature range and by holding the part in the water-cooled dies with controlled heat transfer, the resulting high cooling rate leads finally to a fully martensitic microstructure. This means that press hardening combines the forming and quenching of sheet steel in a single processing step. This process step is also referred to as hot stamping. The steels used for this process usually contain 1 to 1.3 pct Mn and 15 to 50 ppm B, as well as mostly 0.2 to 0.35 pct C. Press hardening provides finished sheet parts with tensile strength values up to 1.8 GPa at low distortion of the formed part. Press hardened steels are used in crash-relevant parts, such as automotive A-pillars, B-pillars, or bumpers. The role of Mn in these alloys lies (besides deoxidation and S trapping) in the improvement of the alloy’s hardenability. The role of B is more complex and exhibits a variety of effects. The primary role of B is to enhance the hardenability of alloys. However, the use of B can include other aspects too, such as enhancing grain boundary cohesion and serving in weld microstructure control. This section explores the potential for future employment of B in AHSS, the underlying mechanisms, and state-of-the-art experimental techniques to detect this important dopant element.
2.7.1 Effects of boron on phase transformation
Boron is one of the most potent hardenability agents of low-carbon, low-alloy steels. Already extremely small additions of B (< 20 ppm in weight) increase the hardenability considerably compared with other alloying elements.[212] Such small addition of B is equivalent to the addition of 0.3 pct Mo, 0.4 pct Cr or 1.25 pct Ni in enhancing the hardenability of a 0.4 pct C steel.[213] Boron’s ability to improve hardenability deteriorates with increasing carbon content of the steel.[214] Press hardening steels (such as 22MnB5, 27MnCrB5) utilize this aspect of B and thus have adequate hardenability to achieve fully martensitic microstructure during the hot stamping process without affecting the cost of the steel substantially. Press hardening steels are formed in their austenitic state to the final shape and quenched simultaneously within a water-cooled die for 5 to 10 seconds.[215] It is important for such a steel to possess a lower critical cooling rate to arrive at a fully martensitic microstructure for the entire volume to yield the targeted mechanical performance. Steels processed via this route provide high tensile strength of about 1500 MPa.[216] Press hardening steels find wide application in automobile industries and the usage of hot-stamped components have gone up tremendously over the past decades.[217] Hot stamping technologies and their applicability to B-containing steels have been reviewed in detail in several recent papers.[215,216]
Detailed investigations have shown that B in solid solution affects the ferrite nucleation with no or minor effect on the growth of ferrite.[213] B, acting as a surface active element in steels,[218] mainly segregates to austenite grain boundaries during cooling. Such segregation occurs predominantly through the non-equilibrium segregation mechanism.[219] Non-equilibrium segregation occurs when a complex of vacancy and segregating atom is formed and diffuse to the vacancy sinks.[220,221,222,223,224,225,226,227] Such type of segregation appears normally when it is quenched from high temperature to low temperature which leads to high oversaturation of vacancies. More recent observations obtained by APT have revealed that segregation is controlled by equilibrium mode with diffusion limitation at lower austenitization temperatures,[220] however, when cooled from higher austenitization temperatures, non-equilibrium segregation dominates.[221] Though it is clear that B segregation to austenite grain boundaries delays ferrite nucleation, the mechanism leading to such a state is not clear yet. One proposed mechanism explains the delay of nucleation as follows. Ferrite nucleation in steel is heterogeneous and generally starts at austenite grain boundaries and it is shown to have a specific orientation relationship with one of the austenite grains. As B segregates to austenite grain boundaries, it reduces the grain boundary energy by furnishing the lattice imperfections due to its size.[213,214] Thus, the available grain boundary energy supplied to the heterogeneous nucleation is reduced and this delays the nucleation of ferrite. With increasing B content of the steel, B segregation at grain boundaries increases and when this concentration exceeds a critical value, precipitation can start. Precipitates are usually borocarbides (M23(B,C)6) as B is normally impeded in these types of steels from forming BN using Titanium or Aluminum. As these borocarbides precipitate, the energy peak at the imperfection increases and nucleation becomes feasible. Some authors claimed that grain boundary energy reduction by B segregation is not sufficiently high enough to affect the nucleation.[222] A different mechanism was proposed concerning borocarbide precipitation,[222] based on the argument that B forms borocarbides which are cubic and grow very slowly. Cubic borocarbides have coherent boundaries with one of the adjacent austenite grains and this part of the boundary cannot nucleate any ferrite as the energy available from the boundary is small. However, other adjacent regions of the same boundary which are semi/incoherent can support nucleation of ferrite. It has been argued that when these borocarbides are small, they inhibit the ferrite nucleation but as it grows, it acts as nucleation site.[222] However, no such small borocarbide precipitates have been reported up to now in the literature confirming the above-mentioned mechanism, but only grain boundaries decorated with solute B have been found with the help of APT measurements.[238,239] Hence, to study these effects further, more in-depth experimental and theoretical analysis regarding the mechanisms behind the B effect on ferrite nucleation and thus hardenability must be conducted.
Detecting chemical decoration at interfaces, specifically at prior austenite grain boundaries (PAGBs), is a tedious task, however, it is important to identify the state of B at such PAGBs to explain the underlying B-related mechanisms and to identify the reason for its effect on hardenability.[224] The alpha-ray track etching method and secondary ion mass spectroscopy have been two important tools to conduct such studies, however, quantification of B segregation with these characterization techniques was so far not quite satisfactory. APT is much better suited for the quantification of elements owing to its high spatial and chemical (mass-to-charge) resolution. Recent investigations have therefore used APT probing to reveal the state of B at PAGBs and quantified the segregation of B.[238,239] Figure 16 shows one such APT tip containing a PAGB with B segregation. Through the use of APT, it is straightforward to distinguish between PAGBs and other lath or block boundaries as B segregates only to PAGBs. Figure 16 clearly indicates the segregated B at the PAGB and no precipitation took place. The segregation of B and Molybdenum (Mo)-added B steels was studied with varied cooling rate and the mechanisms for the mode of segregation of B were revealed.[220] Blending of Mo into B-added steels increases the hardenability further. This synergetic effect is explained in terms of the retardation in the formation kinetics of M23(C,B)6 precipitates.[220]

Reprinted with permission from Ref. [225]
Atom probe tomography analysis allows to use the local composition at an interface to distinguish between prior austenite grain boundaries and other lath or block boundaries in steels as B segregates only to prior austenite grain boundaries.[225] (a) Atom probe tip with the boron and carbon clearly visible at an interface. (b) This image shows the direction along which the compositional interface analysis was conducted for the 2D representation given in (c).
2.7.2 Effects of boron on grain boundary cohesion
Apart from B being used to enhance steel hardenability, several investigations have shown that B can also enhance the grain boundary cohesion, thus acting against embrittlement.[226] Boron increases the grain boundary cohesion of iron and steels by segregating to its grain boundaries.[58] It is well known that Phosphorus (P) causes grain boundary embrittlement in steels and leads to intergranular fracture and also increases the ductile-to-brittle transition temperature (DBTT). However, P is also one of the strongest solid-solution strengthening elements. Thus, for exploiting this important ability of P without causing embrittlement of the steel, B can be utilized. When B is added to such high P-containing steels, it segregates to grain boundaries, occupying at least some of the available free volume at the interface instead of P, due to the site competition between these elements at grain boundaries. The addition of B can thus exert a beneficial effect not only by preventing intergranular fracture through the suppression of interfacial P segregation but it also has the inherent ability to strengthen the grain boundary through enhancing cohesion.[228,229]
2.8 From Discontinuous Interface Precipitation to the NanoHiTen Concept
As an alternative to the Fe-Mn and Fe-Mn-Al-C AHSS discussed above, which mostly utilize dynamic slip band refinement and transformation effects of metastable austenite, some recent advanced precipitation-hardened ferritic steels obtain their mechanical properties through discontinuous heterophase interface precipitation. In principle, the decomposition from the FCC austenite γ host phase into the ferrite α phase plus carbide upon cooling of hot-rolled products can proceed in two modes, namely, formation of fibrous carbide or interphase precipitation.[230] The latter effect is featured by regular sheets of fine and highly regular carbides, contributing significantly to strength.[230,231] This type of hardening through interphase precipitation enabled the development of ultrahigh-strength hot-rolled steels, named NanoHiTen by Funakawa.[232,233]
2.8.1 Basic phenomena of interphase precipitation in steels
Microalloying elements such as Ti, Nb, V, Mo, or Cr can react with carbon to form a variety of carbides (TiC, NbC, V4C3, Mo2C, or Cr23C6).[231,234] The reactions can be classified into three types[235]: (1) precipitation from supersaturated austenite solid solutions; (2) precipitation from supersaturated ferrite solid solutions; and (3) precipitation occurring during austenite-to-ferrite transformation. Depending on the used carbide-forming elements and transformation behavior, the ferrite/alloy carbide aggregates appear as fibrous carbides or interphase precipitation.[230] Fibrous carbides originate at prior austenite grain boundaries and grow nodular. The formation of fibrous carbides relies on a ferrite/carbide coordinate type of growth similar as the growth of pearlite. Several observations reported a transition from interphase to fibrous precipitation in Fe-Mo-C[236] and Fe-V-C alloys.[235,237] Fibrous carbides form preferably at slowly moving α/γ interfaces, allowing diffusion of the carbide-forming elements.[238]
The characteristic distributions of interphase precipitates are regular sheets of a fine carbide dispersion in ferrite. As shown in Figure 17(a), during the transformation from austenite to ferrite, the carbides nucleated densely on the austenite/ferrite interface, which then moved to a new position, where the nucleation cycle again occurred. This process can be repeated many times, thereby leading to a very fine banded dispersion of carbides in the ferrite matrix as shown in Figure 17(b).[230,239]

Reprinted with permission from Ref. [239]
(a) Schematic diagram showing interphase precipitation at the α/γ interface and (b) high-angle annular dark-field image showing interphase precipitation in Ti-Mo alloyed steel.
2.8.2 Characterization of interphase precipitation
Analysis of the orientation relationship between carbide and ferrite sheds light on the precipitation type. Generally, MC-type carbides, i.e., TiC, V4C3, NbC, or (Ti, Mo)C, have B1 structure (NaCl structure) and follow the Baker–Nutting (B–N) orientation relationship (OR) with the ferrite matrix, i.e., \( \left( {0 0 1} \right)_{B1} ||\left( {0 0 1} \right)_{\alpha } \) and \( \left[ {1 1 0} \right]_{B1} ||\left[ {1 0 0} \right]_{\alpha } \). There are 3 equivalent variants of the Baker–Nutting (B–N) OR for random precipitation of MX carbides in ferrite. Figures 18(a) and (b) show that two carbides hold different variants of B-N OR with ferrite in a long-aged Ti-V alloyed steel. In contrast, it has been claimed that only a single variant of the B-N OR will be adopted for carbides on same sheeted planes. Figures 18(c) and (d) show two interphase-precipitated carbides with single variants of the B-N OR in a Ti-Mo alloyed steel.

(a) HRTEM image and (b) its diffractogram show that two carbides hold different variants of B-N OR with ferrite in a long-aged Ti-V alloyed steel; (c) HRTEM image and (d) its diffractogram show that two interphase-precipitated carbides hold single variant of B-N OR in a Ti-Mo alloyed steel
Tomographic characterization at the nanoscale is definitely critical in the investigation of interphase precipitation. Okamoto presented a TEM tomography result showing a distribution of interphase precipitates. In 2007, Timokhina et al. showed the first reconstruction of a distribution of interphase-precipitated carbides in Ti-Mo alloy steel by using atom probe tomography.[240] With site-/orientation-specific sample preparation, Zhang et al. investigated effects of the ferrite/austenite OR on interphase precipitation.[241] Recently, combined characterization by atom probe tomography and small-angle scattering showed that the average chemical composition approached the stable MC carbide stoichiometry with Ti/Mo ratio of ~ 2.5 and C/(Ti + Mo) ratio of ~ 0.55.[242] Chen et al. revealed individual hydrogen (deuterium) atoms at trapping sites of an interphase-precipitated carbide in a ferritic steel.[27]
2.8.3 Mechanism of interphase precipitation
The morphologies of interphase precipitates were classified into planar interphase precipitation and curved interphase precipitation.[237] Planar interphase precipitation is associated with ferrite growth by the ledge mechanism at a semi-coherent α/γ interface. The carbides or carbonitrides are nucleated over the \( \left\{ {1 1 0} \right\}_{\alpha } ||\left\{ {1 1 1} \right\}_{\gamma } \) interface with Kurdjumov–Sachs orientation relationship and continue to grow until another ferrite ledge moves over them and the process is repeated as shown in Figure 19(a). This is known as ledge mechanism. Curved interphase precipitation is associated with carbide nucleation over migrating incoherent α/γ interfaces as shown in Figure 19(b). The irregular sheet spacing of curved interphase precipitation was firstly explained in terms of the bowing mechanism as shown in Figure 19(c) and the regular sheet spacing was further explained by the quasi-ledge model as shown in Figure 19(d).[243,244,245,246]

2.8.4 Features of NanoHiTen steels
A wide range of interphase precipitates has been identified in ferritic AHSS, such as VC(V4C3),[230,247,248,249] NbC,[250] Mo2C,[230,251] Cr23C6,[252] TiC,[253] motivating the development of steels with dual microalloying such as Nb-V,[254,255] Ti-V[254,255], and Nb-Ti.[256,257,258] However, the contribution of precipitation hardening to these values was considered to be minor. An ultrahigh-strength hot-rolled steel strip has been developed with tensile strength of ~ 780 MPa and excellent formability.[232,233] This material has compositions in the range Fe-(0.04 to 0.10)C-(0.1 to 0.3)Si-(1.2 to 1.6)Mn-(0.02–0.2)Ti-(0–0.4)Mo (in wt pct). As shown in Figure 20, the main characteristics of NanoHiTen AHSS include (a) interphase-precipitated nanometer-sized carbides inside micrometer-sized ferritic grains; (b) complex (Ti,Mo)C carbides with high thermal stability; (c) high ultimate tensile strength and high total elongation; and (d) excellent hole-expansion ratio enabled by the material’s high yield ratio.

The characteristics of NanoHiTen: (a) 3 to 8 μm fine ferritic grains, (b) interphase-precipitated carbides, (c) 3 to 8 nm nanometer-sized (Ti,Mo)C carbide, and (d) ultrahigh strength with excellent ductility
Typical NanoHiTen grades have a yield strength above 700 MPa, ultimate tensile strength > 780 MPa, and total elongation > 20 pct, achieved by the fine ferrite grains (3 to 8 μm in size) that are strengthened by nanometer-sized interphase-precipitated carbides. The MC carbides are bypassed by dislocations via Orowan looping, Figure 21(a). The possible role of clusters to the yield strength, shown in Figure 21(b), has not yet been fully elucidated. The Orowan mechanism yields a contribution according to the Ashby–Orowan equation of
where G is the shear modulus of the matrix, b the magnitude of the Burgers vector, \( \bar{r} \) the particle radius, and L the particle mean free spacing, M the mean Taylor factor, and k = 1 a constant for screw and 1/(1-υ) for edge dislocations. Using a Taylor factor of 3 and rewriting the equation in terms of volume fraction and real diameter leads to
where f is the volume fraction of particles, and r is the topologically corrected particle radius. As shown in Figure 21(c), for a carbide volume fraction of 0.2 pct and an average size of 3 nm, the strengthening effect can reach values above 300 MPa. When the carbide size reaches 20 nm, the contribution drops to 100 MPa, hence, high thermal stability of tiny carbides is essential.

Precipitation strengthening (a) Orowan looping mechanism and (b) cut-through mechanism. (c) An estimation of increased strength as functions of carbide size and volume fraction
While the yield strength of NanoHiTen is well understood, its work hardening is not.[259] The initial deformation leads to the accumulation of Orowan dislocation loops around the carbides. These loops produce larger and larger back stresses against the following dislocations as plastic deformation proceeds. When a certain stress level is reached, cross-slip or activation of other slip systems sets in, giving rise to high work hardening. In the later stage of the uniform deformation regime, significant dynamic recovery occurs. The high yield ratio in NanoHiTen AHSS is thus explained by the balance between the Orowan looping mechanism and dynamic recovery.
Orowan looping not only leads to high yield strength but also enables a more uniform distribution of dislocations during plastic deformation. This phenomenon is helpful to suppress local pile-up of dislocation and retard formation of cracks. Hence, NanoHiTen steel usually has much larger post-necking elongation. For practical applications, a very attractive property of NanoHiTen is its excellent hole-expansion performance. As shown in Figure 22, dual-phase (DP) steel has high total elongation but its hole-expansion performance is often not good. In DP steels, non-uniform partition of strain between ferrite and martensite causes easy formation of crack at the interface. Tsai et al. introduced interphase precipitations into the ferrite phase of a DP steel and this material then turned out to have a larger post-necking elongation and a better hole-expansion ratio.[260] It is interesting that high hole-expansion performance usually comes with high yield ratio. Also, microstructure uniformity is a critical point in this context.

Schematical diagram showing the relationship between the hole-expansion capability of the material against the total elongation, including also some microstructure features
2.8.5 Outlook on alloy design and thermomechanical process routes for NanoHiTen steels
NanoHiTen is produced by hot rolling, which involves slab re-heating, rough rolling, fine rolling, accelerated cooling, and coiling. Optimization of the dispersion of interphase-precipitation carbides in ferrite needs a compromise between alloy design and process control. The atomic ratio between carbon and all carbide-forming elements should be approximately 1 to prevent the formation of pearlite or cementite. The Ti content must remain below a certain level to suppress dynamic precipitation in austenite during hot rolling. Bikmukhametov et al. reported that hot deformation in the austenitic phase field significantly enhances dynamic precipitation of TiC carbide and leads to larger spacing of the interphase precipitation in NanoHiTen steel.[261] This also means that some of the earlier variants of this material, using Ti and Nb, consume a high fraction of the Ti and Nb solutes by dynamic precipitation in the austenite, thus preserving less for interphase precipitation. MC-type carbides have a coherent cube-on-cube orientation relationship with the austenite when nucleating in this phase, creating an incoherent interface with the ferrite after the transformation. The associated higher interface energy increases the capillary driving force for coarsening, rendering the precipitates thermally less stable. Adding 0.1 wt pct Ti to NanoHiTen steel reduces carbide formation during hot rolling. Adding further 0.2 wt pct Mo has no effect on dynamic precipitation but it enhances the interphase precipitation.[262] To obtain fine ferrite grains, the finish-rolling temperature and coiling temperature must be low because ferrite transformation occurs during cooling at the early stage of coiling. Transformation at lower temperature produces finer grain size, and leads to smaller particle spacing. Importantly, addition of Mo significantly retards transformation of ferrite and prevents transformation at high temperature. The hot rolling process takes about 150 seconds before coiling. Hence, the combination of Ti and Mo as microalloying additions to NanoHiTen steels seems to be the most promising alloy design avenue.
2.9 Damage Mechanisms Unrelated to Hydrogen
2.9.1 Ductile fracture
Ductile fracture at room temperature in conventional high-strength steels (e.g., mild, high-strength low-alloy, and interstitial-free steels) is commonly related to void formation around particles such as inclusions and second-phase precipitates. Depending on the mechanical properties of the matrix and the particles as well as the local stress state, particle-induced void nucleation can either be due to particle–matrix decohesion or particle cracking.[263] However, in modern AHSS with a multiphase microstructure (e.g., ferrite-martensite DP, conventional TRIP, Q&P, and medium-Mn steels), additional void nucleation mechanisms exist and sometimes become more prevalent.[3,15,209] In many scenarios, the interfaces between the softer phase (e.g., ferrite, δ-ferrite, retained austenite) and the harder phase (e.g., fresh martensite) have been reported to act as prevalent void nucleation sites.[209] Figures 23(a) and (b) show typical examples of this void nucleation mechanism in a DP steel and a ferrite-austenite medium-Mn steel.[3,33,264] It needs to be noted that there is normally not much evidence of damage propagation along such phase boundaries.[3,15,209] This suggests that these interfaces (if not decorated with embrittling elements such as P and H) are not intrinsically brittle. Therefore, interfacial void nucleation is probably due to the large strain incompatibility between the soft and hard phase, resulting from their high mechanical contrast.[209,263,265] The associated plastic deformation mismatch is essentially accommodated by high densities of geometrically necessary dislocations (GNDs) in the interface regions (see one typical example in Figure 23(c)).[97,98,266] This increases the local stress concentration and thus promotes void nucleation.

Typical examples showing void nucleation at interfaces between ferrite (F) and fresh martensite (quenched martensite (M)/strain-induced martensite (SIM)) in (a) a DP steel[15] and (b) a medium-Mn steel[209] (ECCI: electron channeling contrast imaging, IPF: EBSD inverse pole figure, IQ: EBSD image quality map); (c) EBSD phase plus image quality map and the kernel average misorientation (KAM) map of a ferrite-austenite medium-Mn steel (Fe-0.2C-10Mn-3Al-1Si, in wt pct, cold rolled and intercritically annealed) before and after room-temperature tensile straining, showing the increase of the KAM value near the ferrite/strain-induced martensite interface and the retained austenite/strain-induced martensite interface (marked by elliptical frames). The high KAM value reflects a high density of geometrically necessary dislocations (GNDs)
2.9.2 Brittle fracture of advanced high-strength steels
AHSS do not only fail by ductile fracture. A completely or partially brittle fracture behavior due to the formation of intergranular or cleavage cracks can sometimes be observed, even in AHSS with their typically good ductile response (e.g., TWIP steels and lightweight steels). In general, the underlying mechanisms for microcracking can be classified into four categories:
-
(a)
Cleavage cracking inside fresh martensite. Quench-induced and deformation-induced α′-martensite, containing a medium or high carbon content, are known to be brittle and show limited plasticity.[267] In multiphase steels, whether such cracking event is prevalent or not strongly depends on the plastic deformation that martensite needs to carry. Based on the linear volume fraction mixture law, the plastic deformation partitioned to martensite increases with its higher volume fraction. Martensite cracking will then occur when martensite achieves its plasticity limit. In DP steels, the fracture mechanism changes from ferrite-martensite decohesion to martensite cracking when the volume fraction of martensite is above ~ 60 vol pct.[3]
-
(b)
Cracking along prior austenite grain boundaries (PAGBs). This failure mechanism is most frequently observed in high-strength martensitic steels, which is due to (i) the segregation of metalloid elements (Groups IVA to VIA in the Periodic Table) such as P, S, N, Sb, Sn, As, and Si (most are impurities) at PAGBs and their reduced cohesive strength caused by such segregation[226,267,268] and (ii) the formation of carbides at PAGBs. The theoretical background and experimental evidence regarding grain boundary segregation and embrittlement have been reviewed in previous reports.[226,269,270] It has been shown that Mn can also segregate to ferrite grain boundaries and promote their embrittlement.[118] The underlying mechanisms were proposed to be either due to the co-segregation of Mn along with other harmful impurities (e.g., P),[119] or a direct effect of Mn segregation on lowering the grain boundary cohesion[118,122,268] or both effects. Such detrimental effect of Mn might need to be more carefully considered when utilizing Mn in modern AHSS for improving the strength–ductility combination.
-
(c)
Cleavage cracking due to the formation of ordered phases. For targeting lightweight design purposes, sometimes a high content of Al and/or Si (above 3 wt pct) is added into high Mn-containing steels, which are then referred to as lightweight/low-density AHSS (see details in preceding sections). This high Al and Si addition promotes the formation of δ-ferrite, which can be brittle and show a cleavage-type fracture along the {100} planes. Sun et al.[209] observed the formation of B2 ordered phase in the δ-ferrite of a medium-Mn lightweight steel (0.2C-10Mn-3Al-3Si, in wt pct). Such long-range ordering effect can induce the formation of dissociated superlattice dislocations, which reduces the dislocation cross-slip frequency, resulting in high stress concentrations and cracking along the cleavage plane. In addition, the fracture surface of some Al-added medium-Mn lightweight steels also show a high fraction of cleavage fracture.[271] Since Al per se can also promote the ordered phase (B2 and D03) formation in δ-ferrite,[272] the cleavage fracture in these steels might also be due to the δ-ferrite ordering effect, which requires further experimental validation.
-
(d)
Quasi-cleavage fracture related to deformation twins. Cleavage-like transgranular fracture has sometimes been observed in high-Mn TWIP steels upon tensile loading at room temperature.[273,274] This is to some extent surprising since austenite is generally considered to be a ductile phase. Yu et al.[273] observed that the quasi-cleavage fracture surface was mainly located at the side edges of the tensile specimens, resulting from microcracking along grain boundary junctions and deformation twin boundaries at side surfaces where localized Portevin–Le Chatelier (PLC) bands intersected. These cracks can in principle be nucleated from different sites including twin boundaries with dislocation pile-ups, twin–twin intersections, and twin-grain boundary intersections. With respect to further crack propagation, Luo et al.[274] have proposed that the emission of trailing partial dislocations near the crack tips becomes more difficult due to the blocking effects of twin boundaries on the leading partials. This behavior increases the critical energy for dislocation emission, which promotes crack propagation rather than crack tip blunting.
It needs to be mentioned that this section can only provide a rough overview outlining some of the frequently observed damage phenomena and the associated mechanisms in current AHSS.[275,276] The number of investigations is this field is still very limited, especially for the second and third-generation AHSS.[277,278,279,280,281] Therefore, more detailed characterization on damage mechanisms and the associated dislocation effects, local chemistry, and structure of interfaces and local stress/strain states upon deformation need to be conducted for these steels, in order to achieve a systematic and fundamental understanding on damage mechanisms. This knowledge is essential for the further improvement of the formability, toughness and fatigue properties in AHSS.
2.10 Hydrogen Embrittlement in Advanced High-Strength Steels
Hydrogen embrittlement (HE), since its first observation by Johnson in 1874,[282] is a serious problem in most high-strength metallic alloys, particularly in steels.[49,283,284,285] The risk of HE has triggered multiple studies since more than 100 years.
Hydrogen’s most striking effect on high-strength steels is a sudden and often unpredictable decrease in formability, toughness, and generally in the material’s resistance to crack propagation, phenomena which are jointly referred to as HE.[205,286]
Different aspects of hydrogen and hydrogen-related embrittlement have been covered, and comprehensive reviews corresponding to each aspect have been published.[52,279] These aspects and some recent reviews include (a) H trapping and migration[287]; (b) fundamental HE mechanisms including hydrogen-enhanced decohesion (HEDE),[288] hydrogen-enhanced localized plasticity (HELP),[289] interplay between HEDE and HELP,[177] hydrogen-enhanced strain-induced vacancies (HESIV),[290] adsorption-induced dislocation emission (AIDE)[291], and the defactant concept[292]; (c) hydrogen–dislocation interaction[293]; (d) H mapping techniques[52]; (e) HE response in specific types of steels (e.g., martensitic,[285] DP[3] and high-Mn austenitic[294] steels); (f) methods of preventing HE.[205]
Despite the large numbers of studies conducted particularly on steels, substantial disagreement among some of the HE models exists. The controversies derive from the lack of convincing evidences for individual HE mechanisms and phenomenological similarities among several of these mechanisms in terms of their association with different fracture modes, i.e., different HE models can result in very similar fracture modes such as intergranular and cleavage-type fracture. Another aspect that makes the proof of the prevalence of certain HE mechanisms so challenging are the tremendous experimental difficulties associated with imaging the concentration of hydrogen at a microstructural scale.[3,17,27,52,176,295,296,297,298,299,300]
Therefore, this section does not aim at developing a detailed review of all possible HE effects as covered already by several publications in this field,[50,205,279,284,301,302,303,304,305] but instead emphasis is placed on the description of the current research status of HE in the field of AHSS. From this analysis the most critical problems and challenges for understanding HE mechanisms in AHSS are filtered, with the intention to shed light on future research directions.
The study of HE in AHSS has mainly concentrated on the first and second generations (e.g., high-strength ferritic or martensitic,[285] DP,[3] TRIP,[49] and TWIP[294] steels). Among these studies, most investigated the influence of H charging condition, H content, mechanical and microstructural conditions on the HE susceptibility, and H-induced damage characteristics. Only a few developed an in-depth discussion on the active HE mechanisms. In contrast, for the more recently introduced steels (such as medium-Mn and lightweight steels), studies about HE are more limited.[294,300] Understanding the active HE mechanisms in AHSS is a rather challenging task. It relies on the accuracy of the HE models proposed generally from single-phase ‘model’ materials, which are still highly debatable. In addition to this critical point, three other challenges also have to be resolved. Particularly, direct evidence of the local trapping and accumulation, distribution, and resulting concentration gradients of H need to be mapped in complex microstructures.[27,52,176,296,306,307] There is a large variety of potential H trapping sites existing in AHSS, e.g., dislocations in the different phases, grain and phase boundaries, retained austenite, twin boundaries, stacking faults, precipitates, inclusions, voids, solute atoms, and vacancies (some of these trapping sites are shown in Figure 24). This is due to the highly complex microstructures in these types of steels, pertaining to phase constituents and fraction, grain and crystal cluster size, phase morphology and percolation, defect type and density, critically influencing local H distribution and concentration. Thus, obtaining more reliable experimental and theoretical information about such microstructure-specific H distribution is a prerequisite of understanding the HE behavior. For example, whether H segregates to dislocations or certain interfaces (e.g., grain, twin or phase boundaries) along with the segregating amount would strongly determine the prevalent HE mechanisms, i.e., a plasticity-related HE mechanism like HELP, AIDE, HESIV, or a decohesion-controlled HEDE mechanism. Moreover, modern AHSS often show complex deformation mechanisms, such as TRIP, TWIP, and planar dislocation glide (Figure 24). Such deformation-driven evolution of microstructure, sub-microstructure, and defects would greatly change the local thermodynamics and kinetics for H migration/redistribution during the course of processing and in service, which then alters the materials’ response to HE. This means that not only these microstructure-specific static trapping features, but also the kinetic of the redistribution of the local H content has to be analyzed.

Schematic illustrations of different microstructural features in multiphase AHSS (DIMT: deformation-induced martensite, DT: deformation twin, SFs: stacking faults, GNDs: geometrically necessary dislocations)
Secondly, the multiphase composite-like microstructure of many AHSS results in a complicated stress/strain partitioning and localization upon deformation, which needs to be probed in order to better understand the stress and strain-driven redistribution of H and to learn how to avoid or attenuate micromechanical stress/strain peaks in such materials.[264,279] The developed inhomogeneous hydrostatic stress field and local dislocation movement influence the H migration process thus the HE response. More specific, H atoms would tend to move to the areas with a high stress concentration. Dislocations can also transport hydrogen during their motion (e.g., from the grain interior towards the grain boundaries). The build-up of an enhanced local H concentration, driven by local stress fields, and dislocation gliding thus favor the occurrence of damage nucleation. A typical example for this has been reported in austenitic TWIP steels. In these steels, H-induced grain boundary and twin boundary cracking have been observed.[300] However, the total amount of segregated H is not expected to be pronounced at austenitic grain boundaries due to their relatively weak interaction with H. The observed H-induced grain boundary cracking in these steels was thus explained by the high stress concentration and local H trapping at these interfaces developed during deformation.[300] A detailed study on the mechanisms of HE during fatigue loading recently showed that hydrogen promotes the intense formation of ε-martensite during low-cycle fatigue.[308] Figure 25 displays ECC images of typical microstructures of a TWIP steel exposed to low-cycle fatigue with and without the presence of hydrogen. When the material is loaded under hydrogen ε-martensite is formed and the typical dislocation walls show lower dislocation densities.

ECC images of typical microstructures of a high-Mn TWIP steel exposed to low-cycle fatigue loading without the presence of hydrogen (a) and with the presence of hydrogen (b). Comparison of fatigued microstructures deformed for 50 cycles at a local strain amplitude of ~ 0.6 to 0.8 pct. The crystallographic direction of the principle strain is almost identical for both samples (Refs. [314] and [315] respectively). The areas marked by blue rectangles were used to determine the dislocation density. The intersections of individual dislocations with the surface are marked by red dots. The dislocation density has been determined by dividing the total number of dislocation intersection points by the area of the rectangle (see details in the section on ECCI analysis)
The impingement of ε-martensite on grain boundaries leads to rapid crack formation at large-angle grain boundaries in TWIP steels. Twin boundaries, in contrast, were not affected at all. An example of the damage formation is shown in Figure 26. This investigation shows that in the case of fatigue loading most of the known effects contributing to hydrogen embrittlement in AHSS (e.g., HELP, HEDE, stabilization of the HCP-phase, etc.) act together, promoting accelerated damage formation.

(a) ECC images showing intergranular crack propagation in a fatigue-loaded and hydrogen-charged high-Mn TWIP steel after 50 cycles at a local strain amplitude of 0.9 pct. (b) Magnified view of figure (a). The red and green arrows in the magnified region indicate the nucleation and propagation direction of the intergranular cracks, respectively
Finally, the deformation mechanisms and their change due to the presence and accumulation of H in different types of AHSS need to be systematically understood.[205,309] Many deformation modes such as TRIP (deformation-induced transformation from austenite to α’-martensite or ε-martensite), TWIP, partial and perfect dislocation gliding, dynamic strain aging (DSA) can occur simultaneously in some AHSS (e.g., medium-Mn and lightweight steels). The microstructural and mechanical conditions for the occurrence of these deformation mechanisms have not been fully understood. In steels containing more than one deformation mechanisms, the occurring sequence and quantification of these mechanisms are also important. Further, the interaction of H with each of these deformation mechanisms is different and often complicated. For instance, H has been proposed to either increase or decrease dislocation mobility, depending on materials, H-dislocation binding energy, and testing conditions.[310] It has also been reported that H can reduce the stacking fault energy (SFE) of austenite, thus promoting the occurrence of low-SFE deformation mechanisms (e.g., ε-martensite or α’-martensite formation[303]). However, the quantitative relation between H concentration and the SFE value in different steel systems remains unknown.
3 Recent Progress in the Experimental Characterization of Advanced High-Strength Steels
3.1 Aberration-Corrected Scanning Transmission Electron Microscopy for Advanced Steels
In scanning transmission electron microscopy (STEM), a convergent, high-energy electron beam is scanned across an electron transparent specimen in a raster fashion. The electrons are then scattered into the far field after passing through the specimen and they hit an annular detector, which is located in the diffraction plane, Figure 27. This process is repeated for each probe position in a rectangular raster grid. If the detector has a small diameter and sits on the optic axis covering an angular range smaller than the convergence angle, a bright-field (BF) image is formed. An annular dark-field (ADF) image is generated, when the detector is collecting only the electrons scattered to high angles. In ADF imaging, the image intensity can thus essentially be described as a convolution of the probe intensity (position dependent) with the projected atom potentials, resembling conditions for incoherent imaging. High-angle annular dark-field (HAADF) conditions are typically realized when only electrons scattered to angles of > 50 mrad to ~ 200 mrad are collected by the annular detector and hence the image intensity shows a strong atomic number (Z) dependence according to the Rutherford scattering cross-section. In modern microscopes, various STEM detector signals can be acquired simultaneously.[311]

Schematic incident electron beam conditions, annular detector geometry, and most important angles used in a STEM
In a simplified description, the resolution in STEM depends on the electron wavelength, the probe convergence angle, and the electron source coherence and brightness. All these parameters govern the probe size. Modern instruments utilize high brightness Schottky or cold field emission guns and hence the resolution is mainly limited by lens aberrations of the probe forming lens above the specimen. The rapid progress in the development of aberration correctors enables the correction of up to fifth-order coherent aberrations, including astigmatism, coma, or spherical aberration, only to name a few. This allowed to increase the numerical aperture of the probe forming lens to semi-convergence angles of > 25 mrad and with this resolution of down to 50 pm was achieved.[311]
Besides an improvement in lateral resolution, aberration correction also leads to a reduction of the depth of focus to only a few nanometers, since it is inversely proportional to the square of the semi-convergence angle. Moreover, when the sub-Ångstrom electron probe is located over an atomic column that is aligned in beam direction, when the crystal is oriented in a low index zone axis orientation, the electrons channel down the column since the least dispersive and most bound states (1s or 2s-like) are excited.[311]
3.1.1 Challenges of using scanning transmission electron microscopy for advanced high-strength steels
Imaging the atomic lattice and the internal defect structures in AHSS opens new insights to further advance our understanding of the structural features of their elementary microstructural building blocks. However, in ferromagnetic steels with ferritic or martensitic matrices, the sample volume has to be minimized to reduce the disturbance of the electron beam. Hence, focused ion beam (FIB) sample preparation is employed to prepare site-specific specimens with micron-sized dimensions. The resulting surface damage layers and often inhomogeneous thicknesses of the TEM specimens strongly limit the interpretation of high-resolution lattice images, especially ones obtained through phase contrast TEM. The incoherent nature of the imaging process, electron channeling, and reduced depth of focus in aberration-corrected STEM are less prone to sample imperfections, but scan distortions limit the quantitative interpretation of such images. Novel imaging modes, where a high number of consecutive frames are acquired with small pixel dwell times, registered and summed up have shown to overcome these limitations and a precision to locate the position of atomic columns of < 10 pm has been demonstrated.[312,313]
Imaging the atomic lattice and defect structures in AHSS is one aspect, the other is its correlated elemental distribution. Especially the C distribution plays a decisive role in triggering phase transformations, but is challenging to detect it quantitatively in (S)TEM. Even through spectroscopic techniques, such as energy dispersive X-ray (EDS) or electron energy loss spectroscopy (EELS), the obtained signals are disturbed by surface C contamination and insufficient count statistics strongly limiting its quantification. However, it has been shown that even atomic resolution STEM can be correlated with APT to achieve ultimate lattice and compositional resolution.[168]
3.1.2 Application to advanced high-strength steels
Twinning-induced plasticity (TWIP) in low stacking fault energy, high-Mn FCC steels has been intensively investigated and the atomistic origins of twin nucleation play a decisive role in understanding their outstanding mechanical properties. Casillas et al.[314] demonstrated the formation of extrinsic stacking faults (ESF) without pre-existing intrinsic stacking faults (ISF) by aberration-corrected STEM. They showed in 〈100〉 grains that ESFs serve as twin nuclei in a low-carbon TWIP steel macroscopically loaded uniaxially under tension up to its ultimate tensile strength. Atomic resolution STEM imaging even confirms that ESFs contribute to twin growth by the glide of two Shockley partial dislocations bounded by ESF on {111} planes adjacent to the twin. Direct imaging of the pole mechanism becomes available where a perfect dislocation splits into Frank and Shockley partials. Even the atomic lattice in regions with severe lattice distortions, e.g., the core of a Frank dislocation terminating at an ISF produced by the glide of a Shockley dislocation, becomes accessible.[314]
High-Mn steels with increased Al content exhibit outstanding strength at reduced alloy densities, which is related to the precipitation of nanoscale coherent κ-carbide precipitates. Aberration-corrected STEM was recently employed to shed new light on the shearing of κ-carbide particles and the intrinsic strain evolution imposed by the coherent precipitates.[156,168] Detailed TEM investigations revealed that planar slip dominates room-temperature deformation, which results in shearing of the ordered κ-precipitates. Atomic resolution STEM observations confirmed the presence of dislocation debris from the shearing process of an atomically sharp slip band at the κ/FCC–matrix interface. From the Z-contrast nature of the imaging process in STEM, it can even be concluded that the chemical order of the κ-phase remained unaffected.[156]
The intrinsic nature of the coherent interfaces of these κ-carbide precipitates and the surrounding FCC–matrix was quantified by measuring the internal strain state and local interface structure at atomic resolution. It was shown that the coherent κ/FCC–matrix interfaces exhibit only a slight roughness, on the order of a few atomic layers, and appear otherwise abrupt by quantifying the local-order parameter obtained from atomic column peak intensities.[168] By removing non-linear scan distortions[313] it was even possible to measure the local strain evolution in a ~ 2 nm narrow FCC–matrix channel, establishing that the FCC–matrix embedded in-between two adjacent κ-precipitates is tetragonally distorted. This severe lattice distortion strongly affects the C solubility, which is so far only accessible by first-principles calculations, but may even affect the trapping of hydrogen in these regions. The ordered nature of the κ-precipitates with Fe3AlC base structure can also be quantified on a column-by-column basis. Figure 28 shows an atomic resolution STEM micrograph of a narrow FCC–matrix (γ) channel and two adjacent κ-precipitates. The two insets illustrate the experimental mean unit cell of the left-sided κ-precipitate as well as the projected crystal structure of the stoichiometric Fe3AlC structure viewed in [001] orientation. A close inspection of the atomic column peak intensities of the mean κ-unit cell reveals two distinct sublattices. The atomic columns with normalized peak intensity of ~ 0.3 to 0.4 correspond to the Al-sublattice. The Fe-sublattice is represented by atomic columns with normalized peak intensities of > 0.7. The ordering of interstitial C atoms can be indirectly seen by an increased peak intensity of every second Fe-sublattice column. The additional C atoms along the projected atom columns lead to an effective increase in the projected potential and hence a higher peak intensity.

Figure reprinted with permission from Ref. [168]
Aberration-corrected STEM image viewed along [001] of a narrow FCC-matric (γ) channel embedded in-between to κ-carbide precipitates.[168] The upper inset shows the mean unit cell extracted from the left κ-precipitate. The atomic column intensity is normalized to the maximum peak intensity. The lower inset illustrates the corresponding projected crystal structure of Fe3AlC. Its crystal unit cell is outlined by black lines.
3.1.3 Future directions of using scanning transmission electron microscopy for advanced high-strength steels
The rapid development of advanced STEM techniques will provide unprecedented insights into the atomic structure and elemental distribution of AHSS. It was recently shown that the atom positions in individual nanoparticles can be resolved by atom counting or directly through atomic resolution STEM tomography.[315] These techniques could be used in the future to resolve the 3D atomic structure of complex nano-precipitates or defects in AHSS and how they contribute to strengthening. Novel techniques employing segmented or pixelated STEM detectors have shown great potential in resolving light elements even in complex crystal structures. These methods might in the future be used to determine the distribution of light or even interstitial elements at atomic resolution. Moreover, new developments in detector technology in spectroscopy might enable to resolve both the atomic lattice of defect structures and precipitates along with their associated compositional fluctuations at atomic resolution.
3.2 Atom probe Tomography for the Investigation of Advanced Steels
APT has risen in prominence over the past decades to become a routine microscopy and microanalysis technique for the characterization of nanostructured materials.[316,317,318,319] The strength of APT lies in its capacity to provide three-dimensional mapping of the elements with high spatial resolution, notwithstanding their atomic number. APT is hence perfectly suited to analyze the distribution of light elements, particularly C and B, with a sensitivity that can be in the range of only tens of parts-per-million. AHSS are microstructurally very complex. Understanding, controlling, and confining segregation and second-phase nucleation is key to improving their properties. APT appears to be a perfect complement to electron microscopy and is a key technique to understand fundamental mechanisms in steel research. APT also offers opportunity for direct comparison with atomistic simulations,[320,321,322,323,324] with forays into steels.[159,160,165,168,325]
APT exploits the effect of an intense electrostatic field, in the range of 1010 V m−1, to cause the desorption and ionization of the atoms from the surface of a specimen shaped as a sharp needle, in a process known as field evaporation.[326] Each ion is accelerated by the electrostatic field away from the specimen’s surface, and the thus projected ions are collected by a time-resolved, position-sensitive particle detector.[327,328,329,330] The geometry of the specimen provides the projection with a magnification in the range of 106, so interatomic distances can in principle be resolved.[331] Time-control over the field evaporation process is gained by either superimposing high-voltage pulses[332] of short laser pulses[333,334,335] onto a direct current (DC) voltage. Knowing when the ion is generated and when it strikes the detector allows for performing time-of-flight mass spectrometry, thereby enabling the identification of the elemental nature of each collected ion. Upon collection of the data, the time-of-flights are converted into mass-to-charge-state ratios, and the impact position and sequence in which ions are collected are used to build a three-dimensional point cloud.[336,337]
APT has gone through a renaissance in the past 15 years thanks to the availability of reliable commercial instruments enabling the routine collection of data,[329] the implementation of stable laser sources,[334] in particular in the ultraviolet (UV) range,[338] and the availability of focused ion beam (FIB) and advances in data processing.[339,340,341] The FIB has allowed to precisely target the preparation of specimens for APT[342,343] that enabled to avoid the trial and error approach of the previous decades. Laser-pulsing lifted the requirement that the specimen must be a good electrical conductor to be analyzed by APT,[319,344,345,346,347] but also increased the yield significantly.[348] The use of FIB allows to first select a microstructural feature of interest by using the scanning electron microscope, including using advanced techniques such as electron backscattered diffraction[189] or electron channeling contrast imaging for instance.[349] The FIB is then used to cut free and extract a small beam of the material containing the feature of interest, which is subsequently deposited onto a support and sharpened.[343] The flexibility offered by the FIB for specimen preparation enables facile correlation with transmission electron microscopy (TEM) by making specimens on a support that is compatible with holders for TEM.[211,350] Much effort has indeed been dedicated to enable such correlation of composition and structure on the same microstructural features,[351,352,353,354] including at very high spatial resolution.[355] In steel, these approaches have been used to investigate solute segregation at crystalline defects, i.e., grain boundaries[169] and dislocations,[356] as well as carbides[168] up to an unprecedented level of precision. The combination of APT and high-resolution scanning transmission electron microscopy (STEM) is showcased in Figure 29 below.

Figure reprinted with permission from Ref. [168]
Example of a correlative electron microscopy–atom probe tomography study, conducted on a low-density steel with composition Fe-26.7 pct Mn-14.0 pct Al-5.3 pct C (at. pct). The three images show (a) STEM images of a needle-shaped specimen obtained under annular bright-field conditions, (b) image taken from the same needle region and in the same instrument but under high-angle annular dark-field conditions, and (c) APT reconstruction of the same needle. Pronounced contributions from diffraction contrast are visible in the ABF image of (a), as seen in the contrast modulations indicating the location of the matrix/carbide (γ/κ) interfaces. The outer shape of the volume from which the APT reconstruction was obtained is highlighted in (a).
Finally, in principle, quantitative spatial analysis of hydrogen is possible, and is of high relevance to further understand hydrogen embrittlement in advanced high-strength steels.[177,205] Recent forays in this direction via isotopic marking (i.e., deuteration) have been reported in steel[27,306,307,357] and other metallic materials,[358,359] with controversies still in the interpretation of the data.[27,306] The full site-specific preparation of specimens at low temperature,[360] and their transfer into the instrument at cryogenic temperature under ultrahigh vacuum conditions[361] are current areas of significant development in the field.[296] These are necessary steps to ensure that contamination-free specimens are really analyzed.
3.3 Use of Field Ion Microscopy for Studying Advanced High-Strength Steels
Field ion microscopy (FIM), invented by Erwin Müller,[362] was the first technique to image individual atoms on the surface of a metal,[363] as well as crystalline defects such as vacancies[364] and voids,[365] dislocations,[366] and grain boundaries[367] in pure metals.
FIM relies on the field ionization of an imaging gas in the vicinity of specimen, which is a phenomenon that occurs due to the high electric field (109 V/m) attained at the apex of a sharp needle-shaped specimen. The imaging gas atoms introduced in the chamber are attracted to the specimen, due to the polarization forces and get thermally accommodated to the specimen’s cryogenic temperatures through a series of hops. The positive bias on the tip can sufficiently deform the potential energy landscapes for electrons in the imaging gas atoms to tunnel. This appreciable tunneling creates a current of gas ions, which now are propelled towards a phosphor screen to form a magnified and a near-stereographic projection of the specimen. A simplified schematic is shown in Figure 30, which shows a conservative design of a FIM. The specimen is mounted on to a stage, which is equipped with a cryostat and a high-voltage power supply, to cool the specimen and to generate the required field at the specimen’s tip, respectively. A closed-cycle helium cryostat can reach temperatures as low as 4K, however, can be changed as required by the user. The stage is enclosed in an ultrahigh vacuum chamber (with pressure being 10−10 to 10−11 torr), with inlets for imaging gas and for vacuum pump. Usually, a micro-channel plate (MCP) coupled with a phosphor screen is used in the chamber to capture the images. Inert gases are generally used as imaging gas, either individually or as a mixture. The modern FIMs are also equipped with charge-coupled device (CCD) cameras, to digitally record the images formed at the detector. This enabled FIM to record atomically resolved images of the surfaces of metals and dilute alloys. Further, implementation of high-voltage pulses to gradually remove the specimen surface atoms, further led to the development of a three-dimensional FIM (3DFIM). 3DFIM has been employed to study radiation damages, precipitation behavior, dislocation and solute interactions, etc.

Schematic of a field ion microscope
AHSS have very complex microstructures. Understanding, controlling, and confining second-phase nucleation in these alloys is a key to improving their properties, which can be achieved for instance through segregation engineering. FIM can contribute significantly in this area owing to its atomic-scale resolution capabilities. Samples for FIM have to be shaped into very sharp needles with end radius typically 50 nm. This can be achieved either by electropolishing, or sample preparation using focused ion beam microscopes. Although 3DFIM can render much required three-dimensional atomic-scale information, a glaring drawback is its inability to deliver chemical information of the imaged atoms. Another issue, FIM is often limited to only some pure metals or dilute alloys. In such cases, contrast is expected to arise when atoms in secondary phases require a different electric field to depart from the surface compared to the surrounding matrix. This causes the development of different local radii of curvatures. The elemental nature of the imaged atom may also play a role.[368] FIM has therefore been used extensively for the characterization of metallic alloys[369] including steels,[370] mostly in combination with atom probe.[371,372,373]
There is a renewed interest in FIM,[374] since its spatial resolution in three dimensions remains unparalleled. Approaches have been proposed to stack field ion micrographs and allow for three-dimensional reconstruction FIM (3DFIM).[375] Additional processing of sequence series of such images allows for a full atomistic reconstruction of the local atomic arrangement.[376,377] 3DFIM has been employed to study e.g., radiation damages,[378] precipitation,[372] crystalline defects dislocation[375], and solute interactions with defects.[379] Recent developments and application of machine learning to FIM[380] further enhance the data obtained from these techniques. There are also vastly unexplored possibilities to use mixtures of imaging gasses to enhance contrast and possibly image all species in an alloy for instance.[381] The main frontier in FIM research is to enable direct identification of the elemental nature of the imaged atom.
Most of the Fe-based alloy systems can be imaged using Ne as imaging gas. To also correlate the structural information obtained from FIM, APT probing of the same surface region can be carried out, in a combined, i.e., correlative FIM and APT experiment. References 80,116,356 suggest nucleation of a confined phase at dislocations and at grain boundaries through segregation in a Mn-rich steel. Often identifying the phase or crystal structure of a nucleated phase is challenging. TEM can provide an indirect confirmation of a different phase through electron diffraction. However, owing to the small size of the phase, especially at dislocations and the small volume fraction of such phases, the electron diffraction patterns analysis can be hard.
In order to investigate the presence of a different phase, a correlative FIM and APT study has been carried out on a Fe-9 at. pct Mn and has been shown here. The Fe-9 at. pct Mn was cold rolled to 50 pct after a homogenization treatment at 1373 K. This was followed by annealing at 723 K for 6 hours to promote Mn segregation. The samples for FIM and APT were prepared on a FEI Helios Plasma focused ion beam (PFIB) using a Xe source on commercial silicon micro-tip coupons (Cameca Inc.) as support. Specimens were sharpened by using a 30 kV Xe+ ion beam, followed by a 5 kV final cleaning step to remove regions with higher concentrations of implanted high-energy Xe+ ions. The result of correlative FIM and APT done on a local electrode atom probe (LEAP) 5000 XS instrument is shown in Figure 31. FIM imaging for the alloy was done using Ne as imaging gas. Mn appears darker in FIM, as Ne prefers to ionize from the Fe atomic sites which are at a higher field. An edge dislocation lying on a (110) plane can be seen emerging in the FIM image (indicated by a red arrow). A low-angle grain boundary is visible as well (highlighted by black arrows). A consequent APT was done on the sample to evaporate 60000 atoms from the surface. From this analysis, a 2D spatial composition map of Mn was created. The locations which show pronounced Mn enrichment can be found to be coincident with the edge dislocations and grain boundaries. The true Mn decoration of the grain boundary region might be subject to errors as the statistics are quite poor as only few layers were evaporated in region in APT. The grain boundary shows a segregation content around 25 at. pct of Mn. However, such unique correlative FIM and APT directly combines the structural information such as the edge dislocation and low-angle grain boundary with the amount of segregation.

Correlative FIM and APT analysis revealing the enrichment of Mn to defects such as a grain boundary (black arrows) and a dislocation (red arrow). The four images with varying transparency of concentration map are shown to emphasize the location of defects and enhanced Mn concentration (Color figure online)
Some of the imaged atoms in the FIM image can be seen departing the usual bcc lattice positions. However, this is completely qualitative and based on a visual inspection of the image. Since the specimen was heavily deformed, a complex network of dislocations, which, when exposed at the tip’s surface could give rise to a similar structural discrepancy. The problem stems from not being able to image both Mn and Fe at equal intensities. The presence of Mn is only inferred through a correlative APT. Although the current investigation cannot concretely prove the presence of a new phase, it highlights that a combined APT and FIM analyses can answer many structural and chemical problems in AHSS. Recent developments and application of machine learning to FIM[380] and APT[341] can further enhance the data obtained from these techniques. Another possibility would be to use a mixture of imaging gasses to enable imaging all atomic species in the alloy.
3.4 Analysis of the Microstructures of Advanced High-Strength Steels by Orientation Microscopy and Electron Channeling Contrast Imaging
3.4.1 Microstructure analysis of high-strength steels by advanced scanning electron microscopy probing methods
The mechanical properties of AHSS largely depend on their complex microstructures. The exact quantitative influence of individual microstructural elements (e.g., dislocations, grain boundaries, phase boundaries, volume fractions of the relevant microstructure constituents, types of phases, martensite island dispersion and shape, etc.), however, is usually not straightforward to measure and it is thus a general question how to obtain quantitative values on the types and amounts of these different microstructural ingredients and their topological features. Various electron diffraction techniques used primarily in scanning electron microscopy (SEM) are able to give comprehensive answers to these questions and it is the aim of this section to concisely introduce some of these powerful techniques. Some of the quantitative measures obtained from these advanced SEM-based probing methods are exemplarily illustrated for the case of dual-phase and related steels. The consequent application of these techniques will not only advance the understanding of the mechanisms that form microstructures of AHSS, but also open a road towards quantitative microstructure engineering.
The DP steels, selected here as an example material in this section, have a composition in the range of Fe-0.06…0.2 C-1.5…3 Mn-~ 0.25 Si (in wt pct) and small amounts of further elements.[2,15,382,383,384] Their microstructure is created by a rather simple heat treatment which allows these steels to be produced in large amounts as flat products. DP steels offer a good combination of strength and formability, which makes them suitable for applications for framework parts in vehicle bodies.[3] They consist of a ferritic matrix with usually 20 to 30 volume pct of martensite islands. This microstructure is formed in case of hot rolled plates in a heat treatment process consisting of an austenitization annealing, which usually leads to a complete transformation of the material into austenite, and a subsequent cooling. The latter usually consists of three steps, a quenching to a certain transformation temperature, a holding at this temperature to create a certain amount of ferrite, and finally quenching of the material to room temperature to transform the remaining austenite into martensite. The small amount of Si in the alloy and the moderate amount of carbon ensures that no cementite is formed during this treatment and most of the carbon partitions into the remaining austenite during the holding process. For cold rolled sheets, the microstructure is produced normally through a continuous/batch annealing treatment at intercritical temperatures, followed by quenching.
Modern scanning electron microscopes with thermal field emission guns, various sensitive detectors and flexible sample stages are extremely versatile instruments for detailed and quantitative microstructure analysis on bulk samples at high resolution, with large statistics, in 2D and 3D, and with the potential to perform in situ observations of various kinds. The most relevant signals to be detected for microstructural analysis are backscattered electrons (BSE) for electron channeling contrast imaging (ECCI) and electron backscatter diffraction (EBSD)-based orientation microscopy (ORM) as well as characteristic X-rays for compositional analysis via X-ray spectroscopy (XEDS) and secondary electrons (SE) for observation of surface morphology.[385,386]
3.4.2 Introduction to the electron channeling contrast imaging technique with respect to applications in steels
The ECCI technique allows direct observation of the most important extended lattice defects in AHSS, i.e., dislocations, stacking faults, interfaces, precipitations, and elastic strain fields by diffraction contrast in a way very similar to scanning transmission electron microscopy (STEM), but with the significant advantage that the observations are made on bulk and potentially large samples.[15,351,387,388,389,390,391,392] ECCI exploits the fact that the intensity of backscattered electrons obtained from a sample is modulated by the diffraction conditions of the primary electron beam (PEB) inside of the sample. In the case that the PEB impinges on the crystal lattice at an angle corresponding (almost) exactly to the Bragg angle of a set of parallel lattice planes the electrons may travel through the lattice in a way that can be imagined as total reflection of the electrons at these set of lattice planes. In this case most of the electrons are able to channel deep into the crystal lattice and only little backscattering will occur, i.e., the illuminated area appears dark. In other cases, when no lattice channels are available for the PEB, electron backscattering will occur in various intensities, depending on the particular direction of the PEB with respect to the lattice. Lattice defects, for example dislocations, locally distort the electron channels through the lattice and thus lead to localized strong electron backscattering. The defects thus appear with high intensity on a low-intensity background in an ECC image. Figure 32 shows a low-magnification ECC image of a microstructure of a 4 pct tensile-deformed DP 800 steel. In this image, ferrite grains show homogeneous brightness with strong contrast between different grains. Some ferrite grains appear very dark; they are channeling conditions for some low-indexed lattice planes. This situation enables direct observation of lattice defects as visible in Figure 33 (see below). Those grains, which appear bright, are usually in multiple-plane conditions where several high-indexed lattice planes are excited simultaneously. These grains show no clear defect contrast. The martensite phase appears almost exclusively bright because areas with high elastic strain gradients usually do not form suitable electron channels and, thus, almost always lead to backscattering rather than channeling. Figure 33 displays a highly magnified ECC image of a grain in exact channeling conditions. The grain in the center is oriented such that the electrons channel along (or “are diffracted by”) the {110} lattice planes. Dislocations appear as sharp, white line features on a dark background. From this kind of images it is possible to obtain information relevant for the mechanical properties of the material, e.g., type and density of dislocations but also curvature and potential dislocation reactions (see e.g., Refs. [390], [393], and [394]). Dislocation densities can be determined directly by dislocation counting and calculation of their density as “dislocation-surface intersections per area.” In Figure 33 an area of 1 × 1 µm2 is marked. In this area about 130 dislocation-surface intersections are counted, corresponding to 1.3 × 10¹⁴ m−2. A density of 1015 m−2, which would correspond to 1000 dislocation-surface intersections in the observed area is the uppermost limit that can be recognized with the ECCI technique. Higher densities can only be measured by EBSD using a GND (geometrically necessary dislocations) approach (see paragraphs below). Note that dislocation observation and quantification by ECCI is only reliable in the case that proper channeling conditions are active, Figure 34. They may be selected based on EBSD measurements as described, e.g., by Zaefferer and Elhami.[390] An example for the application of this controlled ECCI probing, i.e., cECCI, to the mechanisms of hydrogen embrittlement of high-Mn TWIP steels has been given above.

ECC overview image of a 2 pct tensile-deformed DP 800 steel sample. Grains with homogeneous brightness correspond to ferrite, those with strongly changing brightness are martensite. Examples: (1) ferrite grain in strong channeling condition with one set of lattice planes, (2) ferrite grain in strong backscattering condition with one set of lattice planes, (3) ferrite grain in multiple-plane conditions, and (4) ferrite grain in a polycrystalline strongly defected martensite area. (5) and (6) are ferrite grains with strong orientation gradients

ECC image of dislocations in the sample of Fig. 31. The grain is tilted to channeling conditions for the (110) planes. The (110) diffraction vector is marked. The red square marks an area of 1 µm2. Inside about 20 pct of all dislocation-surface intersections are marked (to keep most of the dislocations visible). In total, 134 dislocation intersections are found in this area corresponding to a dislocation density of 1.3 × 10¹⁴ m−2

ECC image of dislocations in a grain with strong orientation gradients. The red rectangle marks an area of 0.5 µm2. Inside about 20 pct of all dislocation-surface intersections are marked (to keep most of the dislocations visible). In total, 150 dislocation intersections are found in this area corresponding to a dislocation density of 3 × 10¹⁴ m−2
3.4.3 Dislocation density measurements in dual-phase steels using ECCI and EBSD-based KAM measurements
The above-determined dislocation density values match with the low tensile strain (4 pct) applied to the present sample. Surprisingly, the dislocation density is relatively homogeneous, in contrast to the general assumption that the formation of martensite during cooling leads to additional and heterogeneously distributed dislocations in the microstructure, which are thought to contribute to the higher strain hardening of DP steels and to the higher ductility compared to other HSLA steels. The reason for this observation lies in the fact that as-cooled DP steels contain two kinds of ferrite. One (F1) is almost free of dislocations with very low dislocation densities in the as-cooled state (< 1013 m−2). These grains also do not show any related orientation gradients as visible in EBSD maps (Figure 35, see below). In ECC images these ferrite grains are well visible as they show almost constant brightness with homogeneous channeling conditions and easily observable dislocations; some of these grains are marked in Figure 32. The second sort of ferrite grains (F2) contains a significantly larger amount of dislocations and related orientation gradients. These grains are usually found in the proximity to martensite grains. Due to the presence of orientation gradients these grains show heterogeneous channeling conditions, frequently limited to small stripes across the grain with areas of less than 1 µm2. Some grains of this kind are marked as (5) and (6) in Figure 32 as well. Dislocation counting yields an about three times higher dislocation density than the F1 grains.

Orientation microscopy maps of a DP 800 microstructure. (a) Inverse pole figure map for the normal direction, [001], of the map. (b) Grain-average EBSD pattern quality (PQ) map in color, overlapped with the pixel PQ map in gray values. (c) 2nd-neighbor kernel average misorientation (KAM) map. Misorientations above 2.5 deg are not considered in the KAM calculations. Martensite grains (M) are determined by applying a PQ-threshold value to (b). This is a good measure for the distortion of the lattice, which in turn affects pattern quality. Grains F1 and F2 are distinguished based on KAM values
The grains F1, F2, and M (martensite) are more clearly visible and quantifiable in EBSD maps as the one displayed in Figure 35. The M grains are separated from the F grains using grain-average pattern quality (Figure 35(b)). The F grains are distinguished subsequently using a kernel average misorientation (KAM) map (Figure 35(c)), where F1 grains are displayed in homogeneous blue (low KAM values) while F2 grains show characteristic substructures with higher KAM values. The KAM value can be used to determine the density of geometrically necessary dislocations (GND), which are those dislocations whose total Burgers vector, obtained by summation of all Burgers vector over a certain area, is not nil. It has been shown earlier[97,98,395] that the GND density is linearly dependent on the KAM value according to
where θtrue is the noise-corrected KAM value in radians, b is the length of the Burgers vector of the material (here b = 0.248 nm), a is the measurement step size, and c is a constant in the order of 1 to 4.[395] Here a factor of 2 will be used. The noise-corrected KAM value is obtained using a statistical approach described by Kamaya[396] and applied to DP steels by Schemmann.[384] It is calculated assuming that the KAM value of a large amount of kernels (> ~ 100) scales linearly with the size of the measurement kernel according to
where θmeas is the measured KAM value, θnoise is the noise value caused by the inaccuracy of the orientation determination from the EBSD patterns, θtrue is the true, noise-corrected value, and n is the size of the kernel, measured in multiples of EBSD measurement steps.
Applying this formalism, a GND density on the order of ρGND = 4.8 × 10¹³ m−2 is determined for grains F1 and of ρGND = 1.7 × 10¹⁴ m−2 for grains F2, respectively. F2 grains have about 3 times larger densities than F1 grains, as also found by ECCI. For all F grains an average value of 1.1 × 10¹⁴ m−2 is determined. A comparison of these values with the dislocation densities determined by ECCI (F1: 1.3 × 10¹⁴ m−2, F2: 3.0 × 10¹⁴ m−2) reveals that the GND densities are about half as large as the real densities. Other investigations regularly showed similar or even higher ratios, the GND-excess factor, feGND, between GNDs and total dislocation densities (up to 10).[397,398] All experimentally obtained data have been compiled in Table I. The data variation is due to local density variations in the case of ECCI and due to (estimated) inaccuracy of the EBSD data. It should be mentioned here that the dislocation densities in martensite cannot be determined reliably neither with ECCI nor with EBSD. For ECCI the reason is the lack of channeling conditions due to high gradients of residual stresses and a too high density of dislocations, for EBSD the main reason is the missing spatial resolution and the low pattern quality, which induces a very high noise level in the data. For the EBSD data it should also be considered that the total dislocation density is probably significantly higher than the GND density.
Recently, several authors revisited the possibilities to measure dislocation densities using EBSD. Shen and Efsing, in there small review,[399] concluded that the metric “grain orientation spread,” GOS, gives more reliable results than the KAM approach. It should be mentioned here, however, that both, KAM and GOS, only quantify GND densities, which are, in principle, only a measure of the heterogeneity of strain and not of the true total strain in a given microstructure area. Furthermore, if these metrics are used to calculate dislocation densities in order to obtain a measure for the strain hardening of a microstructure (see next section), it must be considered that an important part of dislocations is usually ignored as shown by the analysis above. Another recent paper compared the dislocation density results obtained by ECCI with those obtained by cross-correlation (CC) EBSD.[400] CC EBSD does not use a classical Hough transform for the analysis of EBSD patterns but it uses image cross-correlation of a number of regions of interest in neighboring EBSD patterns to obtain a very accurate measure of lattice rotation.[385,386,401] If CC EBSD is applied at very small map step sizes most dislocations may be recognized and the differences between EBSD-based and ECCI-based dislocation densities become small.
3.5 Magnetic Characterization of Advanced High-Strength Steels: a Versatile Tool for Tracking Microstructural Changes at the Bulk Scale
Depending on several metallurgical parameters, such as e.g., chemical composition and processing, AHSS display a variety of complex microstructures whose constituents are characterized by different magnetic states. Metastable austenite (γ) and ε-martensite are typically paramagnetic (and sometimes antiferromagnetic) in AHSS, whereas ferrite, bcc α′-martensite, and bainite are ferromagnetic at temperatures below their respective Curie points.[402] In this scenario, magnetic measurements emerge as a very attractive non-destructive tool for monitoring microstructural changes, including phase transformation in bulk scale of AHSS. By means of magnetic probing, one can obtain hysteresis loops (i.e., M(H) curves) as the ones displayed in Figure 36, where M represents the magnetization of the specimen and H the external applied magnetic field. Figure 36 shows the M(H) curves for a high-Mn steel cold rolled to several logarithmic strains (ε), as reported in our preceding work[403] and provide us important parameters, such as the saturation magnetization (Ms) and the coercive field (Hc). The Ms values mirror the volume fraction of ferromagnetic phases present in the specimen and thus they have extensively been used for tracking phase transformations in TRIP-assisted,[62,402] medium-Mn,[404,405] and high-Mn steels.[403,406,407] Figure 36, as an example, reveals the increase of the Ms values as a function of plastic deformation, thus revealing the formation of strain-induced α′-martensite upon rolling as confirmed by the EBSD maps displayed in Figure 36(b).

Figure reprinted with permission from Ref. [403] (Color figure online)
(a) Magnetic hysteresis loops of a high-Mn steel, cold rolled to high true strains (ε). Both the saturation magnetization (Ms) and the coercivity field (Hc) are indicated. (b) Evolution of the Hc parameter as a function of the true strain (ε), as reported in Ref. 403. The microstructure of the specimens deformed at ε = 0.22 and 1.56 are shown by means of phase maps obtained via EBSD. Austenite (γ), ε-, and α′-martensite are represented in green, yellow, and red, respectively.
In comparison to Ms, the coercive field (Hc) has been much less explored for evaluating microstructural changes in AHSS. Hc provides sensitive information about magnetic shape anisotropy in AHSS containing a high-Mn content. In this case, information regarding the size and distribution of ferromagnetic phases (i.e., α′-martensite) immersed in a paramagnetic matrix (i.e., parent austenite) can be inferred from the change of Hc.[403] To illustrate that and as an example, we consider the evolution of Hc as a function of strain in Figure 36(b), in conjunction with the corresponding EBSD maps. At low strains (ε = 0.22), the volume fraction of α′-martensite is low and it is found in the form of laths dispersed within the matrix. Such microstructural configuration is prone to create localized demagnetizing fields leading to a strong shape anisotropy, i.e., high coercivity. With the progress of deformation (ε = 1.56), the fraction of the α′-regions increases allowing them to coalesce, as shown in Figure 36(b). As a consequence, the coercivity decreases and drops the values of Hc. Differently, the coercivity in TRIP-assisted steels containing ferrite, bainite, and small fractions of retained austenite has been reported to increase as a function of straining, as a result of the increase in the population of pinning sites (e.g., crystallographic defects) that act against the motion of the magnetic domain walls. Although the behavior of Hc for high-Mn[403] and TRIP-assisted[408] steels are well documented, similar data for other variants of AHSS, such as e.g., Medium-Mn steels, have remained scarce in the literature.
When investigating magnetic measurements, one must also consider microscopic (Np) and macroscopic (Nm) demagnetizing effects arising, respectively, from the presence of inclusions and the specimen geometry.[402] Such factors strongly influence the linear portion of the M(H) curves at low applied magnetic fields and may introduce errors in the determination of the magnetic remanence, which is the magnetization that remains within the material when the stimulating field is switched off, i.e., H = 0. Although Np is an intrinsic parameter, Nm decreases with increasing the ratio length/width of the specimen. For this reason and from an experimental point of view it is always recommended to keep such ratio as high and identical as possible for a set of specimens to be analyzed. Once the values of the magnetic fields have been corrected by the demagnetizing factors, the experimental approach to saturation can then be described by a saturation rule according to
where Ms is the saturation magnetization, and where “a” (given in A/m) and “b” (given in A2/m2) are constants arising from microstructural features of nanoscale order (inclusions, voids, point defects, and microstresses) and crystal anisotropy, respectively. A more detailed evaluation of the parameters obtained from such M(H) curves and their corresponding relationship with the microstructure have been reported by Zhao et al.[402] for TRIP-assisted steels.
3.5.1 Magnetic characterization of TRIP-assisted steels
Successful design of TRIP-assisted steels is directly linked to the metastability of its retained austenite, tuned by austempering. Therefore, monitoring the volume fraction of this phase as well as its mechanical and thermal stability is important in that context. This can be achieved by means of both, ex situ and in situ magnetic measurements.[62,402] By comparing the Ms values of a γ-free specimen with the Ms values obtained from γ-containing samples, Zhao et al.[402] investigated the volume fraction of retained austenite formed after different austempering times in two Al-containing TRIP steels, named Al1.8 (0.20 pct C-1.53 pct Mn-1.8 pct Al-0.02 pct Si, in wt pct) and Al1.4P (0.18 pct C-1.52 pct Mn-1.4 pct Al-0.02 pct Si-0.08P, in wt pct). As shown in Figure 37, their ex situ magnetic probing revealed not only that the maximum amount of retained austenite is distinctly different for both materials but also that they are reached after different annealing times at 400 °C, enabling custom-tailored optimization of the austempering treatment for each material. The results were also compared to corresponding data from X-ray diffraction (XRD) for the same samples. It was found that the quantification performed by magnetic probing was more reliable since XRD measurements, in some cases, are susceptible to the influence of crystallographic texture and microstresses which can render identification and quantitative analysis of small phase fractions challenging.[402] In contrast, magnetic measurements are capable of accurately detecting minute microstructural changes such as formation of small fractions of austenite in TRIP steels, as demonstrated in Reference 402.

In situ magnetic measurements combined with thermodynamic modeling have also been shown to be very effective for tracking the thermal stability of retained austenite in TRIP-assisted steels.[402] By subjecting a TRIP steel (with 0.20C-1.52Mn-0.25Si-0.96Al, in wt pct) to a well-controlled cooling process down to 5 K in the presence of an externally imposed static magnetic field of 5 T, the γ → α′ reaction was monitored in real time and the experimental determination of the finishing temperature for the martensitic transformation (\( M_{f}^{{\alpha^{\prime}}} \)) of the material was successfully conducted. Once the martensite transformation start temperature (\( M_{s}^{{\alpha^{\prime}}} \)) is known or predicted, with the aid of thermodynamic calculations, the temperature dependence of the retained austenite fraction was then modeled by the authors:
where \( f_{\text{o}}^{\gamma } \) is the volume fraction of retained austenite at \( M_{\text{s}}^{{\alpha^{\prime}}} \) and \( \beta = ({\text{d}}G / {\text{d}}T)_{{\alpha^{\prime}}} /({\text{d}}G / {\text{d}}T)_{\gamma } \), i.e., the ratio between the slope of the temperature dependence of the Gibbs free energy for the α′-martensite and austenite, where T is the temperature in Kelvin.[62] Equation 14 is a modified version of the relationship between austenite fraction and temperature, originally proposed by Yu et al.,[409] yielding a good agreement with the volume fraction of retained austenite, determined experimentally via in situ magnetic measurements.
3.5.2 Magnetic characterization of medium-Mn steels
Medium-Mn steels are generally composed of ferrite and metastable austenite which may undergo martensitic transformation upon straining. Perlade et al.[404] tracked the evolution of the austenite fraction during tensile testing of a 5Mn-2.47Al-0.208C (wt pct) steel that was intercritically annealed at various temperatures (TIA = 740 °C, 760 °C, 780 °C), Figure 38. They observed that the rate of the martensitic transformation increased with increasing TIA for the investigated steel. In situ magnetic probing also allowed them to detect that such reaction occurs heterogeneously along some tensile specimens, provoking step-like transitions as indicated by arrows in Figure 38. Besides by locally scanning regions containing Lüders bands, the authors were also able to map the distribution of retained austenite along the gauge of the tensile specimens. The results reported in Reference 404 are good examples of how magnetic probing can serve to map and understand microstructural changes in real time and to select adequate intercritical temperatures in order to enhance the mechanical stability of austenite in medium-Mn steels.

Figure reprinted with permission from Ref. [405]
Evolution of the retained austenite fraction in a medium-Mn steel intercritically annealed at different temperatures (TIA). The fraction of austenite was deduced by means of in situ magnetic measurements conducted during tensile testing, as reported in 405
So far it is clear that the magnetization is dependent on the volume fraction of ferromagnetic phases of the specimen. However, its sensitivity related to internal or external applied stresses (i.e., Villari effect) makes us not to neglect the influence arising from magneto-elastic effects on the magnetic properties of AHSS measured under in situ conditions of straining.[405] Recently, Callahan et al.[405] demonstrated that even low stresses can produce non-negligible impacts on the magnetic properties of a medium-Mn steel without the occurrence of phase transformations, i.e., within the elastic regime of a tensile testing. Consequently, the values of Ms taken under in situ conditions cannot be directly used for phase quantification as it was performed in the ex situ cases reported above. In this context, the work of Callahan introduced the corresponding corrections for phase quantification taking into account the Villari effect. Considering this effect, the fractions of the ferromagnetic phases (viz. α ferrite and α′-martensite) in a medium-Mn steel exposed to mechanical loads can be given by the following expression:
where \( M_{\sigma }^{\text{s}} \) is the measured saturation under a mechanical stress; \( M_{\alpha }^{\text{s}} \) is saturation magnetization for a sample containing 100 pct of ferromagnetic phase; η is a constant in the order of 10−5 MPa−1; \( \sigma \) is the applied mechanical stress; and κ is taken as 2/3 in Reference 405. According to these authors, the use of this expression improves the accuracy of detecting austenite when it is present in high-volume fractions.
3.5.3 Magnetic characterization of High-Mn steels
Depending on the chemical composition (in general for a Mn content below 25 wt pct), the paramagnetic austenitic matrix in high-Mn steels may partially transform into α′-martensite upon straining or cooling, with or without the intermediate presence of ε-phase. Recently, the magnetic properties of high-Mn AHSS (17.6Mn-3.22Si-1.71Al-0.042C, in wt pct) which undergoes a martensitic transformation during straining and cooling was investigated.[403] Upon rolling, the initial stages of the α′-martensite formation induce strong shape magnetic anisotropy, as already demonstrated in Figure 38(b). Similarly, it was also observed that the formation of nano γ-grains during the early stages of the austenite reversion (e.g., 5 minutes of isothermal annealing at 500 °C) is sufficient to create local demagnetizing fields which leads to strong shape magnetic anisotropy. Further progress on the use of in situ magnetic probing for tracking the athermal formation of ε- and α′-martensite in this steel can also be found in Reference 403.
For the same 17.6 wt pct Mn steel, the austenite reversion and the Curie temperature (TC) of the α′-martensite were investigated using in situ magnetic measurements, conducted under slow conditions of annealing (0.05 °C/s) as reported in Reference 84. Thermo-kinetic analysis of the austenite reversion revealed that strong elemental partitioning takes place between the parent α′-martensite and the growing austenite during such annealing. Consequently, the α′ → γ reaction splits into two stages and the remaining α′-martensite is always characterized by lower Mn contents (~ 5.8 wt pct) when compared to the global chemical composition (17.6 wt pct). With the aid of thermodynamic modeling, TC was also investigated for the Mn-depleted α′-martensite and the obtained value of 632 °C was observed to be in very good agreement with the one determined experimentally (625 °C). In the hypothetical absence of elemental partitioning during austenite reversion, the chemical composition of the α′-martensite would not change and therefore TC of 445 °C could be expected. Our results precisely show how localized chemical changes, such as elemental redistribution among phases, play an important role on the magnetic properties of steels containing high amounts of Mn.
In the case of twinning-induced plasticity (TWIP) steels whose main strain hardening mechanisms are twinning and dislocation glide, some variants are reported to form small fractions of α′-martensite after severe straining.[406,407] In this context, the major paramagnetic contribution from the austenitic matrix must be taken into account in order to accurately quantify minor amounts of α′-martensite. For this purpose, the magnetic characterization of the paramagnetic austenite is given in Reference 406 where, e.g., the paramagnetic-to-antiferromagnetic transition of the austenite was monitored and found at 190 K (i.e., the Néel temperature). Detailed procedures for subtracting the austenite paramagnetic contribution from the M(H) curves can be found in References 406 and 407].
3.6 Application of Synchrotron Techniques to the Characterization of Advanced High-Strength Steels
3.6.1 Introduction to synchrotrons
Synchrotrons are particle accelerators in which electrons travel close to the speed of light on closed-loop circular paths. The motion of electrons is controlled by magnets bending the particle beam. Their magnetic field is synchronized with the kinetic energy of the electrons, hence the device name. The bending of the particle beam represents an acceleration of the electrons which leads to the emission of electromagnetic waves. In the case of synchrotrons the emitted wavelength is typically optimized to generate X-rays, where the flux is many orders of magnitude higher than the one produced by conventional X-ray laboratory sources. These enormous quantities of flux have two main advantages: monochromaticity and time resolution. Even when selecting a narrow wavelength bandwidth of the order of Δλ/λ ~ 10−4 still enough flux is available to conduct time-resolved experiments. The high flux reduces the exposure time needed for a single measurement, so that also rapidly evolving events can be characterized.
Synchrotrons offer a broad range of techniques to probe various materials aspects. General advantages of synchrotron measurements are their non-destructive nature that allows to observe the evolution of material phenomena in situ. Further, the deep penetration depth of hard X-rays allows to measure large volumes, giving access to good statistics. The high monochromaticity of synchrotron measurements results in sharp peaks in XRD patterns, giving more accurate information on lattice strain, lowering the chance of peak overlaps, and improving the detection sensitivity of phases that are present in low volume fractions.
Measurement time at synchrotrons is much costlier as compared to conventional laboratory sources. They are usually operated as user facilities where beam time is allocated based on a competitive proposal and review system, making sure that only experiments that are not feasible at conventional sources and only the most excellent research ideas are conducted.
3.6.2 Using synchrotron probing to study advanced high-strength steels
One of the most powerful and most often applied synchrotron techniques for the investigation of AHSS is XRD. The techniques employ an extended monochromatic X-ray beam confined by slits to a region of interest of a polycrystalline specimen. The specimen is usually measured in transmission mode, recording Debye–Scherrer rings (DSR) on a 2D detector behind it. These allow the quantification of phase fractions, lattice distortions, partitioning, dislocation densities, precipitation events and texture, among others. Mounting the specimen in a load cell or furnace enables to track these properties in situ upon loading or heating. The experimental possibilities for the investigation of AHSS are enormous and cannot be detailed here fully. The following section thus rather aims at showing the potential of synchrotron XRD for the investigation of AHSS by summarizing key results from selected publications that focus on mechanisms in this material class.
To tailor the mechanical properties of TRIP steels the onset of martensitic transformation in dependence on austenite grain size and composition must be known. However, characterization of this aspect by TEM and SEM is always compromised by strain relaxation at the specimen surfaces. Synchrotron XRD allows to overcome these limitations as shown by Jimenez-Melero et al. who monitored the martensitic transformation of individual austenite grains within the bulk of a low-alloyed multiphase TRIP steels during cooling.[410] The authors tracked the diffraction spots of individual grains on the DSR of austenite. The disappearance of a set of diffraction spots indicated the martensitic transformation of the corresponding grain. The diffraction spot position was used to calculate the lattice parameters and with this the C content in the austenite grains. Grain volumes were calculated from the integrated intensities of the diffraction spots. That larger austenite grains with lower C content transform first during cooling in martensite has been known longtime. However, this study allowed to quantify the relation between martensite transformation, temperature, C content in austenite, and austenite grain size in statistically representative manner.
A follow-up publication by the same author group shows the broad range of quantitative material parameters that can be accessed by detailed synchrotron powder diffraction analysis.[411] As before, the authors investigate low-alloyed TRIP steel in situ for different temperatures; this time additionally for different loading conditions. This experimental setup allows to correlate stress–strain curves from tensile tests at various temperatures, with the evolution of the austenite fraction, the partitioning of C from newly formed martensite into retained austenite, the strain partitioning in austenite and ferrite and texture. Lower C content austenite grains transform first leading to increase of C content in the remaining austenite. At lower temperature the mechanically induced austenite transformation is found to extend over a wider deformation range, leading to higher elongation to fracture.
The extensive material information from in situ synchrotron XRD experiments can be used for the development of micromechanical models that allow for the accurate prediction of material properties as illustrated by Reference 412 for the case of TRIP 800 and DP 980 steels. Ferrite and bainite peaks can be deconvolved precisely and the lattice strain evolution along different crystallographic directions, thus the strain partitioning between hard and soft phases in multiphase AHSS, can be quantified for all microstructure constituents. Using this as input parameters, a self-consistent model can be created that allows the accurate prediction of the macroscopic deformation behavior.
Lüders bands are commonly observed in medium-Mn TRIP steels. This plastic instability phenomenon leads to undesired macroscopic deformation inhomogeneities during steel sheet press forming and related operations. The conventional characterization approach for Lüders bands by digital image correlation (DIC) and infrared thermography during tensile tests only gives access to the in situ evolution of surface strain and local temperatures. Scanning a synchrotron X-ray beam over a mechanically loaded specimen allows to measure the local volume fraction of austenite, lattice strains, and dislocation densities at and in vicinity of Lüders bands of grains embedded in the bulk as demonstrated by Zhang et al.[413] on a medium-Mn TRIP steel. The Lüders band propagation was found to be accompanied with a sudden strain reduction along particular crystallographic directions of austenite. This information can be used to predict for example the Lüders band angle. Sharp gradients in austenite fractions, dislocation densities, and lattice strains were observed around Lüders bands which might be responsible for the localization of the work-hardening behavior and with that for the stability of Lüders bands.
In the case of TWIP steels, synchrotron XRD provides valuable information on the deformation mechanism in the bulk as shown by Yan et al.[414] As dislocation glide leads to continuous orientation changes while twinning leads to abrupt changes, the contributions of these fundamentally different mechanisms to the deformation process can be separated. Elasto-plastic modeling reveals alternating interactions between {111} 〈110〉 slip and {111} 〈112〉 twinning. Texture development is found to be determined mainly by dislocation gliding, not by deformation twinning.
3D damage evolution can be tracked by synchrotron tomography. Phase contrast tomography (PCT) uses a coherent beam that generates interference fringes at interfaces between high and low-density objects. This allows to detect smaller features with lower electron density differences as compared to conventional absorption contrast tomography. Using PCT, the damage evolution in TWIP steel was investigated.[415] A gradient of voids down to 1 mm of depth below the fracture surface was observed. The voids were organized in lines along the rolling direction. Although these voids coalesce to sizes of several microns, final damage occurs at much smaller microvoids as concluded from the ductile fracture dimple size of about 0.5 µm.
AHSS are in particular of interest for the automotive industry to be applied in forms of sheets. 3D synchrotron laminography is a tomography technique particularly suited for this geometry and can give valuable insights into damage mechanisms in situ.[416]
3.6.3 Unexploited potential of synchrotron-based 3D orientation mapping techniques for steels
In particular, 3D synchrotron orientation mapping (SOM) techniques which have been developed throughout the past two decades have high potential to deepen our understanding of AHSS. These non-destructive techniques map local crystal orientations and phases by either scanning over the specimen with a line or pencil beam. Depending on the variant, 3D datasets containing information on grain orientations, elastic strain, phases, grain morphologies, and grain boundary character are reconstructed by complex computational routines.
Such information is elsewise only accessible by 3D EBSD. However, 3D EBSD is a destructive technique and thus only allows to measure the microstructure at a single point of time while SOM allows to track the microstructure evolution over time.[97,395,417,418] Further, SOM allows to measure grains in their “natural” 3D stress field while 3D-EBSD information will be always compromised by strain relaxation at the surface. As explained above, mechanical stresses, heating but also a particular chemical environment can be applied to the specimen during SOM. This allows for full 3D crystallographic characterization of e.g., (abnormal) grain growth, precipitation of new phases, recrystallization, annealing or deformation twinning, stress-induced martensitic transformation, or stress-crack corrosion. Also, a close-up view into orientation gradients of selected grains in the bulk is possible based on these techniques,[419,420,421,422] enabling a statistical analysis of dislocation densities on particular slip planes in the bulk and thus providing ideal experimental insights for the verification of crystal plasticity modeling results. Application of SOM on AHSS would be particular useful for deepening our understanding of the 3D stress field required for martensitic transformation or twinning.
Due to the non-destructive nature of synchrotron techniques they can be correlated with further techniques that deliver additional information at the same location. To give one example, the combination of DCT and PCT can provide a full 3D picture of the influence of the microstructure on crack propagation. It can be analyzed on which slip system, in which direction, and with what growth rate a crack propagates and how this agrees with the Schmid factor. When the crack is found to slow down in front of a particular grain boundary this information can be correlated with the slip system compatibility across the interface. The datasets can be used to verify existing models that predict the 3D evolution of damage. Correlative DCT/PCT could be also used to understand the formation of voids associated with ductile damage or creep pores in terms of local stress intensities caused by grain anisotropy or the 3D growth rate of corrosion phenomena such as hydrogen embrittlement in terms of grain boundary character.
SOM techniques are powerful but go along with several experimental limitations. Steel specimens should have cylindrical shape and a diameter below 1 mm to yield enough transmitted X-rays at the typical energies in the range of 40 to 80 keV. Depending on the variant of SOM other restrictions might apply. The highest spatial resolution is currently achieved with scanning diffraction techniques (~ 200 nm) and future progress in X-ray optics might enable observation of twinned microstructures down to comparable length scales.
Synchrotrons are powerful tools giving access to a large variety of aspects in situ which are important for the understanding of AHSS. Potential of synchrotron techniques on AHSS is far from being fully exploited. This holds in particular for SOM and their correlative use with other synchrotron techniques.
4 Micromechanical Models of Microstructure, Damage, and Properties for Advanced High-Strength Steels
4.1 Advanced Numerical Solvers for Micromechanical Problems Associated with Advanced High-Strength Steels
The mechanical properties of metallic materials result from their internal defect population, i.e., from their microstructure. The superior properties of AHSS in comparison to conventional single-phase steels are a result of a much more complex microstructure that, firstly, contains multiple phases (Dual-Phase (DP) steels, Complex Phase steels[3,32,55,110,423]), and secondly, has a staggered internal hierarchy (bainitic steels,[8,64,85,424,425,426] martensitic steels[184,185,427,428,429]), and, third, can provide different deformation mechanisms (TRIP steels,[1,14,265,430,431,432] TWIP steels[151,158,193,197,433,434]).
To understand the behavior of existing AHSS grades and develop novel alloy concepts for grades with improved properties it is therefore mandatory to understand the mechanical behavior of both, the individual microstructural constituents and their collective interplay. Full-field simulation techniques that solve for the mechanical equilibrium on a discretized microstructure model allow to investigate the collective behavior in dependence of constitutive models for elasticity, plasticity, and damage of the individual constituents. By that, simulations provide a means to systematically study the influence of parameters such as hardening rate, crystallographic orientation, grain morphology, and second-phase distributions.
The numerical solvers typically used for full-field micromechanical simulations either based on the Finite Element Method (FEM)[435] or on Fast Fourier Transform (FFT)-based spectral solvers.[436,437,438] While the local approach taken by the FEM allows to discretize arbitrarily shaped bodies and is therefore required for forming simulations, the inherent inclusion of periodic boundary conditions in conjunction with a good computational performance make FFT-based spectral methods the option of choice for the modeling of periodic volume elements. The difference between both methods is schematically shown in Figure 39: While the global approach of the spectral solver requires to consider a domain of a regular shape, the local ansatz used by the FEM enables to consider arbitrarily shaped domains. A further issue related to the use of global ansatz functions are spurious oscillations in the solution fields close to discontinuities of the material properties.[439]

Figure inspired by Boyd[445] (Color figure online)
Comparison of discretization approaches for three types of numerical algorithms: (a) Spectral method, one high-order polynomial for the whole domain. (b) FDM: Multiple overlapping low-order polynomials. (c) FEM: non-overlapping polynomials, one per subdomains. The thin/colored lines illustrate which grid points (closed/black circles) directly affect the estimates of derivatives at the points shown above the lines (opened/colored circles). The thick black vertical lines in the bottom grid are the (sub)domain walls.
Grain and subgrain-resolved microstructure models for AHSS can be directly based on experimentally characterized microstructures. The first ever published FEM simulation of a DP steel microstructure, for example, was based on optical micrographs.[440] The availability of Electron Backscatter Diffraction (EBSD) imaging made it possible to measure not only the phase distribution but also the crystallographic orientation. While simulations using FEM either assume a single orientation per grain[441] or take the pointwise orientation into account[442] for spectral method simulations the latter approach is typically used[443]—even in three dimensions.[383] Figure 40 illustrates the increased complexity of the microstructural representation from 1974 to 2017. This figure demonstrates that not only the spatial discretization has significantly increased but also that the orientation information is nowadays used as an input to crystal plasticity-based constitutive laws.

Increasing complexity of microstructure models for micromechanical simulations. (a) Dual-phase steel model from 1974.[440] The phase distribution is shown in the top image where black color indicates martensite and white color indicates ferrite. The resulting distribution of plastic strain (εp) under uniaxial loading in horizontal direction is shown in the bottom image. (b) Dual-phase steel model from 2017.[383] Crystallographic orientation in terms of an inverse pole figure coloring and phase distribution (dark areas indicate martensite) are shown in the top image. The resulting distribution of equivalent total strain (εvM) under uniaxial loading in the horizontal direction is shown in the bottom image.
The information acquired from micromechanical simulations can (1) complement experimental results by providing information about the stress state which is not readily available from measurements, (2) be used to study the influence of the mechanical properties of the individual constituents[33] or (3) predict potential damage sites.[444]
Due to the complexity of the AHSS microstructures, simulation approaches that explicitly take all relevant microstructural details into account are the only modeling approaches that have sufficient predictive capability for the simulation of properties. Two scientific challenges result from this fact: Experimentally, 3D characterization techniques with high spatial resolution and fast acquisition times that enable to probe sufficient volumes are required.[97,446] Computationally, fast and robust numerical algorithms and physics-based constitutive models suitable for the material at hand need to be developed and they need to be capable of dealing with complex microstructure in full 3D (not in extruded 3D, where grains are assumed to be columnar[447,448,449]), Figure 41. Ideally, the micromechanical simulation tool is embedded into a multiphysics framework to consider additional effects such as temperature fields (due to the inhomogeneous dissipative production of heat during deformation), chemical diffusion (to capture elemental partitioning), damage (which is in many AHSS not triggered by non-metallic inclusions but by specific microstructure features and the associated high micromechanical contrast), and phase transformations (such as for instance the TRIP effect or martensite-to-austenite reversion).[450,451,452,453]

Figure reproduced with permission from Ref. [383]
Equivalent von Mises strain εvM (left) and von Mises stress σvM (right) pattern in a section of a 3D dual-phase steel microstructure (top) and in the corresponding 2D microstructure (middle) and the logarithmic of the ratio between them (bottom) mapped onto the deformed configuration of the 3D simulation (ε = 0.182). The section shown is parallel to the normal plane. A logarithmic scale is used for mapping the stress and strain values to in order to resolve details in both constituents (ferrite, martensite) with their substantially differing mechanical properties. A significantly stronger yet partially artificial stress and strain partitioning response can be seen in the 2D simulation case which also is more prone to predict strain localization. This analysis shows that full-field micromechanical simulations that use real microstructure data should be conducted in 3D.
4.2 Representative Volume Element simulations of Microstructure–Property Relations of Advanced High-Strength Steels
The average mechanical response is the ensemble average of the individual microstructural constituents. Predicting the macroscopic response of AHSS therefore requires to take the microstructural complexity into account. Mean-field homogenization schemes, which accurately predict macroscopic properties and texture evolution of single-phase polycrystals, often fail in this task as they ignore by definition the local environment of the individual constituents. However, the multiple interactions between phases, grains, subgrains, and deformation models strongly depend on the local neighborhood relations. Computational homogenization based on Representative Volume Elements (RVEs) is therefore often the only suitable approach for the prediction of the mechanical properties of AHSS.[34,35,36,454,455] In this approach, the macroscopic behavior such as yield stress or hardening rate or statistical descriptors such as strain partitioning or texture evolution are directly obtained by averaging micromechanical simulations. Consequently, the computational costs associated with RVE-based modeling are often an obstacle against the routine use of this approach.
In principle it is possible to use measured microstructures, digitalize them according to specific criteria obtained for instance from EBSD maps and the associated distortion measures such as the Kernel average misorientation, and use these digital microstructure twins as RVEs.[33,264] However, instead, artificially generated microstructures are often used to study microstructure–property relations of AHSS for two reasons: First, the necessity for the determination of three-dimensional (3D) microstructures poses a very high experimental burden.[456,457] Yet, knowing the true 3D microstructure is often required to simulate a realistic stress and strain distribution.[32,453,458,459] Second, using computational tools to generate artificial 3D microstructures allows to systematically vary specific microstructural features such as, for example, microstructure banding, phase topologies, volume fractions of the different microstructure constituents, and to investigate their effects on the macroscopic properties both, individually and in concert.
A substantial number of numerical methods exists to generate suited RVE morphologies for a wide range of material classes,[460,461,462,463] although most of the more systematic applications have been devoted to the study of microstructure–property relationships of DP steels[34,36,464,465,466,467,468] In RVE studies, the most relevant feature is the martensite volume fraction.[3] In addition to the rather straightforward consideration of this descriptor in such simulations, the topological arrangement of the martensite phase can also be adjusted and thus subjected to systematic simulation studies. Figure 42 shows three examples of DP steel RVEs in which the spatial clustering of the martensite has been systematically varied. For the representation of the crystallographic texture, approaches that have been developed for single-phase materials[469] are often equally suitable for multiphase materials if they are separately used for the individual constituents. Despite the inclusion of all the various details, a comparison reveals that such microstructure models do not incorporate details such as grain shape, misorientation distribution, and in-grain orientation gradients.

Reprinted from Ref. [470] under the terms of the Creative Commons CC BY license
Three types of systematic variations of martensite banding in RVEs for DP steel generated by multi-level Voronoi Tessellation. Martensite grains are colored in black, the ferrite grains in gray. Left: Martensite being randomly distributed and clustered in bands. Center: All martensite clustered in bands. Right: All martensite randomly distributed.
A fundamental challenge of RVE modeling lies in the selection of appropriate volume elements that are truly representative of the microstructure under investigation.[471,472,473] This criterion means that the employed model structure must contain all relevant microstructural features according to a prescribed (i.e., measurable) distribution.[474,475] In this context it should be mentioned that microstructure representativeness depends on the targeted properties under consideration. This implies that a certain knowledge-based priority selection must be conducted as to which microstructure features are considered and which may be neglected for predicting a certain property within a specified fidelity range: while for the prediction of a steel’s yield stress, which does not necessarily depend on all subtle microstructural features, a comparably small RVE might suffice, the prediction of rare events such as damage nucleation typically imposes stronger requirements for representativeness and microstructure detail. While in general a priori statements, whether an RVE is representative or not, are not in all cases feasible, results from mean-field modeling of polycrystals clearly show that the correct representation of the crystallographic texture and of the phase fractions are essential prerequisites when creating RVEs.[453,476,477,478] Since the microstructural complexity of AHSS comes on top of this prerequisite suggests that rather large RVEs are usually required in this field. Having this condition of RVE modeling in mind, a critical review of studies on “RVE-based modeling of AHSS” reveals that many of these are in fact using set-ups which do not even include the crystallographic texture adequately.
4.3 Constitutive Modeling of Plasticity in Ferrite, Austenite, and Metastable Austenite
The micromechanical interaction of the different microstructure constituents and phases in AHSS is complex and can as a rule not be readily captured by phenomenological mean-field models. When exposed to mechanical and/or thermal loads, the extraordinary strengthening effects in this class of steels are due to several types of jointly acting deformation mechanisms such as for instance dislocation hardening involving in part also complex dislocation patterning phenomena and strain gradients, TRIP effects, and/or TWIP effects. AHSS which exhibit TRIP or TWIP occur for instance in alloys with Fe-Mn-C or Fe-Mn-Al-Si compositions.[479]
In order to render efforts of designing AHSS efficient and mechanism-driven, these underlying strengthening effects must be cast into physics-based model that are also composition-sensitive. The activation of these partially competing deformation mechanisms,[480] i.e., dislocation slip, TRIP, or TWIP, can be predicted based on the thermodynamic calculation of stacking fault energy (SFE) maps. The SFE is temperature- and composition-dependent[113,164,192,433] and can be calculated by Calphad-type thermodynamic approximations from first-principles calculations.[481,482]
In many austenitic AHSS systems, the γ-austenite phase is a metastable FCC phase, which can transform into ε-martensite (HCP) or α′-martensite (BCC/BCT). Two different transformation paths, γ → ε and γ → ε → α′, can occur.[483] The formation of ε-martensite is particularly favored by a low value of the SFE of the austenitic phase.[40,105,110,153,430,479,484] Alloys with SFE < 20 mJ/m2 often exhibit a two-stage transformation sequence γ → ε → α′ with ε-martensite as an intermediate phase.[484] Alloys which have a higher SFE have a tendency to favor mechanical twinning instead of athermal phase transformation.[155] For yet larger SFE values of twinning are suppressed.[485,486] The transition from the TRIP to TWIP deformation mechanism in dependence of the chemical composition can be depicted in the form of SFE maps as shown in Figure 43.[487]

A full micromechanical understanding of the connection between the alloy properties (such as the SFE) and specific plastic deformation mechanisms (dislocation slip, TRIP, TWIP) is important since each deformation mechanism may influence the mechanical properties of the material, leading to either deleterious or beneficial effects. For example, as a positive feature it was observed that suppressing the ε-martensite transformation may reduce the susceptibility of certain TRIP/TWIP steels to hydrogen embrittlement and dynamic strain aging.[176,294,488,489]
The modeling of transformation plasticity has seen a number of important constitutive developments over the past several decades. Current state-of-the-art approaches which consider the transformation of retained austenite to martensite are multiscale approaches where relevant microstructural phenomena are first modeled in detail and then upscaled to the macroscopic length scale using appropriate homogenization techniques. Crystal plasticity models are now widely implemented into finite element methods (CP-FEM) and are used to simulate deformations of polycrystals to predict texture and mechanical responses.
Various models have been proposed to describe the crystallographic aspects of martensitic transformations using micromechanics approaches within a small-strain framework.[490,491,492] However, since martensite transformations can induce locally large elastic and plastic deformations several constitutive models have also been proposed to model transformation-induced plasticity within a large-strain elasto-plasticity framework.[493,494] Turteltaub and Suiker[495,496,497] developed a martensitic transformation model within a large-strain framework for modeling the phase-transformation behavior of metastable austenite to α′-martensite. Tjahjanto et al.[498,499] combined the martensitic phase-transformation model developed by Turteltaub and Suiker with an FCC single-crystal plasticity model to capture the feature that the TRIP effect is strongly influenced by the crystallographic orientations of the austenitic and ferritic grains.
Along these lines, dislocation density-based crystal plasticity models incorporating both transformation-induced plasticity (TRIP) and twinning-induced plasticity (TWIP)[486,500] have been developed to serve within a finite element and spectral solver framework[453] or analytical boundary condition treatments.[500] The following example demonstrates the capability of this model to capture the TRIP and the TWIP effects at different temperatures. A Fe-22Mn-0.6C steel was used for validation of the model.
Uniaxial tensile tests were carried out on Fe-22Mn-0.6C samples within a temperature range of 123–773 K. High-energy synchrotron X-ray diffraction (XRD) was used to measure the ε-martensite fraction and EBSD analysis was employed to determine the twin volume fraction. The experimental conditions were replicated through representative volume element (RVE) simulations using a spectral solver to cope with the underlying mechanical boundary value problems. A grid of dimensions 16 × 16 × 16 comprising 100 generated grains using a standard Voronoi tessellation approach serves as the RVE on which periodic boundary conditions and constant strain rate loading were applied.
As shown in Figure 44, the model described in Reference 486 is able to predict the activation of martensitic phase transformation at low temperatures, the dominance of twinning at intermediate temperatures, and plastic deformation solely by pure slip at high temperatures based on the stacking fault energy of the material.

Figure reprinted with permission from Ref. [501]
Comparison between experiment and simulation for Fe-22Mn-0.6C using a dislocation density-based crystal plasticity model incorporating both TRIP and TWIP effects.[501] The true (logarithmic) stress–strain curves, hardening curves, twin volume fraction, and ε-martensite volume fraction as a function of strain are shown: (a) Experimentally obtained and simulated stress–strain curves. (b) Experimentally obtained and simulated strain hardening curves. (c) Development of the twinned volume fraction as a function of the true strain as predicted by the model. (d) Martensitic volume fraction as a function of the true train as predicted by the model.
All of the aforementioned work involves some assumptions or simplifications of the microstructure. The development of computationally fast, large-scale, physically accurate models can be used to help optimize the manufacturing process of TRIP steels. Important conditions such as chemical composition, heat treatments, or forming processes can be altered within these models to calculate the effects these factors have on the mechanical properties and the performance during in-service loading.
4.4 Crystal Plasticity Data Fitting Based on Experiments
Microstructure-based crystal plasticity (CP) models for AHSS rely on constitutive equations that describe the behavior of different phases based on their individual plastic deformation modes.[55,502] Besides, dislocation slip, these models might incorporate other plastic deformation modes, such as mechanical twinning and martensitic phase transformation.[453,501] As a result, these CP models are often very complex, and they contain a large number of constitutive parameters.[503,504]
The capability of a CP model to accurately predict the complex deformation behavior of AHSS strongly depends on the values selected for its constitutive material parameters. Therefore, an important prerequisite for exploiting the full predictive capabilities of these constitutive models and an essential precondition for the ongoing digitalization of manufacturing and service safety prediction is the identification of a suitable set of material parameters within well-based physics bounds. However, this is a challenging step for AHSS materials as the material parameter identification includes the calibration of the parameters for each phase in addition to the overall response of AHSS. This implies that using an appropriate methodology to determine the constitutive parameters of AHSS is a crucial step in simulating the deformation behavior of these materials.
One approach to obtain crystal plasticity material parameters is to conduct simulations on a respective smaller length scale in such (rare) cases where the underlying generic parameters are known. However, also in small-scale continuum simulations it is not always possible to obtain exact values for all parameters (see as an example the preceding section).
When choosing instead an experimental approach to retrieve material parameters essentially two directions can be taken: either one conducts single-crystal probing for instance via nanoindentation and/or single-crystal pillar deformation tests or one tries to get the response from polycrystals. The first approach (single-crystal scale experimentation) is computationally rather cheap and experimentally very expensive and in the second one (polycrystal experimentation) it is the opposite.
When choosing the first option, viz. the single-grain or single-crystal scale probing as an experimental approach to obtain material parameters the first step in calibrating material parameters for AHSS is to experimentally determine the stress–strain curves of individual phases and grains.[505] One approach for this procedure is nanoindentation experiments placed into individual crystals and phase portions.[33,506,507,508,509] Another approach is to extract micropillar compression specimens of individual phases like ferrite and martensite, and determine the properties of the different phases from micropillar compression experiments.[510] It should be noted that conducting such single-crystal experiments is very challenging and too labor-intense for routine use. As an example in this field, Chen et al.[510] proposed an iterative optimization procedure to determine the material parameters for a CP model from small-scale mechanical probing. To this end, they performed full 3D finite element simulations of each micropillar compression or nanoindentation experiments, and progressively adjusted the material parameters in the simulation to obtain the best fit for experimental stress–strain curves.
The second options relies on global stress–strain curves obtained on polycrystal and multiphase bulk aggregates, i.e., on bulk AHSS samples. The approach to retrieve material parameters from such global data lies in the use of an appropriate optimization methodology. In general, the identification of material parameters from averaged, global mechanical flow curves requires to solve an inverse problem, i.e., adjusting material parameters until the simulation results match the experimental ones.
Recently, Sedighiani et al.[511] proposed a computationally efficient multi-objective optimization approach to identify material parameters for complex CP models with a large number of crystal mechanical material parameters directly from flow curves obtained on bulk polycrystalline samples. The methodology uses a genetic algorithm[512] along with the response surface methodology.[513] Genetic algorithms are powerful optimization methods that usually converge to a global minimum of the objective function rather than getting stuck in a local minimum. However, for the routine use of genetic algorithms to identify the parameters of complex material laws, the computational cost of evaluating the constitutive response needs to be reduced. Therefore, they approximated the simulation response using relationships defined between the adjustable material parameters and the stress response using the response surface methodology.
This multi-objective optimization methodology uses stress–strain curves from polycrystalline steels under different loading conditions, such as loading temperature, applied strain rates, and loading directions, to identify a unique set of parameters that best predicts the experimental data for all loading conditions. One main advantage of this methodology for AHSS is, that it allows grouping of the parameters in different blocks, which makes it possible to determine the best set of material parameters for the individual phases and the overall response of AHSS at the same time in a computationally efficient way. Moreover, this approach makes it possible to quantitatively and systematically study the role of the underlying single-crystal parameters in predicting the deformation behavior of AHSS and its individual phases.
Sedighiani et al.[514] applied the approach to determine and analyze the parameters of a dislocation-density-based crystal plasticity model using the stress–strain curves experimentally obtained for IF steel. Figure 45 shows the predicted yield stress over a wide range of temperatures and strain rates. It can be seen that the simulation results obtained using the identified unique set of parameters are in good agreement with the experimental data for a wide range of temperatures and strain rates. This methodology can be extended to include other important outputs in the optimization procedure, such as volume fraction of martensitic phase transformation and twin volume fraction. The presented approach has been implemented into the Düsseldorf Advanced Material Simulation Kit (DAMASK) and is available as free and open-source software.

Yield strength versus loading temperature for different strain rates. The blue symbols show the simulation results that were obtained by a unique set of parameters determined using the approach recently introduced by Sedighiani et al.[511] The red symbols show the uniaxial compression tests data obtained for IF steel
4.5 Multiscale Forming Simulations of Advanced High-Strength Steels
During the forming process, the microstructure evolves under mechanical load. In turn, the mechanical response changes as microstructure evolves. Traditional large-scale forming simulations usually adopt macroscopic phenomenological constitutive models with an isotropic or anisotropic yield surface description, which neglect the microstructure evolution and its effect on the mechanical response. CP models overcome this by directly accounting for the kinematics and kinetics of physical deformation modes such as dislocation slip and twinning. As real polycrystalline materials consist of a huge number of grains, it is infeasible to perform direct full-field CP simulations at the industrially relevant component scale. Instead, multiscale modeling is a more promising approach for large-scale forming simulations.
In terms of how to pass the mechanical response obtained from the mesoscopic CP model to the macroscopic FE model, multiscale models can be divided into two categories, i.e., directly embedded models and hierarchical models. In a directly embedded multiscale model, the macroscopic FE model provides the boundary condition for the embedded mesoscopic CP model, and retrieves the homogenized stress response from it. Since this is done at each increment, it is a fully coupled model. As only the mesoscopic CP constitutive model is required, there is no need for a macroscopic phenomenological constitutive model. In contrast, a hierarchical multiscale model requires not only a CP model at the mesoscale but also a phenomenological constitutive model at the macroscale. The CP model is employed for tracking texture evolution and to conduct separately virtual experiments for calculating plastic anisotropy data. These stand-alone results are then used to identify and/or update parameters of an anisotropic yield surface function at the macroscopic FEM level. It is not necessary to update the yield surface at each increment, instead, the update is done only if a certain criterion is satisfied, e.g., if for instance the accumulated plastic strain exceeds 0.05 since the last update. Hierarchical schemes are computational less costly while directly embedded models are more accurate.
Within the two multiscale frameworks, various CP models, e.g., mean-field models, grain-cluster models and full-field models, are available. Mean-field models such as the Taylor-type models, the viscoplastic self-consistent model (VPSC) models, and the elasto-plastic self-consistent (EPSC) models treat the microstructure in a statistical way where each grain is considered to be homogeneous. Realistic microstructural in-grain morphologies and specific local grain interactions are disregarded. Only spatially averaged quantities can be obtained instead of the spatially resolved solutions. Grain-cluster models introduce grain interactions within a cluster consisting of a small number of grains, and approximate strain compatibility and stress equilibrium are achieved. Full-field models pursue spatially resolved solution of a RVE by means of FEM or FFT-based spectral methods.[33,443,453,478,513] Such models can reach high precision in microstructure–property simulations when using adequate CP constitutive models and realistic microstructural morphologies. Among all these CP models, full-field CP simulations work particularly well for AHSS, as demonstrated in the previous sections.
However, only a few multiscale forming simulations have been conducted for the case of AHSS.[34,35,37,474,515,516] Tjahjanto et al.[517,518] conducted uniaxial tension simulations by using the relaxed grain-cluster (RGC) model in which a dual-phase microstructure was considered. Roters et al.[454,478] further applied the RGC model to cup drawing simulations of dual-phase steel. Recently, Han et al.[37] developed a fully coupling multiscale model (referred to as FE-FFT) by embedding a full-field crystal plasticity-spectral solver in an implicit finite element solver. They conducted a macroscopic FE simulation of beam bending with each integration point using a high-resolution (64 × 64 × 64) RVE of dual-phase steel. The stress and strain partitioning among ferrite and martensite as well as their homogenized response when analyzed for the macroscale boundary conditions were captured. In spite of its huge computational cost, the FE-FFT model is particularly suitable for AHSS with complex microstructural characteristics. Schröder et al.[34,519] employed a multiscale finite element (FE2) method to simulate the radially expanding of a circular disk of DP steel with a hole. As the name suggests, a FE solver was used to solve the boundary value problem at the mesoscale. Although an explicit mesoscopic RVE of dual-phase steel was used, they adopted an isotropic phenomenological constitutive model rather than a CP constitutive model to describe the mechanical behavior of ferrite and martensite. Due to its usage of a rather simple underlying constitutive model, this FE2 model should be computationally less expensive than a CP-based FE-FFT model variant.
Though various multiscale models are ready to be used in large-scale forming simulations, the huge computational cost when considering complex microstructure is still the biggest obstacle for their applications in actual simulations of AHSS. Compared to the full coupling FE-FFT model, a recently developed hierarchical model[37] which works by conducting on-the-fly full-field CP-spectral virtual experiments to gradually evolve the yield surface at each integration point of the macroscopic FE model (Figure 46) is more promising to be applied in large-scale sheet forming simulations of AHSS, Figure 47.

Computational procedure for conducting fully embedded multiscale CP-RVE macroscale forming simulations using for example ABAQUS FEM for the macroscale simulation part and the spectral solver within the DAMASK package for the micromechanical simulation part: The flow chart for the multiscale model has been reprinted with permission from Ref. [37]

The figure has been reprinted with permission from Ref. [37]
Example of a fully integrated multiphase crystal plasticity simulation, where the open-source crystal plasticity simulation package DAMASK has been fully coupled with the commercial finite element simulation software ABAQUS, applied here to the case of beam bending of an engineering DP steel RVE: The images depict the distribution of the equivalent von Mises stress and strain values of the embedded RVEs at the two points of the beam.
Currently, damage is rarely considered in multiscale forming simulations. It is also possible to integrate damage models at both the mesoscale and macroscale, so that failure of components during forming process can be modeled starting from microstructurally small cracks or voids up to macroscopic fracture. As damage nucleation and crack growth depend substantially on microstructure, the full-field CP-based multiscale model is very suitable for AHSS.
4.6 Numerical Twins and Through-Process Modeling of Advanced High-Strength Steels
The production and microstructure fine-tuning of AHSS requires to consider the connection among the constitutive variables that characterize the material (such as texture, dislocation density, martensite fraction, and grain size) and the boundary conditions imposed during processing (such as rolling reduction, heat treatment temperature, or cooling rate).[54,520] Corresponding approaches are nowadays pursued through the development of so-called numerical twins, an approach which refers to the simulation of the material’s chemistry and microstructure as well as the mechanical, chemical, and thermal processing parameters that the steels are exposed to along the value chain.[521] One essential pillar pertaining to this challenging task lies in the development of corresponding integrated simulation approaches.[522,523,524] More specific, the assignment lies in replacing the simulation of isolated production steps that were traditionally considered as individual and (artificially) decoupled problems such as rolling and annealing, by the integrated through-process simulation of complex thermomechanical manufacturing strategies. Such efforts are particularly required for the time and resource efficient production of high-quality AHSS, owing to the strong dependence of their properties on complex microstructures.[525] Most AHSS are produced by exposing the materials to a complex sequence of thermomechanical treatments and controlled cooling and continuous annealing cycles,[1,426,525,526,527] Figure 48. Since the superior mechanical properties of AHSS are due to their complex and properly tuned microstructure, quantifying and predicting the influence of the processing conditions and their local gradients (i.e., through the sheet thickness or along the furnace length etc.) on the microstructure evolution is essential.[2,109,528] This task is crucial, since the steel industry aims for a faster and more knowledge-based development of improved AHSS grades with increasingly complex microstructures produced in fine-tuned manufacturing processes. For these reasons, through-process modeling for AHSS production presents an attractive opportunity to reduce the amount of experimental testing, number of plant trials, and material wastage and produce advanced materials with well-tailored microstructures in a quantitatively predictable manner.

Different material models to be combined together into a through-process model shown here for a generalized schematic processing route of AHSS. Different types of AHSS follow different processing routes, but the components of a processing route are in principle made up of these different steps in various combinations. Therefore, a through-process model should be based on an integrated platform, where the individual material models can be combined together as desired
During the thermomechanical treatments of AHSS, different metallurgical processes such as recovery, recrystallization, work hardening, precipitation, and phase transformations can occur simultaneously or with some degree of overlap and hence interact with each other. Due to the need for a fast simulation method allowing even online control and adjustment of large-scale process variables on-the-fly, empirical and phenomenological through-process models have been mostly used in this field.[54,56,529,530] These models typically describe certain averaged material features during the course of production like the average mechanical strength and a few simplified microstructure properties (for the latter, mostly only the average grain size is considered) for different processing routes for a given alloy, usually only reliably fitted to work within certain bounds.
Advanced through-process models which include more detailed microstructure-based constitutive formulations are usually implemented into explicit FEM solvers.[474,504,516,531,532,533,534] These approaches involve discretization of the often large sample volumes into small finite elements and the constitutive equations are defined at each of these elements. Then, like in any conventional FEM simulation, these equations of all elements are assembled together and solved globally using variational methods to approximate the desired quantities over the given volume. Some approaches combine such FEM-based models to include temperature and mechanical fields.[54,529,535] The temperature and mechanical field conditions are further used by material models, which solve simple kinetic evolution equations at each FEM node such as required for describing grain growth or the progression of phase transformation. A direct approach is defined as a method where the evolution of properties at a particular point in the microstructure is independent from the material neighborhood of the point and also from the overall distribution of properties in the material. Most of the microstructure models described above are based on such direct approaches, where the differences between neighboring regions and the distribution of properties inside the AHSS sheet do not affect the local microstructure evolution in an element.
Such approaches can work in certain cases for problems like homogeneous grain growth, static recovery, or precipitation in an isotropic host matrix. However, for more complicated phenomena that depend on microstructure inhomogeneity and that require coupling among neighboring material volume entities, such as recrystallization[382,536] or damage evolution,[537,538,539] the extreme and rare values of the distributions of certain microstructure properties become the determining factors (such as nucleation events or damage initiation). In such cases, spatially resolved simulations play an important role in understanding and tuning the manufacturing processes described. Highly resolved simulations, coupling plastic deformation, phase transformations, and recrystallization[478,521,536,540,541,542] or deformation and phase transformations[491] can be used to understand how the distribution of microstructure properties affects the progress of transformation. This information can then be used to develop better mean-field models, which predict the distribution of the microstructure properties along with the average values.
The currently employed through-process models are mostly empirical/phenomenological and, thus, have a large number of parameters with no physical basis. In such cases, inverse analysis of models to fit the experimental data is needed for parameter determination. To have these models work for a large range of conditions, a large database of these material parameters is essential. Thus, for each new steel alloy, lots of parameter fitting to experiments would be needed.
As more advanced steels with new microstructural mechanisms and complex internal interactions are gradually developed, the corresponding models likewise need to include more advanced constitutive descriptions of these mechanisms, such as twinning and strain-induced phase transformations, and they must be capable of dealing with regions of high mechanical contrast. Additionally, due to the empirical nature of most of the current through-process models, they are not applicable to a wide range of alloys and conditions outside of the fitted regimes. The use of physics-based constitutive laws, with parameter values derived from experiments or physics-based simulations at smaller length scales, can help in developing mean-field models, applicable to a wider range of alloys and processing routes.
Even though physics-based constitutive laws offer advantages like better understanding of the bounds,[514] their high computational demands render them prohibitive when modeling whole process chains. A promising alternative to this physics-centered view on predicting the microstructure properties resulting from a process chain is taking a data-centered view. This approach is especially beneficial as modern production facilities are equipped with a variety of sensors that measure physical quantities like temperature and strain rates together with technological quantities such as rolling speed and rolling forces.
Two approaches exist for the systematic incorporation of data acquired during the actual production: Adjusting existing models via data assimilation, an approach that is usually followed in weather forecasting[543] or using Machine Learning and Artificial Intelligence algorithms.[57,544,545] The advantage of the data assimilation approach is that it can be successively integrated into existing modeling approaches. The advantage of the machine learning approach that is the abandonment of a model, which allows to take the entire data.
However, Machine Learning-based prediction methods are essentially extrapolated based on the learning gained from existing data. Thus, for a completely new grade with novel microstructural features and deformation mechanisms, predictions may not be correct.
For these cases, an initial understanding about these ‘new’ mechanisms is required, which can be gained from highly resolved simulations. These simulations can be calibrated from the existing plant data and then, further used to generate datasets for newer alloys with multiple different conditions and novel microstructures. These new datasets can be used as new training datasets for machine learning algorithms for the new group of alloys. Here, a virtual laboratory combined with predictive capabilities of machine learning and artificial intelligence, can lead to much faster development of newer steel grades with unique processing routes, without extravagant number of plant trials.
As a long-term outlook for through-process modeling for AHSS, understanding, modeling, and predicting the increasing complexity of AHSS, requires a multiscale simulation approach which considers Integrated Computational Materials Engineering models (ICME). These ICME models aim to incorporate all relevant physics-based mechanisms and parameters, with physical meanings, derived from simulations at smaller length scales or dedicated experiments. Furthermore, the huge amount of processing and property data typically acquired in steel plants can be in future better exploited with the help of Machine Learning algorithms to make predictions for new processing routes and better combination of features in microstructures from existing knowledge. When also considering and studying outliers from these high-dimensional trend analyses, even entirely new alloys and mechanisms can be discovered with the aid of such methods.
5 Recent Disruptive Developments Related to Advanced Steels
5.1 Additive Manufacturing of Advanced Steels
Additive manufacturing is a potentially disruptive technology that could revolutionize manufacturing. Especially laser additive manufacturing (LAM) is of great interest as it allows to produce complex, metallic parts from a computer-aided design model and metallic powder.[546] The main advantages of additive manufacturing over conventional manufacturing processes can be found in their great geometric design freedom and process flexibility enabling, e.g., production of complex geometries or customized parts with a short lead time. These advantages enable, e.g., to produce patient-specific medical implants, complex tools with optimized cooling channels imprinted, structurally optimized parts with significant weight savings, or the repair of expensive turbomachinery parts.
The applications for which steels are processed by additive manufacturing (AM) usually require alloys that show a high corrosion resistance, a high hardness/wear resistance, or a combination thereof. Consequently, most steels in use in AM are stainless steels or tool steels. Among such steels, the grades that have received the most attention so far are austenitic stainless steels, precipitation-hardening stainless steels (PH steels), and tool steels, in particular maraging steels.
While also AM technologies such as electron-beam powder bed fusion or binder jetting are capable of processing steels, by far the most work has been done on directed energy deposition (DED) and laser powder bed fusion (LPBF). Both techniques produce parts in a layer by layer manner melting powder particles with a focused laser beam. In LPBF, the process of laying out thin layers of powder and selectively melting them is repeated many times. In DED the powder is injected locally into a laser-generated melt pool through a moving feeding nozzle (coaxial with the beam) by means of an inert carrier gas.[546,547] While LPBF offers a higher degree of geometrical freedom and enables finer structures, DED allows for a higher deposition rate and for larger built structures. Inside the melt pool, the powder is completely melted. The resulting, dense parts can present similar or even better mechanical properties than the conventionally produced bulk metal.[548] In particular the strength is often superior to conventionally produced steels, while the ductility sometimes lags behind, and the fatigue resistance is usually lower.
During additive manufacturing the steels are subjected to very different thermal conditions compared to conventional processing routes, leading to very different microstructures. Specifically, the thermal history during LAM consists of rapid quenching from the fully liquid state in the melt pool followed by a cyclic re-heating when the laser beam melts neighboring tracks and subsequent layers. This cyclic re-heating consists of short temperature spikes with decreasing intensity and is referred to as intrinsic heat treatment (IHT).[549,550,551] Additionally, the substrate onto which material is deposited may be heated, allowing to change the base temperature of the temperature spikes. The high cooling rates typically lead to a fine (sub-µm diameter) cellular/dendritic solidification structure with pronounced micro-segregation, which can stabilize non-equilibrium phases such as retained austenite in the interdendritic regions. The texture is usually a {001}-fiber texture parallel to the building direction or a cube texture, depending on the scanning strategy. The IHT can lead to phase transformations such as precipitation already during the printing process. On the one hand, this may necessitate additional or adapted post-process heat treatments. On the other hand, it also opens new opportunities to design alloys tailor made for LAM processes, as detailed below.
To date conventional alloys are used almost exclusively in LAM that have been developed for conventional process routes such as casting or forging. Using these non-optimized alloys in a way that was initially not intended fails to exploit the unique features that LAM processes offer and can lead to severe problems regarding poor processability. One example is the use of C-bearing tool steels in LAM such as grade H13 (1.2344, X40CrMoV5-1). Due to the brittle nature of the fully martensitic microstructure generated by the high cooling rates in AM processes, severe cracking in the as-produced material is often observed. Process modifications (pre-heating the base plate to temperatures above the martensite start temperature and slow cooling after the end of the AM process) are partially able to remedy this problem. Maraging steels, on the other hand, are well processable in AM. This is a result of the soft and ductile martensitic microstructure that is formed upon quenching from the melt pool. Maraging steels gain their strength by precipitation of intermetallic-phase particles upon aging.
There are only few studies in the literature where the unique features of AM, in particular the thermal profile, are exploited for improved microstructure design of novel steel grades. Here, two examples of such alloy design approaches are presented.
Kürnsteiner et al. show that the IHT during DED processing is strong enough to induce in situ precipitation hardening.[549] For this purpose, they designed a ternary Fe-Ni-Al maraging steel model alloy that shows the desired in-process phase transformation without any post-process aging.[552] DED processing enables a rapid alloy prototyping approach by changing the alloy composition during the manufacturing process. This way compositionally graded samples were produced to efficiently screen different alloy compositions and to identify promising concentration intervals for further study, Figure 49. An Al content of approximately 5 wt pct lead to a martensitic microstructure with an extremely high number density of ~ 1025 m−3 fully coherent, nm-sized NiAl precipitates, Figure 49(d). A tensile strength of 1600 MPa at 3 pct elongation was achieved in the as-DED produced state. In contrast, a conventional 18Ni-300 (1.2709) maraging steel that is not optimized for LAM only shows very early stages of precipitation in the as-DED produced state without strong hardening.[553]

Reprinted with permission from Ref. [549]
(a) through (c) Compositionally graded sample ranging from 0 to 25 at pct Al allowing efficient screening of a large composition range. Here, only below an Al content of 15 at pct the martensitic microstructure can be obtained that is desired for Maraging steels. (d) Atom probe tomography measurements showing the high number density of NiAl nano-precipitates that can be obtained by the intrinsic heat treatment during DED processing. Precipitates are highlighted by an iso-concentration surface that marks areas with Al concentrations higher than 15 at pct.
Another approach making use of the AM-typical thermal profile, in this particular case the high cooling rates, is the processing of high-Mn steels. Haase et al. showed that in the as-LPBF produced state, Mn segregation was much less pronounced compared to ingot and strip-cast reference material of the same composition.[48] The microstructure of the investigated X30Mn22 steel consisted mainly of austenite, together with some α′- and ε-martensite. They showed that both TRIP and TWIP effects were activated upon tensile deformation of the material and that the strength of the samples was superior, but that the ductility was reduced compared to the conventional reference material. In a similar study, Kies et al. modified a X30Mn23 high-Mn steel for LAM by adding Al, combining theoretical and experimental alloy screening by thermodynamic simulations and DED (see Figure 50).[554] The Al content increases the stacking fault energy, which leads to a transition from TRIP to TWIP deformation mechanism. Material with 1 wt pct Al addition showed a pure TWIP deformation behavior and the highest energy absorption during compression testing of lattice structures.

Reprinted with permission from Ref. [554]
Schematic of the approach used by Kies et al.[554] to design a high-Mn steel for LAM: computational screening based on the deformation mechanism followed by experimental examination using a rapid alloy prototyping to identify the most promising alloy compositions for potential applications.
Additional to the thermal profile being unlike in conventional processing, which enables alloys exploiting rapid solidification and the intrinsic heat treatment, AM often uses powder as feedstock material. This allows taking processing steps from conventional powder metallurgy (i.e., press and sinter processing) and applying them to a process involving full melting. One example is the mixing of different powders before AM processing. This has been used in the studies cited above as a tool for alloy development, but it also enables the processing of MMCs by AM, and, in the future, will also enable parts being produced with locally varying chemistry.
Even without locally varying chemistry, AM allows to locally influence and tune the microstructure.[552,553,555] This can be done by using the digital process control to influence the solid–liquid phase transformation (texture variation, columnar-to-equiaxed transition depending on scanning strategy and energy input) and solid–solid phase transformations (martensitic and precipitation transformations during the IHT). Although these concepts are currently not yet fully developed, they open a pathway to use AM as a material synthesis method in addition to a material shaping method.
In summary it can be said that many steel grades can be processed in LAM to almost full density with a relatively small fractions of process-related defects such as pores or cracks. However, these defects often govern mechanical properties and especially fatigue life. The approach to design new alloys that are tailor made for these novel LAM processes holds great potential to minimize these defects resulting from insufficient processability of the alloys while at the same time improving mechanical properties in the as-produced state by making use of the unique thermal history of LAM-produced material. Microstructures obtained by LAM of steels are dominated by the rapid solidification of the small melt pools and solid-state phase transformations occurring already during the LAM process. The resulting microstructural features are typically much finer than those in the conventionally produced counterparts which results in higher hardness as well as tensile strength of LAM-produced steels.
5.2 High Elastic Modulus Steels: Advanced High-Strength Steels with Increased Specific Young’s Modulus
Improved understanding of the mechanisms of phase formation, transformation, and deformation allows overcoming the inherent conflict between strength and ductility of metallic structural materials. This continues to lead to substantial improvements in the property profiles of steels, where increased strength without the often associated embrittlement allows reducing the material’s weight as one of the major challenges for steel applications. However, two other key material properties are likewise important features for improved lightweight design: The most obvious challenge, lowering the mass density (ρ) of steels, has been addressed by the addition of light alloying elements such as Si and especially Al. The other key factor, elastic modulus, expressed for polycrystals by the texture-weighted Young’s modulus E though, is often overlooked or taken for granted, despite the fact that an increased elastic modulus enables a substantial technological shift towards new lightweight design solutions.
Interestingly, the specific elastic modulus (E/ρ ratio) is with about 26 MPa m3 kg−1 quite similar for many common metals such as Fe, Ni, Al, and Mg, and even the mass density reduction achievable in lightweight steels is accompanied by a proportional drop in the elastic modulus.[155,557] Increasing E without raising ρ (or at least retaining it) by alloying additions (Figure 51) or altering the material’s lattice defect structure is not effective and often counterproductive.[558] This leads to the approach of implementation of stiff and light ceramic-like particle phases into strong and ductile AHSS as the only viable alloy design strategy. Such composite steels are most commonly referred to as high modulus steels (HMS), and typically contain about 10–30 vol pct much less particles than typical metal-matrix composites such as hard metal optimized primarily for wear resistance.
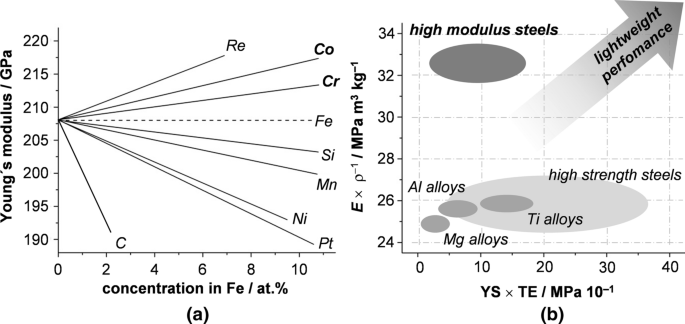
Reprinted from Ref. [556] under the terms of the Creative Commons CC BY license
Trends in the development of AHSS with enhanced elastic modulus. (a) The effect of alloying elements on the Young’s modulus of steels is small and in many cases even detrimental. (b) High modulus steels containing 10–30 vol pct of elastically stiff and lightweight particles allow to achieve novel property combinations which are not achievable by established metallic structural materials.
The main challenge in the development of HMS is to identify and develop suitable synthesis and downstream production strategies. The most obvious synthesis route, namely, via ex situ production, mixing, and compaction of metallic and particle powders may offer the greatest freedom of design, but the associated efforts render it economically unfeasible to ensure widespread adoption outside specific technological niches. This development has to be performed in concert with the alloy design, in order to overcome the inherent conflict between physical (elastic stiffness, density) and mechanical (strength, ductility) properties, adding another dimensionality to the complexity of AHSS development. In order to enable HMS to become a part of the next generation of AHSS, they should exhibit a specific modulus increased by at least 20 pct, can be cost effectively produced in sufficient volumes, and offer the possibility to change their mechanical properties over a wide range—from hard and strong to ductile and tough—by established heat treatments (Figure 51).
5.2.1 State of the art on steels with enhanced specific Young’s modulus
From the plethora of possible phases, borides have been identified as the most suitable components raising the Young’s modulus, as they are typically thermodynamically stable in Fe and are very effective, i.e., exhibiting a high E/ρ ratio. Furthermore, their ρ values are often not differing too strongly from the steel matrix to cause problems during production, as for example in the case of most oxides, which readily float during casting and form a slag rather than remaining dispersed. For the steel matrix, ferrite is most advantageous, as it exhibits the highest E values of all the different polymorphs of Fe, is reasonably ductile, and can be effectively and gradually strengthened for example by precipitation reactions.
Most published studies on HMS design are based on Fe-TiB2 steels. Tanaka et al. are among the key authors who first introduced the concept and provided the first thermodynamic descriptions, but still relied on material produced by ex situ powder metallurgy.[559] However, the very effective TiB2 (E about 515 GPa, ρ about 4.5 g cm−3) can be also precipitated in situ from liquid Fe-Ti-B melts during solidification in a pseudo-binary eutectic reaction (Figure 52).[560] That is not only beneficial to achieve a strong interfacial bonding with the steel matrix, but also greatly reduces the production costs of such HMS, which has sparked beginning industrial interest more than a decade ago. As TiB2 is a thermodynamically stable solidification product, though, its particle size, morphology, and dispersion can be altered only to a little extent by subsequent thermomechanical processing. Because these are critical important factors for the resultant mechanical properties, the solidification processes therefore have to be more intensely controlled than during the production of conventional AHSS. Especially when the eutectic concentration is exceeded, primary TiB2 particles readily float and agglomerate in an uncontrolled manner when conventional casting is employed. As they are also large (several µm in diameter) and of unfavorable morphology (Figure 52), they drastically reduce the ductility without any substantial improvement in strength. Consequently, Fe-TiB2 steels produced by conventional metallurgical techniques are limited to hypoeutectic concentrations of maximum 12 vol pct TiB2, which translates into a property profile of about 250 MPa yield strength and 25 pct tensile ductility at a specific modulus of about 32 MPa m3 kg−1.[561] While this is a significant step towards opening new dimensions in lightweight design, it is only the baseline for the highly dynamic development of HMS as next-generation AHSS.

Reprinted from Ref. [556] under the terms of the Creative Commons CC BY license
(a) Pseudo-binary Fe-TiB2 phase diagram calculated using the software ThermoCalc, showing the eutectic concentration of about 12 vol pct TiB2 as the limiting factor in the production of high elastic modulus steels. The development of suitable databases for such systems is among the most important pending challenges in that context. (b) Bulk nanostructuring of Fe-TiB2 can be achieved by additive manufacturing techniques, exploiting the achievable high solidification rates and overcoming the inherent conflict between physical and mechanical properties.
5.2.2 Recent progress in the design of steels with high-specific Young’s modulus
One pathway to overcome the current limitations of the HMS concept is to integrate the alloy design into the ongoing development of synthesis methodology. The metallurgical characteristics of the Fe-TiB2 steels require a technology which allows for rapid solidification (> ~ 104 K s−1) of small melt volumes to avoid large and agglomerated particles, without being limited in the specimen volume. This ideally matches the process characteristics of additive manufacturing (AM) techniques, which have already received significant attention, but require designated alloy concepts to reach their full potential. The combination of these two disruptive developments is therefore a significant step towards a breakthrough in lightweight design. As recently demonstrated, Fe-Ti-B-based HMS fabricated by sprayforming[556] and Laser powder bed fusion contains evenly dispersed TiB2 particles of extremely small size (about 50–200 nm after an annealing treatment to transform any metastable compounds) in a submicron-sized ferritic matrix (Figure 52). This bulk nanostructuring enables to overcome the inherent conflict between mechanical and physical properties. While the E/ρ ratio is retained at more than 31 MPa m3 kg−1, the strength is more than doubled to the level of AHSS such as DP800 without sacrificing ductility. Ongoing concerted development of both alloy and process—which can involve other techniques or even conventional powder metallurgy, as long as rapid solidification is involved—is expected to lead to even further improvements of this extremely attractive property profile.
AM HMS are ideal for designated lightweight structures in high-performance applications. It is just as desirable though for this novel dimension of properties to be available in the more common fields of steel applications, for example in the construction sector as bridge beams or pylons for wind turbines. AM, however, is too slow and costly to ensure the required massive volumes to be produced. Therefore, HMS concepts are required which are more suitable to the established high-volume steel production and processing routes such as strip or block casting. This has been achieved by combinatorial search methods (Figure 53), which identified the Fe-Cr-B system as an ideal base for cost effective and flexible HMS.[45] Based on the formation of (Fe,Cr)2B particles, these are not only cheaper alloys, but their higher eutectic concentration allows for higher particle fractions without primary particle formation. This reduces the need for accelerated solidification kinetics, and the faster spheroidization of (Fe,Cr)2B eutectic lamellae opposed to TiB2 results in a favorable morphology more compliant to hot rolling and forming processes. Most importantly though, the decreased affinity of Cr to C means that it can be kept in solid solution at elevated temperature within austenite, which opens up the possibility to achieve the huge variety of mechanical properties by various heat treatments (Figure 53) as utilized in other AHSS.[562]

Development of high modulus steels suitable for high volume production with established equipment. (a) Combinatorial investigations revealed the Fe-Cr-B system to be competitive to Fe-Ti-B while circumventing several of its drawbacks. (b) Carbon can be added and utilized to achieve a wide range of mechanical properties by straightforward heat treatments.
5.2.3 Pending challenges in steels with high-specific Young’s modulus
Together, the nanostructured AM HMS based on the Fe-TiB2 system as well as the Fe-Cr-B-C steels tailored for volume production have an immense potential for a true breakthrough in lightweight design, and showcase the ongoing innovation potential of AHSS. However, these composite steels are fundamentally new concepts compared to other steel grades, which are at their current performance level thanks to decades if not centuries of development.
Substantial more research is therefore necessary to improve the understanding of the underlying nano- and microstructural phenomena of phase formation and deformation. Only then strategies can be further developed to optimize the balance between the mutually exclusive properties Young’s modulus, density, strength, and ductility, and the technological limits of HMS can be explored and exploited. This has to be done in concert with the material production, i.e., powder fabrication and conventional casting. Scaling up from the laboratory to industrial relevant dimensions of several tons is a considerable challenge for these novel alloys. Further important, especially to optimize thermomechanical processing parameters (i.e., forging, hot rolling, heat treatments) is an improved understanding of the thermodynamics of HMS alloy systems, whose high B concentration typically exceeds the validity of most available databases.[46] At the same time, more experience and development is required for application relevant engineering parameters such as surface hardening, welding, coating, corrosion, fatigue, and interaction with hydrogen to name but a few. The necessity to perform all those steps integrally and strongly oriented towards costs renders HMS development a challenging but very dynamic field research of AHSS design. Parallel to this maturation towards engineering application, HMS remain to exhibit innovative potential at the fundamental scientific level, as the ever increasing power of computational design of particle phases combined with highly efficient property-driven combinatorial research might lead to completely new HMS concepts.
5.3 Machine Learning-Assisted Alloy, Microstructure, and Property Design for Advanced Steels
In the quest for designing high-performance alloys, a key step is to understand the correlations between synthesis, processing, and microstructure and their influence on the resulting mechanical and functional properties of the steels. This knowledge can in turn be helpful in dealing with the more interesting problem of developing inverse models for alloy discovery and microstructure design, which are the ultimate goals. However, due to the complex nature of process–structure–property correlations and the multiple types of microstructure features, specifically in AHSS, it is quite challenging to explore the vast chemical, microstructure, and processing space with the aim to identify the property optima. With the availability of high-throughput data from both experiments and simulation methods in multiple stages of alloy design,[10,563,564,565] statistical analysis tools like machine learning can assist in identifying the hidden correlations in the data. In this section, some of the opportunities and challenges of using data-driven machine learning techniques in microstructure-based alloy design and discovery are introduced, placing attention particularly on their suitability for the field of AHSS.[566,567,568]
Machine learning is a branch of artificial intelligence where computer programs are trained to improve their performance through experience. In the fourth paradigm of data-driven scientific discovery, machine learning has emerged as a useful statistical analysis tool in material science. It should be upfront realized though that compared to many other fields for which machine learning methods were originally developed, the field of steel research is characterized by relatively sparse rather than big datasets that are available as a basis for data-driven analysis. This requires to be taken into account when developing machine learning methods for the development of AHSS and adequate algorithms have to be identified that are capable of dealing with relatively lean datasets. Additionally, high-throughput screening methods must be employed to gather denser data arrays.[485,569,570,571,572]
Generally, a typical workflow in a machine learning application involves (1) collecting clean and reliable data, (2) performing feature engineering to extract the relevant attributes that represent the data numerically, (3) applying a prediction model that maps the features with the property of interest, and (4) fine-tuning the model parameters to achieve better performance on previously unseen data.
Forward modeling of alloy design can be framed as a supervised learning problem in machine learning, where the task is to predict the mechanical or functional property of an alloy for given chemical and processing conditions called features/attributes. For instance, Agarwal et al.[544,573,574] have used machine learning as a predictive model to identify the influence of composition and processing parameters on the fatigue properties of steels. Using data from MatNavi database (National Institute for Materials Science, Japan) they have extracted 25 different attributes of each grade of steel such as chemical composition, processing details, and heat treatment conditions. These features were used to train machine learning algorithms to predict the cyclic fatigue strength as the target property. With this approach they have successfully achieved the prediction accuracy of over 0.97 (R2 value). However, in their research the microstructure information has not been taken into consideration. Microstructure of a material plays a key role in macroscopic properties of alloys and adding such information will further improve prediction capabilities.
Material characterization is one of the fundamental tasks in understanding the material microstructure at multiple length scales. Electron microscopy techniques are widely used to extract information about phase distribution, morphology, crystallography, etc. of the microstructure as image data. Deep learning-based Convolutional Neural Networks (CNN) are specialized machine learning networks which can be used to extract features of hierarchical structures from such microstructure images. CNNs are used extensively in computer vision tasks such as object identification and pattern recognition to learn the features in the images in terms of hierarchy of concepts. Azimi et al.[545] performed pixel-wise segmentation of the different constituents such as ferrite, cementite, pearlite, austenite, martensite, and bainite in low-carbon steels using fully convolutional neural networks. They showed that the CNN network identified the microstructural patterns of different constituents with a classification accuracy of 93.94 pct. Similar work was published by Adachi et al.[575] Such statistical analyses are most promising in identifying the microstructure features which can provide valuable information in predicting structure property relationship. One other exciting application of CNN is the automatic recognition and quantification of the damage types in microstructure images. Kusche et al.[57] have used CNN to automatically identify and track the individual damage locations during the evolution in in situ experiments of dual-phase steels. By training two different neural networks they were able to classify and quantify both inclusions and dominant damage mechanisms from high-resolution scanning electron microscopy panoramic images, Figure 54. This information is significant in designing damage-tolerant microstructures and substantially reducing the time required for the human operator to manually identify the damage locations.

Reprinted from Ref. 57 under the terms of the Creative Commons CC BY license
Classification and quantification of damage mechanisms in DP 800 dual-phase steel microstructure images using deep learning[57]: Imaging (1st row): Void detection and clustering of potential damage sites in a high-resolution scanning electron microscope image of a deformed sample. Classification (2nd row): Two separate networks used to classify the detected voids. “Deep neural network I” classifies the void into inclusion or ductile damage. In the next step “Deep neural network II” classifies the ductile damage into martensite cracking, phase boundary decohesion, grain boundary decohesion, or notch. Quantification (3rd row): Quantification of inclusions and deformation-induced damage mechanisms for statistical analysis.
The machine learning models developed to tackle the forward design of establishing process–structure–property relationships can assist in exploring the complex design space of materials. The inverse problem of discovering a new alloy of required mechanical or functional property is essentially a constrained optimization problem where the task is to optimize the search path and systematically reach global optimum in the vast chemical and processing search space. The application of machine learning is relatively new in the process of inverse design of materials. One example in the recent applications in this area is a machine learning design system (MLDS) developed to search for copper alloys of high ultimate tensile strength (UTS) and electrical conductivity (EC) as target properties.[576] The results in this research have revealed the successful implementation of MLDS method in assisting inverse design of 8 new high-performance copper alloys with target UTS of 600 to 950 MPa and EC over 50 pct of International Annealed Copper Standards. A second example in this area, Wen et al.[577] have developed a property oriented optimization strategy to search for large hardness as a desired property in Al-Co-Cr-Cu-Fe-Ni high entropy alloys (HEA).[578] In this research they first trained a machine learning model to predict hardness of HEA using chemical composition and chemistry of elements as descriptors of the alloy from experimental data. In the next stage, based on the uncertainties in hardness predictions of the trained ML they employed utility functions to select the new experimental candidates. By continuously improving the model performance from the experimental feedback they were able to predict and synthesize HEA with hardness 10 pct higher than the best value in the data used for training. These applications reveal the effective usage of uncertainties of the machine learning predictions to manipulate and utilize for exploring and exploiting the huge design space and thus accelerating alloy discovery.
The future of machine learning in alloy and property design, particularly for AHSS design, is both, exciting and challenging. The phrase “garbage in, garbage out” reminds us of the requirement of human expertise in material science to build smarter machine learning algorithms. Knowledge about the essential role of microstructures and processes in the field of AHSS as well as about the frequently encountered relatively lean databases are essential to collect, process, visualize, and understand such data prior to feeding them to a machine learning algorithm.
Several factors pose challenges and need to be addressed for efficient use of machine learning to design and discover high-performance and sustainable steels: First, the availability of clean and reliable data. The data collected from multiple sources during the alloy design cycle are often heterogeneous in nature which makes it difficult for data mining. Hence there is an urgent requirement of integrated platforms and material databases to extract reliable data and metadata from simulations and experiments. Second, to find better descriptors for representing the material at various length and time scales. The performance of most of the machine learning algorithms depends on the choice of the numerical representation of the input data. To address this challenge, expert knowledge from material science can be utilized to describe the material fingerprints that span across multiple length and time scales that control the bulk properties of the material. Third is the aspect of model interpretability. It is crucial in materials science to understand and interpret models to make sure that one can rely on machine learning-aided predictions. There is a need to develop materials science-specific machine learning models by including physics dictated constraints into property predictions. Systematically approaching such challenges can undoubtedly make an impact in developing machine learning algorithms to develop and discover novel materials for engineering applications.
6 Conclusions, Challenges, and Opportunities
This viewpoint paper discussed some of the fundamental relationships between the microstructure and the properties of AHSS.
We conclude that many of the important and beneficial mechanical features of AHSS are associated with the hierarchical dislocation substructure, the (meta-)stability of the austenite phase, the deformation-driven transformation rates, and the dispersion of the different microstructure constituents. These features essentially determine the nucleation and the development in the mean free path of the dislocations over the course of a loading scenario and their mutual reaction products, all contributing to strength and strain hardening. In that context the mean free dislocation path gets increasingly confined by the rapidly increasing density of internal interfaces such as provided by mechanical twins or the interfaces that are associated with deformation-induced transformation products.
Another important feature common to many AHSS is that their metallurgical purity is nowadays often so good that damage occurs primarily due to their intrinsic microstructural features (including the strengthening mechanisms named above), particularly inside of the hard phases (e.g., martensite), at the hetero-interfaces and at the former austenite grain boundaries, and not due to non-metallic metallurgical inclusions or voids stemming from production. This means that microstructure design for such steels should take the avoidance of microstructurally supported damage-initiation sites and mitigation of interface regions with very high mechanical contrast as criteria into account. Another design aspect is—in AHSS with a TRIP effect—to tune the transformation tendency and size distribution of the metastable austenite in such a way that it does not transform abruptly in a small deformation increment but gradually, thereby lending the material with a steady local strain hardening reserve, bolstering local damaging.
Such build-in damage tolerance requires a detailed understanding of the micromechanics. This holds true especially for AHSS where effects like brittle fracture in martensite, ductile fracture in ferrite, and interface delamination among the constituents are prevalent.
As experimental investigations of damage are often limited to post-mortem studies, future efforts in this field should be directed at more microstructure-based simulations for AHSS which enable to fully resolve and analyze the damage evolution mechanisms. Due to the associated numerical challenges, many of the current damage simulations are based on damage indicators only, i.e., the actual abrupt stress and strain changes associated with real damage events are not taken into account. In other words, a real crack, i.e., open volume, amplifies the local stress much more than suggested by a damage indicator. While the use of damage indicators allows to identify trends, which types of microstructures and microstructure hierarchies are principally more or less damage prone than others, the strong coupling of damage-induced softening and plasticity needs to be taken into account in order to determine which damage events are truly detrimental to the integrity of a workpiece and which can be arrested by confined microstructure compliance or local strain hardening. In cases where damage in AHSS has been explicitly modeled, usually only one mechanism has been taken into account, but most AHSS microstructures are characterized by an interplay of several possible deformation and damaging phenomena. Predictive damage modeling and its dependence on environmental chemical effects (corrosion) based on the microstructure are thus essential future topics in the field of AHSS micromechanics.
Modeling damage and fracture does not only require the further improvement of numerical methods but when it comes to realistic loading scenarios, the precise determination of material parameters becomes also decisive. This holds true especially for the complex microstructures of AHSS: If brittle fracture, ductile damage, interface decohesion, and plasticity compete, qualitative descriptions are not sufficient. Only quantitative descriptions enable to correctly predict which mechanism dominates the deformation and damage behavior.
This is linked to another important feature that seems to be common to most if not all of these advanced steels, namely, their susceptibility to hydrogen embrittlement. Beyond the individual embrittling mechanisms such as hydrogen-enhanced plasticity, local hydrogen-driven interface decohesion, or void formation due to the occurrence of hydrogen-stabilized superabundant vacancies and their condensation it is primarily the fact most of these steels contain local microstructure spots which are characterized by very high gradients in the local mechanical stress. These can occur across the hetero-interfaces among dissimilar constituents or in regions of very high dislocation density, thus creating high micromechanical contrast. In either case these are the most neuralgic regions in these complex microstructures where the hydrogen typically accumulates, triggering hydrogen-embrittling mechanisms. Consequently, suited countermeasures to render these steels more resistant to hydrogen embrittlement should thus include strategies to bolster and mitigate steep stress peaks in the microstructures and also pursue the design of denser oxide surface layers with lower hydrogen diffusion and take-up rates.
References
D. K. Matlock and J.G. Speer: Microstructure and Texture in Steels, Springer, London, 2009, pp. 185–205.
D.K. Matlock, J.G. Speer, E. De Moor, and P.J. Gibbs: in Int. Iron Steel Symp., 2012, p. 12.
[3]C.C. Tasan, M. Diehl, D. Yan, M. Bechtold, F. Roters, L. Schemmann, C. Zheng, N. Peranio, D. Ponge, M. Koyama, K. Tsuzaki, and D. Raabe: Annu. Rev. Mater. Res., 2015, vol. 45, pp. 391–431.
[4]R. Song, D. Ponge, D. Raabe, J. G. Speer, and D. K. Matlock: Mater. Sci. Eng. A, 2006, vol. 441, pp. 1–17.
[5]Georg Frommeyer, Udo Brüx, and Peter Neumann: ISIJ Int., 2008, vol. 43, pp. 438–46.
T.B. Hilditch, T. de Souza, and P.D. Hodgson: Weld. Join. Adv. High Strength Steels, 2015, pp. 9–28.
[7]T. Senuma: ISIJ Int., 2001, vol. 41, pp. 520–32.
H.K.D.H. Bhadeshia: Proc. R. Soc. A Math. Phys. Eng. Sci., 2010, vol. 466, pp. 3–18.
[9]Eric A. Jägle, Zhendong Sheng, Liang Wu, Lin Lu, Jeroen Risse, Andreas Weisheit, and Dierk Raabe: JOM, 2016, vol. 68, pp. 943–49.
[10]Helene Knoll, Sörn Ocylok, Andreas Weisheit, Hauke Springer, Eric Jägle, and Dierk Raabe: Steel Res. Int., 2017, vol. 88, pp. 1–11.
P. Bajaj, A. Hariharan, A. Kini, P. Kürnsteiner, D. Raabe, and E.A. Jägle: Mater. Sci. Eng. A, 2019, vol. 772, p. 138633.
[12]H. Zhang, K. G. Pradeep, S. Mandal, D. Ponge, and D. Raabe: Acta Mater., 2014, vol. 80, pp. 296–308.
[13]Kazuhiro Hono, Dierk Raabe, Simon P. Ringer, and David N. Seidman: MRS Bull., 2016, vol. 41, pp. 23–29.
[14]J T Benzing, J Bentley, J R McBride, D Ponge, J Han, D Raabe, and J E Wittig: Microsc. Microanal., 2017, vol. 23, pp. 402–3.
[15]Fady Archie, Xiaolong Li, and Stefan Zaefferer: Mater. Sci. Eng. A, 2017, vol. 701, pp. 302–13.
M. Koyama, Z. Zhang, M. Wang, D. Ponge, D. Raabe, K. Tsuzaki, H. Noguchi, and C. C. Tasan: Science, 2017, vol. 355, pp. 1055–57.
[17]Motomichi Koyama, Cemal Cem Tasan, and Kaneaki Tsuzaki: Eng. Fract. Mech., 2019, vol. 214, pp. 123–33.
[18]E. V. Pereloma, A. Shekhter, M. K. Miller, and S. P. Ringer: Acta Mater., 2004, vol. 52, pp. 5589–5602.
[19]S. Mukherjee, I. B. Timokhina, C. Zhu, S. P. Ringer, and P. D. Hodgson: Acta Mater., 2013, vol. 61, pp. 2521–30.
E. V. Pereloma, R. A. Stohr, M. K. Miller, and S. P. Ringer: Metall. Mater. Trans. A Phys., 2009, vol. 40, pp. 3069–75.
H.W. Yen, S.W. Ooi, M. Eizadjou, A. Breen, C.Y. Huang, H. K.D.H. Bhadeshia, and S.P. Ringer: Acta Mater., 2015, vol. 82, pp. 100–114.
[22]Michael D. Mulholland and David N. Seidman: Acta Mater., 2011, vol. 59, pp. 1881–97.
A.H. Hunter, J.D. Farren, J.N. Dupont, and D.N. Seidman: Metall. Mater. Trans. A, 2013, vol. 44, pp. 1741–59.
[24]Michael D. Mulholland and David N. Seidman: Scripta Mater., 2009, vol. 60, pp. 992–95.
H.K.D.H. Bhadeshia: Mater. Sci. Forum, 2005, vol. 500–501, pp. 63-74.
[26]Baptiste Gault, Michael P. Moody, Julie M. Cairney, and Simon P. Ringer: Atom Probe Microscopy, 2012.
Y. S. Chen, D. Haley, S. S.A. Gerstl, A. J. London, F. Sweeney, R. A. Wepf, W. M. Rainforth, P. A.J. Bagot, and M. P. Moody: Science, 2017, vol. 355, pp. 1196–99.
[28]L. Sun, T. H. Simm, T. L. Martin, S. McAdam, D. R. Galvin, K. M. Perkins, P. A.J. Bagot, M. P. Moody, S. W. Ooi, P. Hill, M. J. Rawson, and H. K.D.H. Bhadeshia: Acta Mater., 2018, vol. 149, pp. 285–301.
A. K. da Silva, R. D. Kamachali, D. Ponge, B. Gault, J. Neugebauer, and D. Raabe: Acta Mater., 2019, vol. 168, pp. 109–20.
[30]Suihe Jiang, Hui Wang, Yuan Wu, Xiongjun Liu, Honghong Chen, Mengji Yao, Baptiste Gault, Dirk Ponge, Dierk Raabe, Akihiko Hirata, Mingwei Chen, Yandong Wang, and Zhaoping Lu: Nature, 2017, vol. 544, pp. 460–64.
[31]F. Maresca, V. G. Kouznetsova, M. G.D. Geers, and W. A. Curtin: Acta Mater., 2018, vol. 156, pp. 463–78.
[32]Martin Diehl, Pratheek Shanthraj, Philip Eisenlohr, and Franz Roters: Meccanica, 2016, vol. 51, pp. 429–41.
[33]C. C. Tasan, M. Diehl, D. Yan, C. Zambaldi, P. Shanthraj, F. Roters, and D. Raabe: Acta Mater., 2014, vol. 81, pp. 386–400.
[34]D. Brands, D. Balzani, L. Scheunemann, J. Schröder, H. Richter, and D. Raabe: Arch. Appl. Mech., 2016, vol. 86, pp. 575–98.
[35]M. Kraska, M. Doig, D. Tikhomirov, D. Raabe, and F. Roters: Comput. Mater. Sci., 2009, vol. 46, pp. 383–92.
[36]A. Ramazani, Z. Ebrahimi, and U. Prahl: Comput. Mater. Sci., 2014, vol. 87, pp. 241–47.
[37]Fengbo Han, Franz Roters, and Dierk Raabe: Int. J. Plast., 2020, vol. 125, pp. 97–117.
[38]Ricardo A. Lebensohn and Alan Needleman: J. Mech. Phys. Solids, 2016, vol. 97, pp. 333–51.
[39]P. Eisenlohr, M. Diehl, R. A. Lebensohn, and F. Roters: Int. J. Plast., 2013, vol. 46, pp. 37–53.
[40]P. J. Jacques, E. Girault, A. Mertens, B. Verlinden, J. Van Humbeeck, and F. Delannay: ISIJ Int., 2001, vol. 41, pp. 1068–74.
[41]P. Jacques, Q. Furnémont, T. Pardoen, and F. Delannay: Acta Mater., 2001, vol. 49, pp. 139–52.
[42]P. J. Jacques: Curr. Opin. Solid State Mater. Sci., 2004, vol. 8, pp. 259–65.
[43]A. Szczepaniak, H. Springer, R. Aparicio-Fernández, C. Baron, and D. Raabe: Mater. Des., 2017, vol. 124, pp. 183–93.
[44]C. Baron, H. Springer, and D. Raabe: Mater. Des., 2016, vol. 111, pp. 185–91.
[45]C. Baron, H. Springer, and D. Raabe: Mater. Des., 2016, vol. 112, pp. 131–39.
[46]Jonathan Lentz, Arne Röttger, and Werner Theisen: Mater. Charact., 2018, vol. 135, pp. 192–202.
[47]Haniyeh Fayazfar, Mehrnaz Salarian, Allan Rogalsky, Dyuti Sarker, Paola Russo, Vlad Paserin, and Ehsan Toyserkani: Mater. Des., 2018, vol. 144, pp. 98–128.
Christian Haase, Jan Bültmann, Jan Hof, Stephan Ziegler, Sebastian Bremen, Christian Hinke, Alexander Schwedt, Ulrich Prahl, and Wolfgang Bleck: Materials (Basel)., 2017, vol. 10, pp. 56-72.
[49]Qinglong Liu, Qingjun Zhou, Jeffrey Venezuela, Mingxing Zhang, Jianqiu Wang, and Andrej Atrens: Corros. Rev., 2016, vol. 34, pp. 127–52.
K. Tsuzaki: Gift Semin., 2009, pp. 1–39.
G. Lovicu, M. Bottazzi, F. Aiuto, M. DeSanctis, A. Dimatteo, C. Santus, and R. Valentini: Metall. Mater. Trans, 2012, vol. 43, pp. 4075–87.
M. Koyama, M. Rohwerder, C. C. Tasan, A. Bashir, E. Akiyama, K. Takai, D. Raabe, and K. Tsuzaki: Mater. Sci. Technol. United Kingdom, 2017, vol. 33, pp. 1481–96.
M. Koyama, C.C. Tasan, T. Nagashima, E. Akiyama, D. Raabe, and K. Tsuzaki: Philos. Mag. Lett., 2016, vol. 96, pp. 9–18.
M Pietrzyk: J. Mater. Process. Technol., 2002, 125–126, pp. 53–62.
[55]Bassam Mohammed, Taejoon Park, Farhang Pourboghrat, Jun Hu, Rasoul Esmaeilpour, and Fadi Abu-Farha: Int. J. Solids Struct., 2018, vol. 151, pp. 57–75.
P.A. Manohar: Proc. 6th Int. Conf. Recryst. Grain Growth, ReX GG 2016, Springer, 2016, pp. 165–70.
Carl Kusche, Tom Reclik, Martina Freund, Talal Al-Samman, Ulrich Kerzel, and Sandra Korte-Kerzel: PLoS One, 2019, vol. 14, pp. 1-22.
[58]D. J. Branagan: Calphad Comput. Coupling Phase Diagrams Thermochem., 2007, vol. 31, pp. 343–50.
[59]I. Zuazo, B. Hallstedt, B. Lindahl, M. Selleby, M. Soler, A. Etienne, A. Perlade, D. Hasenpouth, V. Massardier-Jourdan, S. Cazottes, and X. Kleber: JOM, 2014, vol. 66, pp. 1747–58.
H.K. Yeddu, T. Lookman, and A. Saxena: J. Mater. Sci., 2014, vol. 49, pp. 3642–51.
H.K.D.H. Bhadeshia: Phys. Metall. Fifth Ed., 2014, pp. 2157–2214.
[62]Sybrand Van Der Zwaag, Lie Zhao, Suzelotte O. Kruijver, and Jilt Sietsma: ISIJ Int., 2002, vol. 42, pp. 1565–70.
W. Xu, P. E J R.D. Castillo, and S. van der Zwaag: Comput. Mater. Sci., 2009, vol. 45, pp. 467–73.
H.K.D.H. Bhadeshia: Bainite in Steels: Theory and Practice, 2015.
F. Huyan, J.Y. Yan, L. Höglund, J. Ågren, and A. Borgenstam: Metall. Mater. Trans, 2018, vol. 49, pp. 1053–60.
[66]M. Gouné, F. Danoix, J. Ågren, Y. Bréchet, C. R. Hutchinson, M. Militzer, G. Purdy, S. Van Der Zwaag, and H. Zurob: Mater. Sci. Eng. R Reports, 2015, vol. 92, pp. 1–38.
[67]Manon Bonvalet-Rolland, Thomas Philippe, and John Ågren: Acta Mater., 2019, vol. 171, pp. 1–7.
[68]J. Ågren: Acta Metall., 1982, vol. 30, pp. 841–51.
[69]J. Odqvist, M. Hillert, and J. Ågren: Acta Mater., 2002, vol. 50, pp. 3213–27.
[70]Bengt Hallstedt, Alexandra V. Khvan, Bonnie B. Lindahl, Malin Selleby, and Shuhong Liu: Calphad Comput. Coupling Phase Diagrams Thermochem., 2017, vol. 56, pp. 49–57.
A.D. Pelton: Phase Diagrams and Thermodynamic Modeling of Solutions, Elsevier, London, 2018.
[72]Zi Kui Liu: J. Phase Equilibria Diffus., 2009, vol. 30, pp. 517–34.
M. Hillert: Phase Equilibria, Phase Diagrams and Phase Transformations: Their Thermodynamic Basis, Second Edition, 2007.
[74]Jürgen Büth and Gerhard Inden: Acta Metall., 1982, vol. 30, pp. 213–24.
[75]G. Inden: Acta Metall., 1974, vol. 22, pp. 945–51.
N. Saunders and A.P. Miodownik: CALPHAD, 1998.
[77]Fritz Körmann, Abed Al Hasan Breidi, Sergei L. Dudarev, Nathalie Dupin, Gautam Ghosh, Tilmann Hickel, Pavel Korzhavyi, Jorge A. Muñoz, and Ikuo Ohnuma: Phys. Status Solidi Basic Res., 2014, vol. 251, pp. 53–80.
[78]Mats Hillert and Magnus Jarl: Calphad, 1978, vol. 2, pp. 227–38.
G. Inden: NATO Sci. Peace Secur. Ser. B Phys. Biophys., 2008, pp. 73–112.
[80]A. Kwiatkowski Da Silva, D. Ponge, Z. Peng, G. Inden, Y. Lu, A. Breen, B. Gault, and D. Raabe: Nat. Commun., 2018, vol. 9, pp. 1–11.
L. Li, Z. Li, A. K. da Silva, Z. Peng, H. Zhao, B. Gault, and D. Raabe: Acta Mater., 2019, vol. 178, pp. 1–9.
D.H. Bratland, G.H. Shercliff, O. R. Myhr, and S. Tjøtta: Acta Mater., 1997.
[83]Larry Kaufman and Morris Cohen: Prog. Met. Phys., 1958, vol. 7, pp. 165–246.
I. R. S. Filho, A. K. Silva, M. J.R. Sandim, D. Ponge, B. Gault, H. R.Z. Sandim, and D. Raabe: Acta Mater., 2019, vol. 166, pp. 178–91.
J.H. Jang, H. K.D.H. Bhadeshia, and D. W. Suh: Scripta Mater., 2013, vol. 68, pp. 195–98.
J. Zhang, D. Raabe, and C.C. Tasan: Acta Mater., 2017, vol. 141, pp. 374–87.
S.I. Baik, M.J.S. Rawlings, and D. C. Dunand: Acta Mater., 2018, vol. 144, pp. 707–15.
[88]J. T. Benzing, A. Kwiatkowski da Silva, L. Morsdorf, J. Bentley, D. Ponge, A. Dutta, J. Han, J. R. McBride, B. Van Leer, B. Gault, D. Raabe, and J. E. Wittig: Acta Mater., 2019, vol. 166, pp. 512–30.
[89]Yuki Toji, Hiroshi Matsuda, Michael Herbig, Pyuck Pa Choi, and Dierk Raabe: Acta Mater., 2014, vol. 65, pp. 215–28.
[90]Yuki Toji, Hiroshi Matsuda, and Dierk Raabe: Acta Mater., 2016, vol. 116, pp. 250–62.
[91]A. Kwiatkowski da Silva, G. Inden, A. Kumar, D. Ponge, B. Gault, and D. Raabe: Acta Mater., 2018, vol. 147, pp. 165–75.
[92]Z. K. Liu and J. Ågren: J. Phase Equilibria, 1995, vol. 16, pp. 30–35.
[93]M. Hillert and J. Ågren: Scripta Mater., 2004, vol. 50, pp. 697–99.
[94]Hao Chen, Ernst Gamsjäger, Siegfried Schider, Hamideh Khanbareh, and Sybrand Van Der Zwaag: Acta Mater., 2013, vol. 61, pp. 2414–24.
[95]Hao Chen and Sybrand Van Der Zwaag: Acta Mater., 2013, vol. 61, pp. 1338–49.
[96]Hao Chen and Sybrand Van Der Zwaag: Acta Mater., 2014, vol. 72, pp. 1–12.
[97]Marion Calcagnotto, Dirk Ponge, Eralp Demir, and Dierk Raabe: Mater. Sci. Eng. A, 2010, vol. 527, pp. 2738–46.
[98]J. Kadkhodapour, S. Schmauder, D. Raabe, S. Ziaei-Rad, U. Weber, and M. Calcagnotto: Acta Mater., 2011, vol. 59, pp. 4387–94.
[99]J. Kundin, D. Raabe, and H. Emmerich: J. Mech. Phys. Solids, 2011, vol. 59, pp. 2082–2102.
[100]S. Y. Hu and L. Q. Chen: Acta Mater., 2001, vol. 49, pp. 1879–90.
T.W. Heo, S. Bhattacharyya, and L. Q. Chen: Acta Mater., 2011, vol. 59, pp. 7800–15.
[102]Y. Wang and A. G. Khachaturyan: Acta Mater., 1997, vol. 45, pp. 759–73.
[103]A G Khachaturyan, Y U Wang, Y M Jin, and A M Cuitin: Acta Mater., 2001, vol. 49, pp. 1847–57.
[104]P. Shanthraj, C. Liu, A. Akbarian, B. Svendsen, and D. Raabe: Comput. Methods Appl. Mech. Eng., 2020, vol. 365, p. 113029.
[105]D. T. Pierce, J. A. Jiménez, J. Bentley, D. Raabe, C. Oskay, and J. E. Wittig: Acta Mater., 2014, vol. 68, pp. 238–53.
[106]M. Linderov, C. Segel, A. Weidner, H. Biermann, and A. Vinogradov: Mater. Sci. Eng. A, 2014, vol. 597, pp. 183–93.
[107]Xiaodong Tan, Dirk Ponge, Wenjun Lu, Yunbo Xu, Xiaolong Yang, Xi Rao, Di Wu, and Dierk Raabe: Acta Mater., 2019, vol. 165, pp. 561–76.
J.B. Seol, D. Raabe, P. P. Choi, Y. R. Im, and C. G. Park: Acta Mater., 2012, vol. 60, pp. 6183–99.
[109]D. V. Edmonds, K. He, F. C. Rizzo, B. C. De Cooman, D. K. Matlock, and J. G. Speer: Mater. Sci. Eng. A, 2006, vol. 438–440, pp. 25–34.
U. Brüx, G. Frommeyer, O. Grässel, L. W. Meyer, and A. Weise: Steel Res., 2002, vol. 73, pp. 294–98.
[111]M. M. Wang, C. C. Tasan, D. Ponge, and D. Raabe: Acta Mater., 2016, vol. 111, pp. 262–72.
[112]Z. Zhang, M. Koyama, M. M. Wang, K. Tsuzaki, C. C. Tasan, and H. Noguchi: Int. J. Fatigue, 2017, vol. 100, pp. 176–86.
[113]P. H. Adler, G. B. Olson, and W. S. Owen: Metall. Mater. Trans. A, 1986, vol. 17, pp. 1725–37.
A. Saeed-Akbari, J. Imlau, U. Prahl, and W. Bleck: Metall. Mater. Trans., 2009, vol. 40, pp. 3076–90.
J.W.Gibbs: Themodynamics, 1961, vol. 1.
[116]A. Kwiatkowski da Silva, G. Leyson, M. Kuzmina, D. Ponge, M. Herbig, S. Sandlöbes, B. Gault, J. Neugebauer, and D. Raabe: Acta Mater., 2017, vol. 124, pp. 305–15.
N.H. Heo and H.C. Lee: Metall. Mater. Trans., 1996, vol. 27, pp. 1015–20.
[118]Margarita Kuzmina, Dirk Ponge, and Dierk Raabe: Acta Mater., 2015, vol. 86, pp. 182–92.
[119]M. Guttmann, Ph Dumoulin, and M. Wayman: Metall. Trans. A, 1982, vol. 13, pp. 1693–1711.
[120]P. Maier and R. G. Faulkner: Mater. Charact., 2003, vol. 51, pp. 49–62.
[121]F. Nikbakht, M. Nasim, C. Davies, E. A. Wilson, and H. Adrian: Mater. Sci. Technol., 2009, vol. 26, pp. 552–58.
[122]Kazuma Ito, Hideaki Sawada, and Shigenobu Ogata: Phys. Rev. Mater., 2019, vol. 3, p. 13609.
[123]N. H. Heo, J. W. Nam, Y. U. Heo, and S. J. Kim: Acta Mater., 2013, vol. 61, pp. 4022–34.
[124]F. Moszner, S. S.A. Gerstl, P. J. Uggowitzer, and J. F. Löffler: Acta Mater., 2014, vol. 73, pp. 215–26.
P. Lejček and S. Hofmann: J. Phys. Condens. Matter, 2016, vol. 28, pp. 064001–10.
[126]William R. Bitler: Scripta Metall., 1971, vol. 5, pp. 1045–48.
M. Calcagnotto, D. Ponge, and D. Raabe: in ISIJ Int., 2008, 48, pp. 1096–1101.
[128]H. Zhang, B. Bai, and D. Raabe: Acta Mater., 2011, vol. 59, pp. 5787–5802.
[129]Y. F. Shen, N. Jia, Y. D. Wang, X. Sun, L. Zuo, and D. Raabe: Acta Mater., 2015, vol. 97, pp. 305–15.
K.T. Park, Y. S. Kim, J. G. Lee, and D. H. Shin: Mater. Sci. Eng. A, 2000, vol. 293, pp. 165–72.
X.D. Tan, Y.B. Xu, D. Ponge, X.L. Yang, Z.P. Hu, F. Peng, X.W. Ju, Di Wu, and Dierk Raabe: Mater. Sci. Eng. A, 2016, vol. 656, pp. 200–215.
M.M. Wang, C.C. Tasan, D. Ponge, A.C. Dippel, D. Raabe, A.-C. Dippel, C.C. Tasan, D. Ponge, and M. M. Wang: Acta Mater., 2015, vol. 85, pp. 216–28.
[133]Katharina Steineder, Daniel Krizan, Reinhold Schneider, Coline Béal, and Christof Sommitsch: Acta Mater., 2017, vol. 139, pp. 39–50.
[134]Z. H. Cai, H. Ding, R. D.K. Misra, and Z. Y. Ying: Acta Mater., 2015, vol. 84, pp. 229–36.
[135]M. M. Wang, C. C. Tasan, D. Ponge, A. Kostka, and D. Raabe: Acta Mater., 2014, vol. 79, pp. 268–81.
[136]J.T. Benzing, Y. Liu, X. Zhang, W.E. Luecke, D. Ponge, A. Dutta, C. Oskay, D. Raabe, and J.E. Wittig: Acta Mater., 2019, vol. 177, pp. 250–65.
I. Karaman, H. Sehitoglu, A.J. Beaudoin, Y.I. Chumlyakov, H.J. Maier, and C.N. Tome: Acta Mater. 2000, vol. 48, pp. 2031–47.
[138]A. Dehghan-Manshadi, M. R. Barnett, and P. D. Hodgson: Mater. Sci. Eng. A, 2008, vol. 485, pp. 664–72.
[139]F. K. Yan, G. Z. Liu, N. R. Tao, and K. Lu: Acta Mater., 2012, vol. 60, pp. 1059–71.
S. Kang, Y. S. Jung, J. H. Jun, and Y.K. Lee: Mater. Sci. Eng. A, 2010, vol. 527, pp. 745–51.
[141]A Hasnaoui, P M Derlet, and H Van Swygenhoven: Acta Mater., 2004, vol. 52, pp. 2251–58.
O. Bouaziz, Y. Estrin, Y. Bréchet, and J.D. Embury: Scripta Mater., 2010, vol. 63, pp. 477–79.
B. Sun, Y. Ma, N. Vanderesse, R. S. Varanasi, W. Song, P. Bocher, D. Ponge, and D. Raabe: Acta Mater., 2019, vol. 178, pp. 10–25.
[144]R. D.K. Misra, V. S.A. Challa, P. K.C. Venkatsurya, Y F Shen, M C Somani, and L P Karjalainen: Acta Mater., 2015, vol. 84, pp. 339–48.
[145]Yoshikazu Matsuoka, Tatsuya Iwasaki, Nobuo Nakada, Toshihiro Tsuchiyama, and Setsuo Takaki: ISIJ Int., 2013, vol. 53, pp. 1224–30.
G.B. Olson and M. Cohen: J. Less Common Met., 1972, vol. 28, pp. 107–18.
[147]R Ueji, N Tsuchida, D Terada, N Tsuji, Y Tanaka, A Takemura, and K Kunishige: Scripta Mater., 2008, vol. 59, pp. 963–66.
[148]I. Gutierrez-Urrutia, S. Zaefferer, and D. Raabe: Mater. Sci. Eng. A, 2010, vol. 527, pp. 3552–60.
[149]M. A. Meyers, O. Vöhringer, and V. A. Lubarda: Acta Mater., 2001, vol. 49, pp. 4025–39.
[150]K M Rahman, V A Vorontsov, and D Dye: Acta Mater., 2015, vol. 89, pp. 247–57.
[151]O Bouaziz, S Allain, and C Scott: Scripta Mater., 2008, vol. 58, pp. 484–87.
[152]A. Considère: Ann. Des Ponts Chaussées, 1885, vol. 9, pp. 574–775.
[153]J. T. Benzing, W. A. Poling, D. T. Pierce, J. Bentley, K. O. Findley, D. Raabe, and J. E. Wittig: Mater. Sci. Eng. A, 2018, vol. 711, pp. 78–92.
E. Welsch, D. Ponge, S. M. H. Haghighat, S. Sandlöbes, P. Choi, M. Herbig, S. Zaefferer, and D. Raabe: Acta Mater., 2016, vol. 116, pp. 188–99.
[155]Dierk Raabe, Zhiming Li, and Dirk Ponge: MRS Bull., 2019, vol. 44, pp. 266–72.
[156]M. J. Yao, E. Welsch, D. Ponge, S. M.H. Haghighat, S. Sandlöbes, P. Choi, M. Herbig, I. Bleskov, T. Hickel, M. Lipinska-Chwalek, P. Shanthraj, C. Scheu, S. Zaefferer, B. Gault, and D. Raabe: Acta Mater., 2017, vol. 140, pp. 258–73.
[157]I. Gutierrez-Urrutia and D. Raabe: Scripta Mater., 2013, vol. 69, pp. 53–56.
[158]I. Gutierrez-Urrutia and D. Raabe: Scripta Mater., 2012, vol. 66, pp. 992–96.
[159]Poulumi Dey, Roman Nazarov, Biswanath Dutta, Mengji Yao, Michael Herbig, Martin Friák, Tilmann Hickel, Dierk Raabe, and Jörg Neugebauer: Phys. Rev. B, 2017, vol. 95, p. 104108.
[160]M. J. Yao, P. Dey, J. B. Seol, P. Choi, M. Herbig, R. K.W. Marceau, T. Hickel, J. Neugebauer, and D. Raabe: Acta Mater., 2016, vol. 106, pp. 229–38.
J.B. Seol, D. Raabe, P. Choi, H.S. Park, J. H. Kwak, and C.G. Park: Scripta Mater., 2013, vol. 68, pp. 348–53.
R. Rana, C. Lahaye, and R. K. Ray: Jom, 2014, vol. 66, pp. 1734–46.
[163]Wei Chun Cheng: Jom, 2014, vol. 66, pp. 1809–20.
[164]Georg Frommeyer and Udo Brüx: Steel Res. Int., 2006, vol. 77, pp. 627–33.
L.N. Bartlett, D. C. VanAken, J. Medvedeva, D. Isheim, N.I. Medvedeva, and K. Song: Metall. Mater. Trans., 2014, vol. 45, pp. 2421–35.
J. R. Mianroodi and B. Svendsen: J. Mech. Phys. Solids, 2015, vol. 77, pp. 109–22.
J. R. Mianroodi, P. Shanthraj, P. Kontis, J. Cormier, B. Gault, B. Svendsen, and D. Raabe: Acta Mater., 2019, vol. 175, pp. 250–61.
[168]Christian H. Liebscher, Mengji Yao, Poulumi Dey, Marta Lipińska-Chwalek, Benjamin Berkels, Baptiste Gault, Tilmann Hickel, Michael Herbig, Joachim Mayer, Jörg Neugebauer, Dierk Raabe, Gerhard Dehm, and Christina Scheu: Phys. Rev. Mater., 2018, vol. 2, pp. 1–6.
M. Herbig, D. Raabe, Y.J. Li, P. Choi, S. Zaefferer, and S. Goto: Phys. Rev. Lett., 2014, vol. 112, pp. 126103–08.
[170]W. Lu, M. Herbig, C. H. Liebscher, L. Morsdorf, R. K.W. Marceau, G. Dehm, and D. Raabe: Acta Mater., 2018, vol. 158, pp. 297–312.
S. K. Makineni, A. Kumar, M. Lenz, P. Kontis, T. Meiners, C. Zenk, S. Zaefferer, G. Eggeler, S. Neumeier, E. Spiecker, D. Raabe, and B. Gault: Acta Mater., 2018, vol. 155, pp. 362–71.
D. Raabe, P. P. Choi, Y. Li, A. Kostka, X. Sauvage, F. Lecouturier, K. Hono, R. Kirchheim, R. Pippan, and D. Embury: MRS Bull., 2010, vol. 35, pp. 982–91.
[173]Y. J. Li, P. Choi, C. Borchers, S. Westerkamp, S. Goto, D. Raabe, and R. Kirchheim: Acta Mater., 2011, vol. 59, pp. 3965–77.
[174]Yujiao Li, Dierk Raabe, Michael Herbig, Pyuck Pa Choi, Shoji Goto, Aleksander Kostka, Hiroshi Yarita, Christine Borchers, and Reiner Kirchheim: Phys. Rev. Lett., 2014, vol. 113, pp. 1–5.
T.A. Timmerscheidt, P. Dey, D. Bogdanovski, J. Appen, T. Hickel, J. Neugebauer, and R. Dronskowski: Metals (Basel)., 2017, vol. 7, pp. 264–72.
[176]Motomichi Koyama, Hauke Springer, Sergiy V. Merzlikin, Kaneaki Tsuzaki, Eiji Akiyama, and Dierk Raabe: Int. J. Hydrogen Energy, 2014, vol. 39, pp. 4634–46.
M. B. Djukic, G. M. Bakic, V. S. Zeravcic, A. Sedmak, and B. Rajicic: Eng. Fract. Mech., 2019, 12, pp. 161–183..
J.R. Scully, H. Dogan, D. Li, and R.P. Gangloff: Corrosion, 2004.
[179]Ao H Cottrell and B A Bilby: Proc. Phys. Soc. Sect. A, 1949, vol. 62, pp. 49–62.
W.G Johnston, J.J. Gilman: J. Appl. Phys., 1959, vol. 30, pp. 129–44.
[181]N Tsuji, Y Ito, Y Saito, and Y Minamino: Scripta Mater., 2002, vol. 47, pp. 893–99.
[182]John P Hirth: Met. Trans, 1972, vol. 3, pp. 3047–67.
[183]L Capolungo, D E Spearot, M Cherkaoui, D L McDowell, J Qu, and K I Jacob: J. Mech. Phys. Solids, 2007, vol. 55, pp. 2300–2327.
[184]L. Morsdorf, O. Jeannin, D. Barbier, M. Mitsuhara, D. Raabe, and C. C. Tasan: Acta Mater., 2016, vol. 121, pp. 202–14.
[185]L. Morsdorf, C. C. Tasan, D. Ponge, and D. Raabe: Acta Mater., 2015, vol. 95, pp. 366–77.
[186]Marion Calcagnotto, Dirk Ponge, and Dierk Raabe: Mater. Sci. Eng. A, 2010, vol. 527, pp. 7832–40.
M. Calcagnotto, D. Ponge, Y. Adachi, and D. Raabe: Proc. 2nd Int. Symp. Steel Sci., 2009, pp. 1–4.
[188]I. Gutierrez-Urrutia, S. Zaefferer, and D. Raabe: Scripta Mater., 2009, vol. 61, pp. 737–40.
[189]M. Herbig, M. Kuzmina, C. Haase, R. K.W. Marceau, I. Gutierrez-Urrutia, D. Haley, D. A. Molodov, P. Choi, and D. Raabe: Acta Mater., 2015, vol. 83, pp. 37–47.
J.P. Chateau, T.A. Lebedkina, M.A. Lebyodkin, A. Jacques, and S. Allain: J. Phys. Conf. Ser., 2010.
S.J. Lee, J. Kim, S. N. Kane, and B. C. Cooman: Acta Mater., 2011, vol. 59, pp. 6809–19.
[192]S. Vercammen, B. Blanpain, B. C. De Cooman, and P. Wollants: Acta Mater., 2004, vol. 52, pp. 2005–12.
B.C. DeCooman, Y. Estrin, and S. K. Kim: Acta Mater., 2018, vol. 142, pp. 283–362.
[194]Binhan Sun, Fateh Fazeli, Colin Scott, Baoqi Guo, Clodualdo Aranas, Xin Chu, Mohammad Jahazi, and Stephen Yue: Mater. Sci. Eng. A, 2018, vol. 729, pp. 496–507.
[195]R. A. Mulford and U. F. Kocks: Acta Metall., 1979, vol. 27, pp. 1125–34.
[196]P G McCormigk: Acta Metall., 1972, vol. 20, pp. 351–54.
I.C. Jung and B. C. DeCooman: Acta Mater., 2013, vol. 61, pp. 6724–35.
S. Allain, P. Cugy, C. Scott, J.P. Chateau, A. Rusinek, and A. Deschamps: Int. J. Mater. Res., 2008, vol. 99, pp. 734–38.
T. Shun, C.M. Wan, and J.G.Byrne: Acta Metall. Mater., 1992, vol. 40, pp. 3407–12.
Y.N. Dastur and W.C. Leslie: Metall. Trans. A, 1981, vol. 12A, pp. 749–59.
[201]K. S.B. Rose and S G Gloverj: Acta Metall., 1966, vol. 14, pp. 1505–16.
[202]Motomichi Koyama, Takahiro Sawaguchi, and Kaneaki Tsuzaki: ISIJ Int., 2018, vol. 58, pp. 1383–95.
[203]Binhan Sun, Nicolas Vanderesse, Fateh Fazeli, Colin Scott, Jianqiang Chen, Philippe Bocher, Mohammad Jahazi, and Stephen Yue: Scripta Mater., 2017, vol. 133, pp. 9–13.
[204]A Turnbull and R B Hutchings: Mater. Sci. Eng. A, 1994, vol. 177, pp. 161–71.
H.K. D. H. Bhadeshia: ISIJ Int., 2016, vol. 56, pp. 24–36.
[206]Yoji Mine and Zenji Horita: Mater. Trans., 2012, vol. 53, pp. 773–85.
W.Y. Choo and J.Y. Lee: Metall. Trans. A, 1982, vol. 13A, pp. 135–40.
[208]O Dmitrieva, D Ponge, G Inden, J. Millán, P Choi, J. Sietsma, and D Raabe: Acta Mater., 2011, vol. 59, pp. 364–74.
[209]Binhan Sun, Dhanalakshmi Palanisamy, Dirk Ponge, Baptiste Gault, Fateh Fazeli, Colin Scott, Stephen Yue, and Dierk Raabe: Acta Mater., 2019, vol. 164, pp. 683–96.
[210]J M Moyer and G S Ansell: Metall. Trans. A, 1975, vol. 6, pp. 1785–91.
[211]M. Herbig, P. Choi, and D. Raabe: Ultramicroscopy, 2015, vol. 153, pp. 32–39.
T.G. Digges, C.R. Irish, and N.L. Carwile: J. Res. Natl. Bur. Stand., 1948, vol. 41, p. 545.
[213]C. R. Simcoe, A. R. Elsea, and G. K. Manning: JOM, 1955, vol. 7, pp. 193–200.
[214]C. R. Simcoe, A. R. Elsea, and G. K. Manning: JOM, 1956, vol. 8, pp. 984–88.
D.W. Fan, H.S. Kim, S. Birosca, and B.C. De Cooman: Mater. Sci. Technol. Conf. Exhib. MS T’07 - “Exploring Struct. Process. Appl. Across Mult. Mater. Syst., 2007, pp. 98–109.
[216]H. Karbasian and A. E. Tekkaya: J. Mater. Process. Technol., 2010, vol. 210, pp. 2103–18.
A. E. Tekkaya, H. Karbasian, W. Homberg, and M. Kleiner: Prod. Eng., 2007, vol. 1, pp. 85–89.
[218]C. J. McMahon: Metall. Trans. A, 1980, vol. 11, pp. 531–35.
[219]L. Karlsson, H. Nordén, and H. Odelius: Acta Metall., 1988, vol. 36, pp. 1–12.
[220]J. Takahashi, K. Ishikawa, K. Kawakami, M. Fujioka, and N. Kubota: Acta Mater., 2017, vol. 133, pp. 41–54.
[221]Goro Miyamoto, Ai Goto, Naoki Takayama, and Tadashi Furuhara: Scripta Mater., 2018, vol. 154, pp. 168–71.
[222]R. C. Sharma and G. R. Purdy: Met. Trans, 1974, vol. 5, pp. 939–47.
[223]Y.J. J. Li, A. Kostka, P. Choi, S. Goto, D. Ponge, R. Kirchheim, and D. Raabe: Acta Mater., 2015, vol. 84, pp. 110–23.
[224]Y J Li, D Ponge, P Choi, and D Raabe: Ultramicroscopy, 2015, vol. 159, pp. 240–47.
[225]Y. J. Li, D. Ponge, P. Choi, and D. Raabe: Scripta Mater., 2015, vol. 96, pp. 13–16.
[226]D. Raabe, M. Herbig, S. Sandlöbes, Y. Li, D. Tytko, M. Kuzmina, D. Ponge, and P. P. Choi: Curr. Opin. Solid State Mater. Sci., 2014, vol. 18, pp. 253–61.
[227]C. M. Liu, T. Nagoya, K. Abiko, and H. Kimura: Metall. Trans. A, 1992, vol. 23, pp. 263–69.
S. Zhang, O.Y. Kontsevoi, A.J. Freeman, and G.B. Olson: Phys. Rev. B Condens. Matter Mater. Phys., 2011, vol. 84, pp. 1–9.
R. Wu, A. J. Freeman, and G. B. Olson: Science, 1994, vol. 265, pp. 376–80.
[230]A. T. Davenport, F. G. Berry, and R. W.K. Honeycombe: Met. Sci. J., 1968, vol. 2, pp. 104–06.
R.W.K. Honeycombe: Metall. Trans A, 1976, vol. 7A, pp. 915–36.
[232]Tetsuo Shimizu, Yoshimasa Funakawa, and Shinjiro Kaneko: JFE Tech. Rep., 2004, vol. 4, pp. 25–31.
[233]Yoshimasa Funakawa, Tsuyoshi Shiozaki, Kunikazu Tomita, Tetsuo Yamamoto, and Eiji Maeda: ISIJ Int., 2004, vol. 44, pp. 1945–51.
H.K.D.H. Bhadeshia and R.W.K. Honeycombe: Steels: Microstructure and Properties, Butterworth-Heinemann, 2006.
[235]D. V. Edmonds, G. L. Dunlop, and R. W.K. Honeycombe: Inst Met Monogr Rep Ser, 1973, vol. 1, pp. 195–99.
[236]A. Barbacki and R. W.K. Honeycombe: Metallography, 1976, vol. 9, pp. 277–91.
[237]R. M. Smith and D. P. Dunne: Mater. Forum, 1988, vol. 11, pp. 166–81.
M.Y. Chen, H. W. Yen, and J. R. Yang: Scripta Mater., 2013, vol. 68, pp. 829–32.
[239]A T Davenport and R W K Honeycombe: Proc. R. Soc. London. A. Math. Phys. Sci., 1971, vol. 322, pp. 191–205.
[240]I. B. Timokhina, P. D. Hodgson, S. P. Ringer, R. K. Zheng, and E. V. Pereloma: Scripta Mater., 2007, vol. 56, pp. 601–04.
[241]Y. J. Zhang, G. Miyamoto, K. Shinbo, and T. Furuhara: Scripta Mater., 2013, vol. 69, pp. 17–20.
[242]S. Dhara, R. K.W. Marceau, K. Wood, T. Dorin, I. B. Timokhina, and P. D. Hodgson: Mater. Sci. Eng. A, 2018, vol. 718, pp. 74–86.
[243]R. A. Ricks and P. R. Howell: Met. Sci., 1982, vol. 16, pp. 317–21.
[244]R. A. Ricks and P. R. Howell: Acta Metall., 1983, vol. 31, pp. 853–61.
[245]R. Okamoto, A. Borgenstam, and J. Ågren: Acta Mater., 2010, vol. 58, pp. 4783–90.
H.W. Yen, P.Y. Chen, C.Y. Huang, and J. R. Yang: Acta Mater., 2011, vol. 59, pp. 6264–74.
D.P. Dunne, R.M. Smith, and T. Chandra: in Proceedings of Conference on HSLA Steels, D.P. Dunne and T. Chandra, eds., AIME, Wollongong, Australia, 1984.
[248]F. A. Khalid and D. V. Edmonds: Scripta Metall. Mater., 1994, vol. 30, pp. 1251–55.
[249]F. A. Khalid and D. V. Edmonds: Surf. Sci., 1992, vol. 266, pp. 424–32.
[250]T. Sakuma and R. W K Honeycombe: Met. Sci., 1984, vol. 18, pp. 449–54.
[251]K. Han, G. D.W. Smith, and D. V. Edmonds: Mater. Des., 1993, vol. 14, pp. 79–82.
[252]L. Yuan, D. Ponge, J. Wittig, P. Choi, J. A. Jiménez, and D. Raabe: Acta Mater., 2012, vol. 60, pp. 2790–2804.
[253]S. Freeman and R. W.K. Honeycombe: Met. Sci., 1977, vol. 11, pp. 59–64.
R. Lagneborg and S. Zajac: Metall. Mater. Trans., 2001, vol. 32, pp. 39–50.
[255]Rune Lagneborg, Tadeusz Siwecki, Stanislaw Zajac, and Bevis Hutchinson: Scand. J. Metall., 1999, vol. 28, pp. 186–241.
[256]H. J. Kestenbach, S. S. Campos, and E. V. Morales: Mater. Sci. Technol., 2006, vol. 22, pp. 615–26.
[257]E. V. Morales, J. Gallego, and H. J. Kestenbach: Philos. Mag. Lett., 2003, vol. 83, pp. 79–87.
[258]H. J. Kestenbach and J. Gallego: Scripta Mater., 2001, vol. 44, pp. 791–96.
[259]Naoya Kamikawa, Masahiro Hirohashi, Yu Sato, Elango Chandiran, Goro Miyamoto, and Tadashi Furuhara: ISIJ Int., 2015, vol. 55, pp. 1781–90.
S.P. Tsai, C.H. Jen, H.W. Yen, C.Y. Chen, M.C. Tsai, C.Y. Huang, Y.T. Wang, and J.R. Yang: Mater. Charact., 2017, vol. 123, pp. 153–58.
[261]Ilias Bikmukhametov, Hossein Beladi, Jiangting Wang, Peter D. Hodgson, and Ilana Timokhina: Acta Mater., 2019, vol. 170, pp. 75–86.
[262]J. B. Seol, S. H. Na, B. Gault, J. E. Kim, J. C. Han, C. G. Park, and D. Raabe: Sci. Rep., 2017, vol. 7, pp. 1–9.
[263]A. Pineau, A. A. Benzerga, and T. Pardoen: Acta Mater., 2016, vol. 107, pp. 424–83.
[264]C.C. C. Tasan, J.P.M. Hoefnagels, M. Diehl, D. Yan, F. Roters, and D. Raabe: Int. J. Plast., 2014, vol. 63, pp. 198–210.
H.N. Han, C.G. Lee, D.W. Suh, and S.J. Kim: Mater. Sci. Eng. A, 2008, vol. 485, pp. 224–33.
[266]Marion Calcagnotto, Yoshitaka Adachi, Dirk Ponge, and Dierk Raabe: Acta Mater., 2011, vol. 59, pp. 658–70.
G. Krauss: Metall. Mater. Trans, 2001, vol. 32, pp. 861–77.
[268]M. P. Seah: Acta Metall., 1980, vol. 28, pp. 955–62.
[269]M. P. Seah: Surf. Sci., 1975, vol. 53, pp. 168–212.
J.R. Rice and J.S. Wang: Mater. Sci. Eng. A, 1989, vol. 107, pp. 23–40.
H. Song, S.S. Sohn, J.H. Kwak, B.J. Lee, and S. Lee: Mater. Sci., 2016, vol. 47, pp. 2674–85.
[272]Toru Miyazaki, Takao Kozakai, and Takeshi Tsuzuki: J. Mater. Sci., 1986, vol. 21, pp. 2557–64.
H.Y. Yu, S. M. Lee, J. H. Nam, S. J. Lee, D. Fabrègue, M. H. Park, N. Tsuji, and Y. K. Lee: Acta Mater., 2017, vol. 131, pp. 435–44.
[274]Z. C. Luo, R. D. Liu, X. Wang, and M. X. Huang: Acta Mater., 2018, vol. 150, pp. 59–68.
[275]J. P.M. Hoefnagels, C. C. Tasan, F. Maresca, F. J. Peters, and V. G. Kouznetsova: J. Mater. Sci., 2015, vol. 50, pp. 6882–97.
[276]C. Charitidis and S. Logothetidis: Thin Solid Films, 2005, vol. 482, pp. 120–25.
J.H. Kim, J.H. Sung, K. Piao, and R. H. Wagoner: Int. J. Plast., 2011, vol. 27, pp. 1658–76.
R.H. Wagoner, J.H. Kim, and J. H. Sung: Int. J. Mater. Form., 2009, vol. 2, pp. 359–62.
M. Koyama, C.C. Tasan, E. Akiyama, K. Tsuzaki, and D. Raabe: Acta Mater., 2014, vol. 70, pp. 174–87.
[280]H. Ghadbeigi, C. Pinna, and S. Celotto: Mater. Sci. Eng. A, 2013, vol. 588, pp. 420–31.
A. Ramazani, M. Abbasi, U. Prahl, and W. Bleck: Comput. Mater. Sci., 2012, vol. 64, pp. 101–5.
[282]William H. Johnson: Nature, 1875, vol. 11, p. 393.
[283]M. Nagumo: ISIJ Int., 2001, vol. 41, pp. 590–98.
[284]T. Hickel, R. Nazarov, E. J. McEniry, G. Leyson, B. Grabowski, and J. Neugebauer: Jom, 2014, vol. 66, pp. 1399–1405.
[285]Jeffrey Venezuela, Qinglong Liu, Mingxing Zhang, Qingjun Zhou, and Andrej Atrens: Corros. Rev., 2016, vol. 34, pp. 153–86.
[286]H. M. Flower: Int. Mater. Rev., 2012, vol. 37, pp. 196–196.
[287]A. Pundt and R. Kirchheim: Annu. Rev. Mater. Res., 2006, vol. 36, pp. 555–608.
[288]C. J. McMahon: Eng. Fract. Mech., 2001, vol. 68, pp. 773–88.
[289]May L. Martin, Mohsen Dadfarnia, Akihide Nagao, Shuai Wang, and Petros Sofronis: Acta Mater., 2019, vol. 165, pp. 734–50.
[290]Michihiko Nagumo and Kenichi Takai: Acta Mater., 2019, vol. 165, pp. 722–33.
S.P. Lynch: Corros. Rev., 2012, vol. 30, pp. 63–104.
[292]Reiner Kirchheim: Scripta Mater., 2010, vol. 62, pp. 67–70.
[293]I. M. Robertson, H. K. Birnbaum, and P. Sofronis: Dislocations in Solids, 2009, vol. 15, pp. 249–93.
M. Koyama, E. Akiyama, Y.K. Lee, . D. Raabe, and K. Tsuzaki: Int. J. Hydrogen Energy, 2017, vol. 42, pp. 12706–23.
[295]Waldemar Krieger, Sergiy V. Merzlikin, Asif Bashir, Agnieszka Szczepaniak, Hauke Springer, and Michael Rohwerder: Acta Mater., 2018, vol. 144, pp. 235–44.
A.J. Breen, L. T. Stephenson, B. Sun, Y. Li, O. Kasian, D. Raabe, M. Herbig, and B. Gault: Acta Mater., 2020, vol. 188, pp. 108–20.
[297]Binhan Sun, Waldemar Krieger, Michael Rohwerder, Dirk Ponge, and Dierk Raabe: Acta Mater., 2020, vol. 183, pp. 313–28.
[298]Jun Takahashi, Toshimi Tarui, and Kazuto Kawakami: Ultramicroscopy, 2009, vol. 109, pp. 193–99.
[299]T. Nagashima, M. Koyama, A. Bashir, M. Rohwerder, C. C. Tasan, E. Akiyama, D. Raabe, and K. Tsuzaki: Mater. Corros., 2017, vol. 68, pp. 306–10.
[300]Motomichi Koyama, Eiji Akiyama, Kaneaki Tsuzaki, and Dierk Raabe: Acta Mater., 2013, vol. 61, pp. 4607–18.
[301]M. Dadfarnia, P. Sofronis, and T. Neeraj: Int. J. Hydrogen Energy, 2011, vol. 36, pp. 10141–48.
[302]Shuai Wang, May L. Martin, Petros Sofronis, Somei Ohnuki, Naoyuki Hashimoto, and Ian M. Robertson: Acta Mater., 2014, vol. 69, pp. 275–82.
N. Narita, C. J. Altstetter, and H. K. Birnbaum: Mater. Sci., 1982, vol. 13A, pp. 1355–65.
[304]S. Bechtle, M. Kumar, B. P. Somerday, M. E. Launey, and R. O. Ritchie: Acta Mater., 2009, vol. 57, pp. 4148–57.
[305]Eunan J. McEniry, Tilmann Hickel, and Jörg Neugebauer: Acta Mater., 2018, vol. 150, pp. 53–58.
[306]Jun Takahashi, Kazuto Kawakami, and Yukiko Kobayashi: Acta Mater., 2018, vol. 153, pp. 193–204.
[307]Jun Takahashi, Kazuto Kawakami, Yukiko Kobayashi, and Toshimi Tarui: Scripta Mater., 2010, vol. 63, pp. 261–64.
D. An, W. Krieger, and S. Zaefferer: Int. J. Plast., 2020, vol. 126, pp. 102625–37.
L.C.D. Fielding, E.J. Song, D.K. Han, H.K.D.H. Bhadeshia, and D.W. Suh: Proc. R. Soc. A Math. Phys. Eng. Sci., 2014, vol. 470.
[310]Howard K Birnbaum and Petros Sofronis: Mater. Sci. Eng. A, 1994, vol. 176, pp. 191–202.
M. Varela, J. Gazquez, T.J. Pennycook, C. Magen, M.P. Oxley, and S.J. Pennycook: Scanning Transmission Electron Microscopy, Springer, New York, NY, 2011, pp. 429–66.
L. Jones, S. Wenner, M. Nord, P. H. Ninive, O. M. Løvvik, R. Holmestad, and P. D. Nellist: Ultramicroscopy, 2017, vol. 179, pp. 57–62.
B. Berkels and C. H Liebscher: Ultramicroscopy, 2019, vol. 198, pp. 49–57.
[314]Gilberto Casillas, Azdiar A. Gazder, Elena V. Pereloma, and Ahmed A. Saleh: Mater. Charact., 2017, vol. 123, pp. 275–81.
Y. Yang, C.C. Chen, M.C. Scott, C. Ophus, R. Xu, A. Pryor, L. Wu, F. Sun, W. Theis, J. Zhou, M. Eisenbach, P.R.C. Kent, R. F Sabirianov, H. Zeng, P. Ercius, and J. Miao: Nature, 2017, vol. 542, pp. 75–79.
A. Devaraj, D. E. Perea, J. Liu, L. M. Gordon, T.J. Prosa, P. Parikh, D. R. Diercks, S. Meher, R. P. Kolli, Y. S. Meng, and S. Thevuthasan: Int. Mater. Rev., 2018, vol. 63, pp. 68–101.
[317]David N. Seidman: Annu. Rev. Mater. Res., 2007, vol. 37, pp. 127–58.
T.F. Kelly and D.J. Larson: Annu. Rev. Mater. Res., 2012, vol. 42, pp. 1–31.
[319]Alexander S. Chang and Lincoln J. Lauhon: Curr. Opin. Solid State Mater. Sci., 2018, vol. 22, pp. 171–87.
B. Gault, X.Y. Cui, M.P. Moody, A. V. Ceguerra, A. J. Breen, R. K.W. Marceau, and S. P. Ringer: Scripta Mater., 2017, vol. 131, pp. 93–97.
M.P. Moody, A.V. Ceguerra, A.J. Breen, X.Y.Cui, B. Gault, L. T. Stephenson, R.K.W. Marceau, R. C. Powles, and S.P. Ringer: Nat. Commun., 2014, vol. 5, pp. 1–10.
[322]W K Yeoh, B Gault, X Y Cui, C Zhu, M P Moody, L. Li, R K Zheng, W X Li, X L Wang, S X Dou, G. L. Sun, C T Lin, and S P Ringer: Phys. Rev. Lett., 2011, vol. 106, p. 247002.
Y. Amouyal, Z. Mao, and D.N. Seidman: Acta Mater., 2014, vol. 74, pp. 296–308.
[324]Zugang Mao, Chantal K. Sudbrack, Kevin E. Yoon, Georges Martin, and David N. Seidman: Nat. Mater., 2007, vol. 6, pp. 210–16.
[325]W. Song, J. Von Appen, P. Choi, R. Dronskowski, D. Raabe, and W. Bleck: Acta Mater., 2013, vol. 61, pp. 7582–90.
[326]D G Brandon: Philos. Mag., 1966, vol. 14, pp. 803–20.
[327]J A Liddle, A G Norman, A Cerezo, and C. R.M. Grovenor: Appl. Phys. Lett., 1989, vol. 54, pp. 1555–57.
[328]D Blavette, B Deconihout, A Bostel, J M Sarrau, M Bouet, and A Menand: Rev. Sci. Instrum., 1993, vol. 64, pp. 2911–19.
T.F. Kelly, T.T. Gribb, J.D. Olson, R.L. Martens, J.D. Shepard, S.A. Wiener, T.C. Kunicki, R.M. Ulfig, D.R. Lenz, E.M. Strennen, E. Oltman, J. H. Bunton, and D. R. Strait: Microsc. Microanal., 2004, 10, pp. 373–83.
[330]G Da Costa, F Vurpillot, A Bostel, M Bouet, and B Deconihout: Rev. Sci. Instrum., 2005, vol. 76, p. 013304.
[331]H N Southworth and J M Walls: Surf. Sci., 1978, vol. 75, pp. 129–40.
[332]Erwin W. Müller, John A. Panitz, and S. Brooks McLane: Rev. Sci. Instrum., 1968, vol. 39, pp. 83–86.
[333]G L Kellogg and T T Tsong: J. Appl. Phys., 1980, vol. 51, pp. 1184–93.
[334]B Gault, F Vurpillot, A. Vella, M. Gilbert, A Menand, D Blavette, and B Deconihout: Rev. Sci. Instrum., 2006, vol. 77, p. 43705.
J. H. Bunton, J.D. Olson, D.R. Lenz, and T.F. Kelly: in Microsc. Microanal., 2007, 13, pp. 418–27.
[336]P Bas, A Bostel, B Deconihout, and D Blavette: Appl. Surf. Sci., 1995, vol. 87–88, pp. 298–304.
F. Vurpillot, B. Gault, B. P. Geiser, and D.J. Larson: Ultramicroscopy, 2013, vol. 132, pp. 19–30.
[338]K Hono, T Ohkubo, Y M Chen, M Kodzuka, K Oh-ishi, H Sepehri-Amin, F. Lia, T Kinno, S Tomiya, and Y Kanitani: Ultramicroscopy, 2011, vol. 111, pp. 576–83.
[339]D. J. Larson, B. Gault, B. P. Geiser, F. De Geuser, and F. Vurpillot: Curr. Opin. Solid State Mater. Sci., 2013, vol. 17, pp. 236–47.
[340]Emmanuelle A. Marquis and Jonathan M. Hyde: Mater. Sci. Eng. R Reports, 2010, vol. 69, pp. 37–62.
Y. Wei, B. Gault, R. S. Varanasi, D. Raabe, M. Herbig, and A.J. Breen: Ultramicroscopy, 2018, vol. 194, pp. 15–24.
[342]D J Larson, D T Foord, A K Petford-Long, T C Anthony, I M Rozdilsky, A Cerezo, and G. W.D. Smith: Ultramicroscopy, 1998, vol. 75, pp. 147–59.
[343]Ty J. Prosa and David J. Larson: Microsc. Microanal., 2017, vol. 23, pp. 194–209.
[344]B Gault, A Menand, F De Geuser, B Deconihout, and R Danoix: Appl. Phys. Lett., 2006, vol. 88, p. 114101.
[345]D. W. Saxey, D. E. Moser, S. Piazolo, S. M. Reddy, and J. W. Valley: Scripta Mater., 2018, vol. 148, pp. 115–21.
L. M. Gordon, L. Tran, and D. Joester: ACS Nano, 2012, vol. 6, pp. 10667–75.
D.E. Perea, J. Liu, J. Bartrand, Q. Dicken, S.T. Thevuthasan, N.D. Browning, and J.E. Evans: Sci. Rep., 2016, vol. 6, pp. 1–9.
T.J. Prosa, S. Strennen, D. Olson, D. Lawrence, and D.J. Larson: Microsc. Microanal., 2019, vol. 25, pp. 425–37.
[349]S. K. Makineni, M. Lenz, P. Kontis, Z. Li, A. Kumar, P. J. Felfer, S. Neumeier, M. Herbig, E. Spiecker, D. Raabe, and B. Gault: JOM, 2018, vol. 70, pp. 1736–43.
P. J. Felfer, T. Alam, S.P. Ringer, and J.M. Cairney: Microsc. Res. Tech., 2012, vol. 75, pp. 484–91.
[351]M. Herbig: Scripta Mater., 2018, vol. 148, pp. 98–105.
S.I. Baik, X. Yin, and D.N. Seidman: Scripta Mater., 2013, vol. 68, pp. 909–12.
S.I. Baik, D. Isheim, and D.N. Seidma: Ultramicroscopy, 2018, vol. 184, pp. 284–92.
[354]Katja Eder, Ingrid McCarroll, Alexandre La Fontaine, and Julie M. Cairney: JOM, 2018, vol. 70, pp. 1744–51.
[355]Christian H. Liebscher, Andreas Stoffers, Masud Alam, Liverios Lymperakis, Oana Cojocaru-Mirédin, Baptiste Gault, Jörg Neugebauer, Gerhard Dehm, Christina Scheu, and Dierk Raabe: Phys. Rev. Lett., 2018, vol. 121, pp. 1–5.
M. Kuzmina, M. Herbig, D. Ponge, S. Sandlöbes, and D. Raabe: Science, 2015, vol. 349, pp. 1080–83.
[357]D. Haley, S. V. Merzlikin, P. Choi, and D. Raabe: Int. J. Hydrogen Energy, 2014, vol. 39, pp. 12221–29.
[358]A. J. Breen, I. Mouton, W. Lu, S. Wang, A. Szczepaniak, P. Kontis, L.T. T. Stephenson, Y. Chang, A. K. da Silva, C. H. Liebscher, D. Raabe, T. B. Britton, M. Herbig, and B. Gault: Scripta Mater., 2018, vol. 156, pp. 42–46.
Y.H. Chang, I. Mouton, L. Stephenson, M. Ashton, G.K. Zhang, A. Szczpaniak, W.J. Lu, D. Ponge, D. Raabe, and B. Gault: New J. Phys., 2019, vol. 21, p. 053025–41.
[360]D. K. Schreiber, D. E. Perea, J. V. Ryan, J. E. Evans, and J. D. Vienna: Ultramicroscopy, 2018, vol. 194, pp. 89–99.
L.T. Stephenson, A. Szczepaniak, I. Mouton, K.A.K. Rusitzka, A.J. Breen, U. Tezins, A. Sturm, D. Vogel, Y. Chang, P. Kontis, A. Rosenthal, J.D. Shepard, U. Maier, T.F. Kelly, D. Raabe, and B. Gault: PLoS ONE, 2018, vol. 13, p. e0209211.
[362]E W Müller: Science, 1965, vol. 149, pp. 591–601.
[363]E W Müller and K Bahadur: J. Appl. Phys., 1956, vol. 27, pp. 474–76.
C.Y. Wei, M.I. Current, and D.N. Seidman: Philos. Mag., 1981, vol. 44, pp. 459–91.
[365]S S Brenner and D N Seidman: Radiat. Eff., 1975, vol. 24, pp. 73–78.
[366]M A Fortes and B Ralph: Philos. Mag., 1969, vol. 19, pp. 181–87.
[367]M A Fortes and D A Smith: J. Appl. Phys., 1970, vol. 41, pp. 2348–59.
[368]J. A. Panitz: J. Phys. E., 1982, vol. 15, pp. 1281–94.
[369]P. Haasen and R. Wagner: Annu. Rev. Mater. Sci., 2003, vol. 15, pp. 43–78.
[370]M K Miller and G D W Smith: Met. Sci., 1977, vol. 11, pp. 249–53.
[371]T F Kelly, D J Larson, M K Miller, and J E Flinn: Mater. Sci. Eng. A, 1999, vol. 270, pp. 19–26.
[372]F. Danoix, R Danoix, J Akre, A Grellier, and D Delagnes: J. Microsc., 2011, vol. 244, pp. 305–10.
[373]M K Miller and S S Brenner: Res Mech. Int. J. Struct. Mech. Mater. Sci., 1984, vol. 10, pp. 161–68.
[374]Francois Vurpillot, Frédéric Danoix, Matthieu Gilbert, Sebastian Koelling, Michal Dagan, and David N. Seidman: Microsc. Microanal., 2017, vol. 23, pp. 210–20.
F. Vurpillot, M. Gilbert, and B. Deconihout: Surf. Interface Anal., 2007, vol. 39, pp. 273–77.
M. Dagan, B. Gault, G.D.W. Smith, P.A.J. Bagot, and M.P Moody: Microsc. Microanal., 2017, vol. 23, pp. 255–68.
S. Katnagallu, M. Dagan, S. Parviainen, A. Nematollahi, B. Grabowski, P.A.J. Bagot, N. Rolland, J. Neugebauer, D. Raabe, F. Vurpillot, M.P. Moody, and B. Gault: J. Phys. D. Appl. Phys., 2018, vol. 51, pp. 105601–11.
M. Dagan, L.R. Hanna, A. Xu, S.G. Roberts, G.D. Smith, B. Gault, P.D. Philip, D.P. Edmondson, P.A.J. Bagot, and M.P. Moody: Ultramicroscopy, 2015, vol. 159, pp. 387–94.
S. Katnagallu, L.T. Stephenson, I. Mouton, C. Freysoldt, R. Drautz, J. Neugebauer, F. Vurpillot, and D. Raabe: ArXiv E-Prints, 2019, pp. 1–18.
[380]Shyam Katnagallu, Baptiste Gault, Blazej Grabowski, Jörg Neugebauer, Dierk Raabe, and Ali Nematollahi: Mater. Charact., 2018, vol. 146, pp. 307–18.
[381]J. Akré, F Danoix, H Leitner, and P Auger: Ultramicroscopy, 2009, vol. 109, pp. 518–23.
[382]N. Peranio, Y. J. Li, F. Roters, and D. Raabe: Mater. Sci. Eng. A, 2010, vol. 527, pp. 4161–68.
[383]M. Diehl, D. An, P. Shanthraj, S. Zaefferer, F. Roters, and D. Raabe: Phys. Mesomech., 2017, vol. 20, pp. 311–23.
[384]L. Schemmann, S. Zaefferer, D. Raabe, F. Friedel, and D. Mattissen: Acta Mater., 2015, vol. 95, pp. 386–98.
[385]T. B. Britton and A. J. Wilkinson: Ultramicroscopy, 2011, vol. 111, pp. 1395–1404.
[386]T. B. Britton and A. J. Wilkinson: Ultramicroscopy, 2012, vol. 114, pp. 82–95.
D.C. Joy, D.E. Newbury, and D.L. Davidson: J. Appl. Phys., 1982, vol. 53, pp. R81–R122.
A.J. Wilkinson and P.B. Hirsch: Micron, 1997, vol. 28, pp. 279–308.
[389]B. A. Simkin and M. A. Crimp: Ultramicroscopy, 1999, vol. 77, pp. 65–75.
[390]Stefan Zaefferer and Nahid Nora Elhami: Acta Mater., 2014, vol. 75, pp. 20–50.
R.J. Kamaladasa and Y.N. Picard: in Microscopy: Science, Technology, Applications and Education, A. Méndez-Vilas and J. Díaz, eds., 2010, pp. 1583–90.
[392]H. Mansour, J. Guyon, M. A. Crimp, N. Gey, B. Beausir, and N. Maloufi: Scripta Mater., 2014, vol. 84–85, pp. 11–14.
[393]J. L. Zhang, S. Zaefferer, and D. Raabe: Mater. Sci. Eng. A, 2015, vol. 636, pp. 231–42.
[394]Dayong An and Stefan Zaefferer: Int. J. Plast., 2019, vol. 121, pp. 244–60.
[395]P. J. Konijnenberg, S. Zaefferer, and D. Raabe: Acta Mater., 2015, vol. 99, pp. 402–14.
[396]Masayuki Kamaya: Ultramicroscopy, 2011, vol. 111, pp. 1189–99.
D. P. Field, C. C. Merriman, N. Allain-Bonasso, and F. Wagner: Model. Simul. Mater. Sci. Eng., 2012, vol. 20, pp. 024007–19.
[398]Matjaž Godec, Stefan Zaefferer, Bojan Podgornik, Mario Šinko, and Elena Tchernychova: Mater. Charact., 2020, vol. 160, p. 1583.
R.R. Shen and P. Efsing: Ultramicroscopy, 2018, vol. 184, pp. 156–63.
[400]R. A. Dunlap, D. A. Small, D. D. MacNeil, M. N. Obrovac, and J. R. Dahn: J. Alloys Compd., 1999, vol. 289, pp. 135–42.
[401]A. J. Wilkinson, G. Meaden, and D. J. Dingley: Mater. Sci. Technol., 2006, vol. 22, pp. 1271–78.
[402]L. Zhao, N. H. Van Dijk, E. Brück, J. Sietsma, and S. Van Der Zwaag: Mater. Sci. Eng. A, 2001, vol. 313, pp. 145–52.
I. R. S. Filho, M.J.R. Sandim, R. Cohen, L.C.C.M. Nagamine, H. R.Z. Sandim, and D. Raabe: J. Magn. Magn. Mater., 2019, vol. 473, pp. 109–18.
A. Perlade, A. Antoni, R. Besson, D. Caillard, M. Callahan, J. Emo, A. F. Gourgues, P. Maugis, A. Mestrallet, L. Thuinet, Q. Tonizzo, and J. H. Schmitt: Mater. Sci. Technol., 2019, vol. 35, pp. 204–19.
M. Callahan, O. Hubert, F. Hild, A. Perlade, and J.H. Schmitt: Mater. Sci. Eng. A, 2017, vol. 704, pp. 391–400.
L. Zhao, N.H. VanDijk, A. J.E. Lefering, and J. Sietsma: J. Mater. Sci., 2013, vol. 48, pp. 1474–79.
[407]Biao Ma, Changsheng Li, Yahui Han, and Jikai Wang: J. Magn. Magn. Mater., 2016, vol. 419, pp. 249–54.
J.N. Mohapatra and A.K. Akela: J. Nondestruct. Eval., 2019, vol. 38, pp. 21–28.
H. Y. Yu: Mater. Sci., 1997, vol. 28, pp. 2499–2506.
[410]E. Jimenez-Melero, N. H. van Dijk, L. Zhao, J. Sietsma, S. E. Offerman, J. P. Wright, and S. van der Zwaag: Acta Mater., 2007, vol. 55, pp. 6713–23.
[411]R. Blondé, E. Jimenez-Melero, L. Zhao, J. P. Wright, E. Brück, S. Van Der Zwaag, and N. H. Van Dijk: Acta Mater., 2012, vol. 60, pp. 565–77.
[412]N. Jia, Z. H. Cong, X. Sun, S. Cheng, Z. H. Nie, Y. Ren, P. K. Liaw, and Y. D. Wang: Acta Mater., 2009, vol. 57, pp. 3965–77.
M. Zhang, L. Li, J. Ding, Q. Wu, Y. D. Wang, J. Almer, F. Guo, and Y. Ren: Acta Mater., 2017, vol. 141, pp. 294–303.
K. Yan, D. G. Carr, M. D. Callaghan, K. D. Liss, and H. Li: Scripta Mater., 2010, vol. 62, pp. 246–49.
[415]J. Lorthios, F. Nguyen, A. F. Gourgues, T. F. Morgeneyer, and P. Cugy: Scripta Mater., 2010, vol. 63, pp. 1220–23.
[416]M. Kahziz, T. F. Morgeneyer, M. Mazière, L. Helfen, O. Bouaziz, and E. Maire: Exp. Mech., 2016, vol. 56, pp. 177–95.
[417]A. Khorashadizadeh, D. Raabe, S. Zaefferer, G. S. Rohrer, A. D. Rollett, and M. Winning: Adv. Eng. Mater., 2011, vol. 13, pp. 237–44.
A. Bastos, S. Zaefferer, and D. Raabe: J. Microsc., 2008, vol. 230, pp. 487–98.
N. Viganò, A. Tanguy, S. Hallais, A. Dimanov, M. Bornert, K.J. Batenburg, and W. Ludwig: Sci. Rep., 2016, vol. 6, pp. 20618–27.
N. Viganò, W. Ludwig, and K.J. Batenburg: J. Appl. Crystallogr., 2014, vol. 47, pp. 1826–40.
N. A. Henningsson, S. A. Hall, J. P. Wright, and J. Hektor: J. Appl. Crystallogr., 2020, vol. 53, pp. 314–25.
Y. Hayashi, D. Setoyama, Y. Hirose, T. Yoshida, and H. Kimura: Science, 2019, vol. 366, pp. 1492–96.
S. Chen, R. Rana, A. Haldar, and R. K. Ray: Prog. Mater. Sci., 2017, vol. 89, pp. 345–91.
[424]F G Caballero and H K D H Bhadeshia: Curr. Opin. Solid State Mater. Sci., 2004, vol. 8, pp. 216–216.
H. Matsuda and H. K.D.H. Bhadeshia: Proc. R. Soc., 2004, vol. 460, pp. 1707–22.
[426]L. Storojeva, D. Ponge, R. Kaspar, and D. Raabe: Acta Mater., 2004, vol. 52, pp. 2209–20.
[427]S. Morito, H. Tanaka, R. Konishi, T. Furuhara, and T. Maki: Acta Mater., 2003, vol. 51, pp. 1789–99.
[428]T. Furuhara, H. Kawata, S. Morito, and T. Maki: Mater. Sci. Eng. A, 2006, vol. 431, pp. 228–36.
[429]S. Morito, X. Huang, T. Furuhara, T. Maki, and N. Hansen: Acta Mater., 2006, vol. 54, pp. 5323–31.
[430]O. Grässel, L. Krüger, G. Frommeyer, and L. W. Meyer: Int. J. Plast., 2000, vol. 16, pp. 1391–1409.
[431]Takeshi Iwamoto and Toshio Tsuta: Key Eng. Mater., 2009, vol. 274–276, pp. 679–84.
[432]A. Laureys, T. Depover, R. Petrov, and K. Verbeken: Mater. Charact., 2016, vol. 112, pp. 169–79.
[433]S. Allain, J. P. Chateau, D. Dahmoun, and O. Bouaziz: Mater. Sci. Eng. A, 2004, vol. 387–389, pp. 272–76.
W.S. Choi, S. Sandlöbes, N. V. Malyar, C. Kirchlechner, S. Korte-Kerzel, G. Dehm, B.C. DeCooman, and D. Raabe: Acta Mater., 2017, vol. 132, pp. 162–73.
O.C. Zienkiewicz: Finite Elem. Method Solid Struct. Mech., 2014, p. iii.
[436]J. C. Michel, H. Moulinec, and P. Suquet: Int. J. Numer. Methods Eng., 2002, vol. 52, pp. 139–60.
[437]J. C. Michel, H. Moulinec, and P. Suquet: Comput. Methods Appl. Mech. Eng., 1999, vol. 172, pp. 109–43.
F. Willot, B. Abdallah, and Y. P. Pellegrini: Int. J. Numer. Methods Eng., 2014, vol. 98, pp. 518–33.
[439]Matti Schneider, Felix Ospald, and Matthias Kabel: Int. J. Numer. Methods Eng., 2016, vol. 105, pp. 693–720.
[440]B. Karlsson and B. O. Sundström: Mater. Sci. Eng., 1974, vol. 16, pp. 161–68.
[441]J. Kadkhodapour, A. Butz, S. Ziaei-Rad, and S. Schmauder: Int. J. Plast., 2011, vol. 27, pp. 1103–25.
[442]Maximilien Libert, Colette Rey, Ludovic Vincent, and Bernard Marini: Int. J. Solids Struct., 2011, vol. 48, pp. 2196–2208.
[443]Noriki Fujita, Nobuyuki Ishikawa, Franz Roters, C.C. Tasan, and Dierk Raabe: Int. J. Plast., 2018, vol. 104, pp. 39–53.
[444]T. W.J. de Geus, F. Maresca, R. H.J. Peerlings, and M. G.D. Geers: Mech. Mater., 2016, vol. 101, pp. 147–59.
J.P. Boyd: Chebyshev and Fourier Spectral Methods: Second Revised Edition, 2011.
[446]McLean P. Echlin, Marcus Straw, Steven Randolph, Jorge Filevich, and Tresa M. Pollock: Mater. Charact., 2015, vol. 100, pp. 1–12.
[447]D. Raabe, M. Sachtleber, Z. Zhao, F. Roters, and S. Zaefferer: Acta Mater., 2001, vol. 49, pp. 3433–41.
[448]M. Sachtleber, Z. Zhao, and D. Raabe: Mater. Sci. Eng. A, 2002, vol. 336, pp. 81–87.
[449]Z. Zhao, M. Ramesh, D. Raabe, A. M. Cuitiño, and R. Radovitzky: Int. J. Plast., 2008, vol. 24, pp. 2278–97.
[450]C. Liu, P. Shanthraj, M. Diehl, F. Roters, S. Dong, J. Dong, W. Ding, and D. Raabe: Int. J. Plast., 2018, vol. 106, pp. 203–27.
R. D. Kamachali, C. Schwarze, M. Lin, M. Diehl, P. Shanthraj, U. Prahl, I. Steinbach, and D. Raabe: Comput. Mater. Sci., 2018, vol. 155, pp. 541–53.
[452]Martin Diehl, Marcel Wicke, Pratheek Shanthraj, Franz Roters, Angelika Brueckner-Foit, and Dierk Raabe: JOM, 2017, vol. 69, pp. 872–78.
[453]F. Roters, M. Diehl, P. Shanthraj, P. Eisenlohr, C. Reuber, S. L. Wong, T. Maiti, A. Ebrahimi, T. Hochrainer, H. O. Fabritius, S. Nikolov, M. Friák, N. Fujita, N. Grilli, K. G.F. Janssens, N. Jia, P. J.J. Kok, D. Ma, F. Meier, E. Werner, M. Stricker, D. Weygand, and D. Raabe: Comput. Mater. Sci., 2019, vol. 158, pp. 420–78.
D. D. Tjahjanto, P. Eisenlohr, and F. Roters: Model. Simul. Mater. Sci. Eng., 2015, vol. 23, pp. 045005–22.
[455]V. Uthaisangsuk, U. Prahl, and W. Bleck: Comput. Mater. Sci., 2008, vol. 43, pp. 43-50.
[456]N. Zaafarani, D. Raabe, F. Roters, and S. Zaefferer: Acta Mater., 2008, vol. 56, pp. 31–42.
[457]J. Konrad, S. Zaefferer, and D. Raabe: Acta Mater., 2006, vol. 54, pp. 1369–80.
A. Zeghadi, S. Forest, A.F. Gourgues, and O. Bouaziz: Philos. Mag., 2007, vol. 87, pp. 1425–46.
[459]Martin Diehl, Michael Groeber, Christian Haase, Dmitri A. Molodov, Franz Roters, and Dierk Raabe: JOM, 2017, vol. 69, pp. 848–55.
S. Bargmann, B. Klusemann, J. Markmann, J.E. Schnabel, K. Schneider, C. Soyarslan, and J. Wilmers: Prog. Mater. Sci., 2018, vol. 96, pp. 322–84.
P.J.J. Kok, W. Spanjer, and H. Vegter: Key Eng. Mater., 2015, vols. 651–653, pp. 975–80.
[462]N. Osipov, A. F. Gourgues-Lorenzon, B. Marini, V. Mounoury, F. Nguyen, and G. Cailletaud: Philos. Mag., 2008, vol. 88, pp. 3757–77.
[463]Surya R. Kalidindi, Massimiliano Binci, David Fullwood, and Brent L. Adams: Acta Mater., 2006, vol. 54, pp. 3117–26.
H.J. Bong, H. Lim, M.G. Lee, D.T. Fullwood, E.R. Homer, and R. H. Wagoner: Mater. Sci. Eng. A, 2017, vol. 695, pp. 101–11.
J.H. Kim, M.G. Lee, and R. H. Wagoner: Comput. Mater. Sci., 2010, vol. 47, pp. 785–95.
V. Uthaisangsuk, U. Prahl, and W. Bleck: Procedia Eng., 2009, vol. 1, pp. 171–76.
V. Uthaisangsuk, U. Prahl, and W. Bleck: Int. J. Fract., 2009, vol. 157, pp. 55–69.
N.H. Abid, R.K. A. Al-Rub, and A. N. Palazotto: Int. J. Solids Struct., 2017, vol. 104–105, pp. 8–24.
[469]Philip Eisenlohr and Franz Roters: Comput. Mater. Sci., 2008, vol. 42, pp. 670–78.
M. Diehl, D. Wang, C. Liu, J.R. Mianroodi, F. Han, D. Ma, P.J.J. Kok, F. Roters, and P. Shanthraj: Adv. Eng. Mater., 2020, vol. 22, p. 1901044.
A.D. Rollett, D.M. Saylor, J. Fridy, B.S. El-Dasher, A. Brahme, S.-B. Lee, C. Cornwell, and R Noack: NUMIFORM 2004, 2004.
[472]Sudipto Mandal, Jacky Lao, Sean Donegan, and Anthony D. Rollett: Scripta Mater., 2018, vol. 146, pp. 128–32.
A. Brahme, D.M. Saylor, J.Fridy, and A.D. Rollett: Metall. Model. Alum. Alloy. - Proc. from Mater. Solut. Conf. 2003 1st Int. Symp. Metall. Model. Alum. Alloy., 2003, pp. 163–68.
[474]D. Raabe, P. Klose, B. Engl, K. P. Imlau, F. Friedel, and F. Roters: Adv. Eng. Mater., 2002, vol. 4, pp. 169–80.
[475]Dierk Raabe and Franz Roters: Int. J. Plast., 2004, vol. 20, pp. 339–61.
F. Roters, P. Eisenlohr, T.R. Bieler, and D. Raabe: Crystal Plasticity Finite Element Methods: In Materials Science and Engineering, 2010.
D. Kumar, T.R. Bieler, P. Eisenlohr, D.E. Mason, M.A. Crimp, F. Roters, and D. Raabe: J. Eng. Mater. Technol. Trans. ASME, 2008, vol. 130, pp. 0210121–212.
[478]F. Roters, P. Eisenlohr, L. Hantcherli, D. D. Tjahjanto, T. R. Bieler, and D. Raabe: Acta Mater., 2010, vol. 58, pp. 1152–1211.
[479]D. T. Pierce, J. A. Jiménez, J. Bentley, D. Raabe, and J. E. Wittig: Acta Mater., 2015, vol. 100, pp. 178–90.
[480]David L. McDowell: Mater. Sci. Eng. R Reports, 2008, vol. 62, pp. 67–123.
[481]Michael Schick, Bengt Hallstedt, Albert Glensk, Blazej Grabowski, Tilmann Hickel, Milan Hampl, Joachim Gröbner, Jörg Neugebauer, and Rainer Schmid-Fetzer: Calphad Comput. Coupling Phase Diagrams Thermochem., 2012, vol. 37, pp. 77–86.
J. Neugebauer and T. Hickel: Wiley Interdiscip. Rev. Comput. Mol. Sci., 2013.
[483]A. Sato, K. Soma, and T. Mori: Acta Metall., 1982, vol. 30, pp. 1901–7.
O. Grässel, G. Frommeyer, C. Derder, and H. Hofmann: J. Phys. IV JP, 1997, vol. 7.
[485]Dierk Raabe, Franz Roters, Jörg Neugebauer, Ivan Gutierrez-Urrutia, Tilmann Hickel, Wolfgang Bleck, Jochen M. Schneider, James E. Wittig, and Joachim Mayer: MRS Bull., 2016, vol. 41, pp. 320–25.
M. Madivala, A. Schwedt, S. L. Wong, F. Roters, U. Prahl, and W. Bleck: Int. J. Plast., 2018, vol. 104, pp. 80–103.
W. Song, T. Ingendahl, and W. Bleck: Acta Metall. Sin. (English Lett.), 2014.
[488]Motomichi Koyama, Asif Bashir, Michael Rohwerder, Sergiy V. Merzlikin, Eiji Akiyama, Kaneaki Tsuzaki, and Dierk Raabe: J. Electrochem. Soc., 2015, vol. 162, pp. C638–47.
[489]Motomichi Koyama, Eiji Akiyama, Takahiro Sawaguchi, Dierk Raabe, and Kaneaki Tsuzaki: Scripta Mater., 2012, vol. 66, pp. 459–62.
[490]F. Marketz and F. D. Fischer: Model. Simul. Mater. Sci. Eng., 1994, vol. 2, pp. 1017–46.
[491]Akinori Yamanaka, Tomohiro Takaki, and Yoshihiro Tomita: ISIJ Int., 2012, vol. 52, pp. 659–68.
[492]M. Cherkaoui, A. Soulami, A. Zeghloul, and M. A. Khaleel: Philos. Mag., 2008, vol. 88, pp. 3479–3512.
[493]Rolf Mahnken and Andreas Schneidt: Arch. Appl. Mech., 2010, vol. 80, pp. 229–53.
V.I. Levitas, A. Idesman, G. B. Olson, and E. Stein: Philos. Mag, 2002, vol. 82, pp. 429–62.
[495]S. Turteltaub and A. S.J. Suiker: Int. J. Solids Struct., 2006, vol. 43, pp. 4509–45.
[496]S. Turteltaub and A. S.J. Suiker: J. Mech. Phys. Solids, 2005, vol. 53, pp. 1747–88.
A.S.J. Suiker and S. Turteltaub: Int. J. Numer. Methods Eng., 2005, vol. 63, pp. 1655–93.
[498]D. D. Tjahjanto, S. Turteltaub, and A. S.J. Suiker: Contin. Mech. Thermodyn., 2008, vol. 19, pp. 399–422.
D.D. Tjahjanto, A.S.J. Suiker, S. Turteltaub, and S. Van Der Zwaag: Comput. Mater. Sci., 2011, pp. 1490–98.
[500]David R. Steinmetz, Tom Jäpel, Burkhard Wietbrock, Philip Eisenlohr, Ivan Gutierrez-Urrutia, Alireza Saeed-Akbari, Tilmann Hickel, Franz Roters, and Dierk Raabe: Acta Mater., 2013, vol. 61, pp. 494–510.
S. L. Wong, M. Madivala, U. Prahl, F. Roters, and D. Raabe: Acta Mater., 2016, vol. 118, pp. 140–51.
[502]Ankit Srivastava, Hassan Ghassemi-Armaki, Hyokyung Sung, Peng Chen, Sharvan Kumar, and Allan F. Bower: J. Mech. Phys. Solids, 2015, vol. 78, pp. 46–69.
[503]D. P. Mika and P. R. Dawson: Acta Mater., 1999, vol. 47, pp. 1355–69.
[504]A. J. Beaudoin, P. R. Dawson, K. K. Mathur, U. F. Kocks, and D. A. Korzekwa: Comput. Methods Appl. Mech. Eng., 1994, vol. 117, pp. 49–70.
[505]G. Dehm, B. N. Jaya, R. Raghavan, and C. Kirchlechner: Acta Mater., 2018, vol. 142, pp. 248–82.
[506]Claudio Zambaldi, Yiyi Yang, Thomas R. Bieler, and Dierk Raabe: J. Mater. Res., 2012, vol. 27, pp. 356–67.
[507]C. Zambaldi and D. Raabe: Acta Mater., 2010, vol. 58, pp. 3516–30.
[508]C. Zambaldi, F. Roters, and D. Raabe: Intermetallics, 2011, vol. 19, pp. 820–27.
[509]Aritra Chakraborty and Philip Eisenlohr: Eur. J. Mech. A/Solids, 2017, vol. 66, pp. 114–24.
[510]Peng Chen, Hassan Ghassemi-Armaki, Sharvan Kumar, Allan Bower, Shrikant Bhat, and Sriram Sadagopan: Acta Mater., 2014, vol. 65, pp. 133–49.
K. Sedighiani, M. Diehl, K. Traka, F. Roters, J. Sietsma, and D. Raabe: Int. J. Plast., 2020, vol. 134, pp. 102779–807.
D.E. Goldberg and J.H. Holland: Mach. Learn., 1988, vol. 3, pp. 95–99.
P. Shanthraj, M. Diehl, P. Eisenlohr, F. Roters, and D. Raabe: in Handbook of Mechanics of Materials, C.-H. Hsueh et al., eds., Springer, Singapore, 2019, pp. 1347–72.
K. Sedighiani, M. Diehl, F. Roters, J. Sietsma, and D. Raabe: International Conference on Plasticity, Damage, and Fracture, Panama City, Panama, Proceedings, 2019, vol. 1, pp. 1–7.
D. Helm, A. Butz, D. Raabe, and P. Gumbsch: Proc. 1st World Congr. Integr. Comput. Mater. Eng. ICME, 2011, pp. 89–98.
P. VanHoutte, A. K. Kanjarla, A. VanBael, M. Seefeldt, and L. Delannay: Eur. J. Mech. A Solids, 2006, vol. 25, pp. 634–48.
D.D. Tjahjanto, P. Eisenlohr, and F. Roters: Model. Simul. Mater. Sci. Eng., 2010, vol. 18, pp. 015006–27.
[518]D. D. Tjahjanto, P. Eisenlohr, and F. Roters: Int. J. Mater. Form., 2009, vol. 2, pp. 939–42.
[519]Dominik Brands, Jörg Schröder, Daniel Balzani, Olga Dmitrieva, and Dierk Raabe: PAMM, 2011, vol. 11, pp. 503–04.
[520]Günter Gottstein and Dierk Raabe: Curr. Opin. Solid State Mater. Sci., 1998, vol. 3, pp. 264–68.
[521]Dierk Raabe and Richard C. Becker: Model. Simul. Mater. Sci. Eng., 2000, vol. 8, pp. 445–62.
B. Zhu and M. Militzer: Mater. Sci., 2015, vol. 46, pp. 1073–84.
M. Militzer, W.J. Poole, and M.A. Wells: Mater. Sci. Technol., 2003, vol. 19, pp. 1361–68.
H. Grong and R. Shercliff: Prog. Mater. Sci., 2002, vol. 47, pp. 163–282.
[525]Nina Fonstein: Advanced High Strength Sheet Steels: Physical Metallurgy, Design, Processing, and Properties, Springer International Publishing, Switzerland, 2015.
L. Storojeva, D. Ponge, D. Raabe, and R. Kaspar: Zeitschrift Fuer, 2004, vol. 95, pp. 1108–14.
[527]R. Song, D. Ponge, D. Raabe, and R. Kaspar: Acta Mater., 2005, vol. 53, pp. 845–58.
[528]R Kuziak, R Kawalla, and S Waengler: Arch. Civ. Mech. Eng., 2008, vol. 8, pp. 103–17.
L. Rauch, K. Bzowski, G. Uranga, J. Isasti, and J. Kitowski: Metals (Basel)., 2019, vol. 9, p. 737.
[530]S X Zhou: J. Mater. Process. Technol., 2003, vol. 134, pp. 338–51.
[531]I. Tikhovskiy, D. Raabe, and F. Roters: Scripta Mater., 2006, vol. 54, pp. 1537–42.
J.G. Hu, J.J. Jonas, and T. Ishikawa: Mater. Sci. Eng. A, 2002, vol. 256, pp. 51–59.
H. C. Pi, J. T. Han, A. K. Tieu, and Z. Y. Jiang: Key Eng. Mater., 2009, vol. 274–276, pp. 637–42.
[534]Shiro Kobayashi, Soo-ik Oh, Taylan Altan, and Anil Chaudhary: J. Mater. Shap. Technol., 1990, vol. 8, pp. 65–65.
M. Krzyzanowski and J. H. Beynon: ISIJ Int., 2006, vol. 46, pp. 1533–47.
[536]D. Raabe: J. Strain Anal. Eng. Des., 2007, vol. 42, pp. 253–68.
[537]P. Shanthraj, B. Svendsen, L. Sharma, F. Roters, and D. Raabe: J. Mech. Phys. Solids, 2017, vol. 99, pp. 19–34.
[538]P. Shanthraj, L. Sharma, B. Svendsen, F. Roters, and D. Raabe: Comput. Methods Appl. Mech. Eng., 2016, vol. 312, pp. 167–85.
[539]Bob Svendsen, Pratheek Shanthraj, and Dierk Raabe: J. Mech. Phys. Solids, 2018, vol. 112, pp. 619–36.
[540]Chengwu Zheng, Dierk Raabe, and Dianzhong Li: Acta Mater., 2012, vol. 60, pp. 4768–79.
[541]Chengwu Zheng and Dierk Raabe: Acta Mater., 2013, vol. 61, pp. 5504–17.
[542]Dierk Raabe: Annu. Rev. Mater. Sci., 2002, vol. 32, pp. 53–76.
[543]William Lahoz, Boris Khattatov, and Richard Ménard: Data Assimilation: Making Sense of Observations, Springer-Verlag Berlin Heidelberg GmbH, 2010.
A. Agrawal, P. D. Deshpande, A. Cecen, G.P. Basavarsu, A.N. Choudhary, and S.R. Kalidindi: Integr. Mater., 2014, vol. 3, pp. 90–108.
S.M. Azimi, D. Britz, M. Engstler, M. Fritz, and F. Mücklich: Sci. Rep., 2018, vol. 8, pp. 2128–42.
[546]D D Gu, W Meiners, K Wissenbach, & R Poprawe, and R Poprawe: Int. Mater. Rev., 2017, vol. 57, pp. 133–64.
[547]T. DebRoy, H. L. Wei, J. S. Zuback, T. Mukherjee, J. W. Elmer, J. O. Milewski, A. M. Beese, A. Wilson-Heid, A. De, and W. Zhang: Prog. Mater. Sci., 2018, vol. 92, pp. 112–224.
[548]Dirk Herzog, Vanessa Seyda, Eric Wycisk, and Claus Emmelmann: Acta Mater., 2016, vol. 117, pp. 371–92.
[549]Philipp Kürnsteiner, Markus B. Wilms, Andreas Weisheit, Pere Barriobero-Vila, Eric A. Jägle, and Dierk Raabe: Acta Mater., 2017, vol. 129, pp. 52–60.
[550]Jan Haubrich, Joachim Gussone, Pere Barriobero-Vila, Philipp Kürnsteiner, Eric A. Jägle, Dierk Raabe, Norbert Schell, and Guillermo Requena: Acta Mater., 2019, vol. 167, pp. 136–48.
[551]P. Krakhmalev, I. Yadroitsava, G. Fredriksson, and I. Yadroitsev: Mater. Des., 2015, vol. 87, pp. 380–85.
P. Kürnsteiner, M. B. Wilms, A. Weisheit, B. Gault, E. A. Jägle, and D. Raabe: Nature, 2020, vol. 582, pp. 515–19.
E.A. Jägle, Z. Sheng, P. Kürnsteiner, S. Ocylok, A. Weisheit, and D. Raabe: Materials (Basel), 2017, vol. 10, pp. 1–15.
[554]Fabian Kies, Patrick Köhnen, Markus B. Wilms, Frederike Brasche, Konda G. Pradeep, Alexander Schwedt, Silvia Richter, Andreas Weisheit, Johannes H. Schleifenbaum, and Christian Haase: Mater. Des., 2018, vol. 160, pp. 1250–64.
P. Kürnsteiner, M. B. Wilms, A. Weisheit, P. Barriobero-Vila, B. Gault, E.A. Jägle, and D. Raabe: Microsc. Microanal., 2017, vol. 23, pp. 694–95.
[556]H. Springer, C. Baron, A. Szczepaniak, V. Uhlenwinkel, and D. Raabe: Sci. Rep., 2017, vol. 7, pp. 17–22.
D. Raabe, C.C. Tasan, H. Springer, and M. Bausch: Steel Res. Int., 2015, vol. 86, pp. 1127–38.
[558]Sebastian Münstermann and Wolfgang Bleck: Mater. Test., 2005, vol. 47, pp. 337–44.
[559]K. Tanaka and T. Saito: J. Phase Equilibria, 1999, vol. 20, pp. 207–14.
H. Springer, R. A. Fernandez, M. J. Duarte, A. Kostka, and D. Raabe: Acta Mater., 2015, vol. 96, pp. 47–56.
[561]R. Rana and C. Liu: Can. Metall. Q., 2014, vol. 53, pp. 300–316.
[562]C. Baron, H. Springer, and D. Raabe: Mater. Sci. Eng. A, 2018, vol. 724, pp. 142–47.
J. E. Gubernatis and T. Lookman: Phys. Rev. Mater., 2018, vol. 2.
[564]Thomas Gebhardt, Denis Music, Tetsuya Takahashi, and Jochen M. Schneider: Thin Solid Films, 2012, vol. 520, pp. 5491–99.
[565]H. Springer, M. Belde, and D. Raabe: Mater. Des., 2016, vol. 90, pp. 1100–09.
Z. Yang, Y. C. Yabansu, R. Al-Bahrani, W. Liao, A. N. Choudhary, S. R. Kalidindi, and A. Agrawal: Comput. Mater. Sci., 2018, vol. 151, pp. 278–87.
Z. Yang, Y. C. Yabansu, D. Jha, W. Liao, A. N. Choudhary, S. R. Kalidindi, and A. Agrawal: Acta Mater., 2019, vol. 166, pp. 335–45.
F.E. Bock, R.C. Aydin, C.J. Cyron, N. Huber, S.R. Kalidindi, and B. Klusemann: Front. Mater., 2019, vol. 6, pp. 1–23.
[569]S. Reeh, D. Music, T. Gebhardt, M. Kasprzak, T. Jäpel, S. Zaefferer, D. Raabe, S. Richter, A. Schwedt, J. Mayer, B. Wietbrock, G. Hirt, and J. M. Schneider: Acta Mater., 2012, vol. 60, pp. 6025–32.
[570]Y. J. Li, A. Savan, A. Kostka, H. S. Stein, and A. Ludwig: Mater. Horizons, 2018, vol. 5, pp. 86–92.
[571]Ji-Cheng Zhao: J. Mater. Res., 2001, vol. 16, pp. 1565–78.
[572]H. Springer, M. Belde, and D. Raabe: Mater. Sci. Eng. A, 2013, vol. 582, pp. 235–44.
L. Ward, A. Agrawal, A. Choudhary, and C. Wolverton: Npj Comput. Mater., 2016, vol. 2, pp. 16028–35.
[574]Ankit Agrawal and Alok Choudhary: Int. J. Fatigue, 2018, vol. 113, pp. 389–400.
[575]Yoshitaka Adachi, Motoki Taguchi, and Shogo Hirokawa: Tetsu-To-Hagane/Journal Iron Steel Inst. Japan, 2016, vol. 102, pp. 722–29.
C. Wang, H. Fu, L. Jiang, D. Xue, and J. Xie: Npj Comput. Mater., 2019, vol. 5, pp. 87–95.
[577]Cheng Wen, Yan Zhang, Changxin Wang, Dezhen Xue, Yang Bai, Stoichko Antonov, Lanhong Dai, Turab Lookman, and Yanjing Su: Acta Mater., 2019, vol. 170, pp. 109–17.
[578]E. P. George, D. Raabe, and R. O. Ritchie: Nat. Rev. Mater., 2019, vol. 4, pp. 515–34.
Acknowledgments
We gratefully acknowledge scientific discussions with F. Archie, W. Bleck, A. Breen, G. Dehm, P. Eisenlohr, T. Hickel, P. Konijnenberg, J. Neugebauer, S. Münstermann, H. Sandim, M. Sandim, L. Schemmann, C. Scheu, and J. Wittig and technical support by M. Adamek, K. Angenendt, H. Faul, M. Nellessen, A. Sturm, and U. Tezins. Financial support from the DFG (German Research Foundation) through the SFB 761 ‘Steel Ab initio’ (collaborative research center SFB 761, http://www.stahl-abinitio.de/en) is gratefully acknowledged.
Funding
Open Access funding provided by Projekt DEAL.
Author information
Authors and Affiliations
Corresponding author
Additional information
Publisher's Note
Springer Nature remains neutral with regard to jurisdictional claims in published maps and institutional affiliations.
Manuscript submitted March 31, 2020.
Rights and permissions
Open Access This article is licensed under a Creative Commons Attribution 4.0 International License, which permits use, sharing, adaptation, distribution and reproduction in any medium or format, as long as you give appropriate credit to the original author(s) and the source, provide a link to the Creative Commons licence, and indicate if changes were made. The images or other third party material in this article are included in the article's Creative Commons licence, unless indicated otherwise in a credit line to the material. If material is not included in the article's Creative Commons licence and your intended use is not permitted by statutory regulation or exceeds the permitted use, you will need to obtain permission directly from the copyright holder. To view a copy of this licence, visit http://creativecommons.org/licenses/by/4.0/.
About this article

Cite this article
Raabe, D., Sun, B., Kwiatkowski Da Silva, A. et al. Current Challenges and Opportunities in Microstructure-Related Properties of Advanced High-Strength Steels. Metall Mater Trans A 51, 5517–5586 (2020). https://doi.org/10.1007/s11661-020-05947-2
Received:
Accepted:
Published:
Issue Date:
DOI: https://doi.org/10.1007/s11661-020-05947-2