
Abstract
Purpose
A life cycle assessment was performed for the production of a total mixed ration (TMR) fed to finishing feedlot cattle in California, USA. The goal was to determine the climate change impact of the feed supply chain associated with the production of 1 kg finishing TMR (kg CO2e/kg TMR). A secondary goal was to compare the climate change impact of feed versus finished beef (kg CO2e/kg live weight).
Methods
The TMR was based on feeds commonly fed to finishing cattle in California. The Livestock Environmental Assessment and Performance Partnership (LEAP) guidelines were followed for inventory data collection. System boundaries included the production of crops and feed additives, transportation of TMR components, and compound feed production. Data were sourced from national databases and Ecoinvent™ unit process data. Three scenarios were assessed as a result of allocation at the transportation step: Scenario A (100% empty return load); Scenario B (50% empty return load): and Scenario C (0% empty return load). Energy, mass, and economic allocation, and system expansion of dried distillers grain solubles (DDGS) were assessed for sensitivity analysis. Total feedlot emission data from Stackhouse-Lawson et al. (2012) were used to compare to impacts of TMR production.
Results
Total emissions were determined to be 0.630 kg CO2e/kg TMR for Scenario A, 0.576 kg CO2e/kg TMR for Scenario B, and 0.521 kg CO2e/kg TMR for Scenario C. Corn production, transportation, and liquid premix production were primary contributors to the life cycle impacts of TMR production. Mass-based allocation of DDGS was found to have the most significant effect on overall impacts of the finishing TMR, with a 42% increase in life cycle emissions compared to other allocation methods. For Scenario A, feed used in Angus feedlot production contributed to 76% of total Angus feedlot emissions. Additionally, feed used in Holstein feedlot production contributed to 58% of total Holstein feedlot emissions.
Conclusions and recommendations
The present study demonstrates a need to better assess the feed supply chain of feedlot beef production in order to accurately identify areas that have the most significant impacts on overall emissions. This may aid in minimizing impacts associated with feed production and, by extension, beef production. The present study may also serve to inform future decisions for improvements or alterations of the LEAP guidelines.
1 Introduction
Beef production in the USA encompasses three primary production systems, cow-calf, stocker, and finisher. Most animals are raised extensively in cow-calf and stocker operations until they reach approximately 400 kg and are then finished intensively in feedlots. The environmental impacts, which result from each of these production systems, as well as the sustainability of beef production as a whole, continue to be a contentious issue of public debate. Life cycle assessment (LCA) is a tool widely used to assess the impact of various production systems and has been used extensively in beef production (Asem-Hiablie et al. 2019; Battagliese et al. 2013; Beauchemin et al. 2010, 2011; Casey and Holden 2006a, b; Nguyen et al. 2010; Nguyen et al. 2012a, b; Pelletier et al. 2010; Peters et al. 2010a, b, 2011; Rotz et al. 2019). While several LCA have been performed to assess impacts of various beef production systems, differences in data sources and collection strategies, functional unit, and system boundaries have resulted in substantial variability of results and have often led to difficulty directly comparing studies.
One area in which standardization among beef LCA can be achieved is through the assessment of feeds and diets fed to cattle in different production systems. The Livestock Environmental Assessment and Performance Partnership (LEAP) created guidelines to harmonize the assessment of the environmental performance of animal feed supply chains globally (FAO 2016a). The LEAP guidelines provide a clear and standardized set of instructions to complete a successful LCA of the impact of feeds. The present study aimed to determine the impact of a feedlot ration representative of those typically fed in California, USA, feedlot systems following LEAP guidelines.
2 Methods
2.1 Goal and scope
The present study is a LCA of the feed supply chain for finishing rations of feedlot cattle produced in California, USA. LEAP guidelines were followed to complete this LCA (FAO 2016a). The finishing ration analyzed is considered to be typical of a Californian feedlot (Table 1).
2.1.1 Goal
The primary goal of this LCA was to determine the carbon footprint from the feed supply chain associated with production of a California, USA, finisher feedlot total mixed ration (TMR) on the basis of 1 kg carbon dioxide equivalents (CO2e)/kg of TMR. An additional goal was to determine the impacts of a feedlot finisher ration in relation to the entire feedlot finishing phase of beef production in California.
2.1.2 Scope
A cradle-to-farm gate analysis was performed, which included inputs and outputs from crop production, transport of crops to a feed mill, and processing of feed (compound feed production). Inventory data for crops were obtained from the United States Department of Agriculture National Agricultural Statistics Service (USDA NASS), university extension, and LCA peer-reviewed literature sources. Fertilizer, herbicide, and insecticide use for crop production and energy inputs at each stage of the supply chain were also included within the scope of this study. Figure 1 lists all processes included within the scope of the study. All greenhouse gas (GHG) emissions were reported as equivalents of carbon dioxide (CO2e).
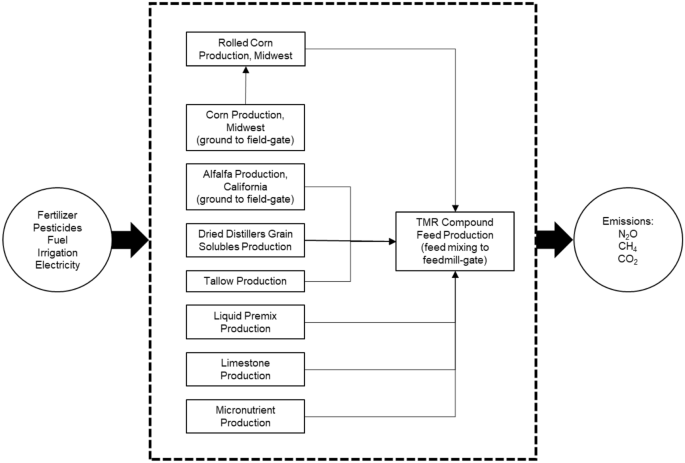
System boundaries for production of a typical finishing total mixed ration (TMR) for beef cattle in California, USA. Solid boxes represent production stages, the dashed box represents the total system boundary, circles represent the general input and outputs to the system, small arrows represent transportation steps, and large arrows represent the input and output flows
2.1.3 Audience
Results from the present study are relevant to farmers, feed mill managers, feedlot producers, the general public, and government regulatory entities. It will help to provide producers with insight into areas of the feed supply chain that may be improved upon or altered to help minimize impacts to the overall life cycle of beef cattle.
2.2 Functional unit and reference flows
The functional unit was 1 kg of TMR at it exits from the feed mill-gate prior to transportation to animal bunks. The selected TMR was based on expert opinion and personal communication with the University of California, Davis (Davis, CA) Cooperative Extension specialists as well as California feed mill managers and feedlot nutritionists. Primary ingredients assessed include the following: alfalfa hay; rolled corn; dried distillers grain solubles (DDGS); liquid premix (LPM) comprised of non-protein nitrogen, salt, and vitamins; micronutrients, which consist of probiotics, Vitamin E, Vitamin A, copper sulfate, and Rumensin (Elanco, IN); tallow; and limestone. This ration represented a diet one can expect to see fed to finishing cattle in California. While it is common to feed various by-products in California, such as bakery waste or beet pulp, these feed items vary based on product availability, price, and seasonality. As a result of this variability, these items were out of the scope of the present study. Additionally, pharmaceutical additives (e.g., beta agonists) were excluded from the present analysis.
2.3 System boundary and unit stages
In accordance with LEAP guidelines (FAO 2016a), capital goods were excluded from the scope for all stages of the supply chain, as it was assumed all capital goods have a lifetime greater than 1 year. Due to limited data and information, production and maintenance of machinery used were also excluded. Additionally, the system boundary excluded impacts associated with employee travel at any stage of the supply chain.
For crop production and processing, corn and alfalfa cultivation were the two primary feed ingredients assessed. Inputs of inorganic fertilizer, manure, crop residue, pesticides, fuel, electricity, and natural gas were included. Seed material and peat application were not included due to lack of information. Landis et al. (2007) determined that seed production accounted for less than 1% of emissions from corn and soy production. Thus, it was likely this information would not significantly impact the outcome of the present study. Storage of feedstuffs was not included within the system boundary for crop production, as it was assumed the harvested feedstuffs were transported immediately from field-gate to the feed mill. It was also assumed that the dry matter content of alfalfa and corn at field-gate remained the same within the ration and no further processing of the crops occurs until the crops reach the feed mill.
Feed processing and compound feed production began with the receipt of feedstuffs to the feed mill and ended when the compound feed was placed in storage and was ready for transportation to the next stage (FAO 2016a). Electricity and natural gas were accounted for with the processing and compounding of feed at the feed mill. An extensive literature search resulted in only one study previously conducted to assess the life cycle impacts for the operation of a feed mill. Adom et al. (2013) assessed the carbon footprint of dairy feed from a mill in Michigan, USA. The present study utilized electricity and natural gas information under the assumption that feed mills across the USA require similar inputs to operate milling machinery.
Transportation of all feedstuffs to the feed mill was included in the system boundary, taking into account the average distances traveled and average transportation load sizes. Transportation modes included both train and truck. It was assumed that finishing TMR was produced at an on-site feed mill, thus rendering the transportation to animal feed bunks minimal in relation to other life cycle processes. As such, transport to animal bunks was excluded from the present analysis.
According to LEAP guidelines (FAO 2016a), no upstream emissions should be attributed to residues. This included wet co-products from the agricultural commodity industry, specifically, dried distillers grain solubles (DDGS) from ethanol production. As a result, the upstream processes of DDGS used in the TMR were not initially factored into the system boundary of crop production and processing. Other feedstuffs in the finishing TMR include tallow, LPM, micronutrients, and limestone.
2.4 Allocation
In accordance with LEAP guidelines (FAO 2016a, 2020), and by extension of ISO 14,044 standards (ISO 2006), allocation was avoided when possible. As a result, initial results were reported without the inclusion of all processes leading up to the production of DDGS as these processes were attributed to ethanol production. The use of DDGS in cattle rations is primarily the result of corn ethanol production in the USA. Prior to the rise in ethanol production, DDGS were not utilized in great quantities in cattle rations and it was more typical to include other concentrates, such as corn or soybean meal. However, DDGS have been found as comparable additives to use successfully in cattle rations. Thus, DDGS have been considered a co-product of ethanol production adding economic value to the product and warranting consideration of allocation. As a result, energy, mass based, and economic allocation as well as system expansion were applied to DDGS as a means of sensitivity analysis. Extensive work had been performed to assess the environmental impacts associated with corn ethanol (Hill et al. 2006; Shapouri et al. 2010; Wang 2001) and DDGS production (Hill et al. 2006). As a result of this work, Adom et al. (2012) developed emission factors for energy, mass based, and economic allocation as well as system expansion of DDGS as a by-product of corn ethanol production in the USA. These allocation factors utilized in the present study were 1.6 kg CO2e/kg DDGS for energy, 2.3 kg CO2e/kg DDGS for mass, 0.91 kg CO2e/kg DDGS for economic, and 0.53 kg CO2e/kg DDGS for system expansion.
The system boundaries cut-off was at the feed mill gate and any losses of the final TMR or wastes associated with the production of the TMR were not included into the analysis; thus, allocation was not required. Fertilizer and pesticide data for corn production were reported as the total application of corn grain and corn silage (NASS 2014). As a result, the production of corn grain and corn silage was totaled and the contribution of corn grain to the overall production of corn was determined. From this, an allocation factor of 0.93 was calculated and applied to all fertilizer and pesticide data in corn production (see Sect. 4.1).
Return load transport was an important factor to account for when assessing transportation and presented a complex allocation issue. According to LEAP guidelines, if there is no supporting information available, it should be assumed that 100% of additional transport (i.e., transport back to the original load location) is needed for the empty return. As no information was available for return load transportation, transportation was analyzed under three scenarios: 100% empty return load (Scenario A), 50% empty return load (Scenario B), and 0% empty return load (Scenario C) allocated to the complete life cycle.
3 Life cycle inventory analysis
All inventory data collection followed LEAP guidelines (FAO 2016a). Given the large scope of the present study, national databases, peer-reviewed literature, and university extension cost analysis studies were secondary data sources used to compile the life cycle inventory. For processes where these data sources were unavailable, the Ecoinvent™ database (SimaPro 2009) was used. The present study aimed to assess climate change; therefore, the primary emissions accounted for in the life cycle inventory analysis included carbon dioxide (CO2), methane (CH4), and nitrous oxide (N2O). The following sections provide detailed information on the life cycle inventory and analysis for each step of the feed supply chain.
3.1 Corn production inputs and inventory
Primary inputs for corn production included inorganic and organic fertilizer, pesticide and lime application, crop residues, and energy use on the farm. Energy use accounted for gasoline, diesel, liquefied petroleum gas (LPG), natural gas, and electricity. Corn used in California feedlots rations was primarily sourced from the Midwest. Corn production was modeled based on data from twelve states (Illinois, Indiana, Iowa, Kansas, Michigan, Minnesota, Missouri, Ohio, Wisconsin, South Dakota, North Dakota, and Nebraska), which were the most representative of the Midwest. Corn production data were sourced from USDA NASS databases. This data was originally provided in Imperial units and was converted to Metric once total production was determined. Data on the total area for corn grain (in acres), corn grain production (in bushels), and production of corn silage (in tons) for years 2010 through 2014 were collected (NASS 2015) and averaged across states. From this information, corn grain yield (in bushels/acre) was calculated and averaged. Corn grain and silage production data were then converted to kg of production, averaged, and proportions of each compared to total corn (grain and silage) production were determined. This value (0.93 corn grain) was used to allocate fertilizer and pesticide inputs to corn grain, specifically.
Data for fertilizer inputs included nitrogen (N), phosphorus (P), potassium (K), and sulfur (S). Pesticide inputs were split into herbicides and insecticides. Herbicide inputs included those from glyphosate (i.e., Roundup™; Monsanto, MO), atrazine (Syngenta, Switzerland), metolachlor (Novartis, Switzerland), acetochlor (Monsanto, MO), as well as total application of herbicides (a nonspecific mix of all herbicides applied to corn produced in the USA). Insecticide inputs were a nonspecific mix of all insecticides applied to corn produced in the USA. All fertilizer and pesticide inputs were collected from the 2014 Corn and Potatoes Chemical Use Survey (NASS 2014). This information was provided as total product used for all corn (i.e., grain and silage) production, which made it necessary to allocate to corn grain production, specifically. It was assumed that corn grain and silage required the same amount of fertilizer and herbicide inputs. Inventory data for lime application and use of diesel, gasoline, LPG, electricity, and natural gas were sourced from the 2008 Energy Balance for the Corn-Ethanol Industry report (Shapouri et al. 2010). For states without lime and energy inventory data, the weighted averages calculated by Shapouri et al. (2010) were used.
In addition to total N application, soil N from corn rotation with soybean stands, total N required to meet the yield, N from manure application, and corn grain residue N were determined. Nitrogen remaining from corn rotation with soybean was assumed to be 18.1 kg N/acre based on data from O'Leary et al. (2013). Nitrogen required to meet the yield was 0.540 kg N/bushel (bu) of corn produced (Adom et al. 2012). The difference between N requirement to meet yield and total N applied to soil was used to determine the amount of N required from manure application. If the value was negative, this meant that the particular state did not require manure application to meet the total N requirement and the value was set to zero. Finally, N2O emissions from the degradation of crop residues above and below ground were determined following IPCC (2006) Tier 1 methodology and Eq. 11.6 for “N from crop residues and forage/pasture renewal.”
3.2 Alfalfa production inputs and inventory
Primary inputs included in alfalfa production were the same as corn; however, the inventory for alfalfa did not include lime application. For energy use, gasoline, diesel, and electricity from irrigation were included in the life cycle inventory. To calculate contributions of transportation, it is assumed that 70% of alfalfa is sourced within California and 30% of alfalfa is sourced from Utah, Arizona, and Nevada, for all alfalfa used in the feedlot TMR. Given similar climates, it was assumed that production in California was representative of all possible sources.
In order to estimate the inventory for production, the University of California Cooperative Extension (UCCE) Sample Costs to Establish and Produce Alfalfa Hay budgets from 2012 through 2015 were used (Long et al. 2013, 2015; Orloff et al. 2012a, b; Putnam et al. 2014). These cost budgets provide recommended inputs for fertilizer, pesticides, fuel, and water for irrigation based on farm scenarios for specific regions in California. While these were not actual production records, the cost budget estimates are prepared by cooperative extension specialists with in-depth knowledge of the conditions required to produce alfalfa in California; therefore, the cost budgets served as reasonable estimates of inputs required for California alfalfa production.
NASS census data for alfalfa production in total area harvested provided the most accurate representation of alfalfa crop inputs and resulting emissions. The NASS (2015) census alfalfa production numbers from 2012 were utilized for the cost reports, which were specific to counties in California (Long et al. 2013, 2015; Orloff et al. 2012a, b). The cost report from 2014 (Putnam et al. 2014) was specific to organic alfalfa production for all of California. As a result, NASS (2015) census data on organic alfalfa production for the years 2011 and 2014 were the most current data available.
3.3 Other TMR ingredient inputs and inventory
Remaining TMR ingredients include DDGS, tallow, LPM, micronutrients, and limestone. No upstream emissions were initially attributed to DDGS production, following LEAP guidelines (FAO 2016a). Therefore, transportation and processing of DDGS were the only inventory stages, which contributed to the overall life cycle analysis. However, many studies have incorporated upstream processes associated with distiller’s grain production through energy, mass based, or economic allocation methods or through system expansion. Therefore, a sensitivity analysis was performed to provide insight into the impacts associated with DDGS if one were to use energy, mass based, and economic allocation methods as well as system expansion.
Slaughter by-products were considered a wet co-product from the agricultural industry. Tallow results of rendering slaughter by-products and requires further processing prior to its use as a feedstuff. In accordance with LEAP guidelines (FAO 2016a), Ecoinvent™ unit process data (SimaPro 2009) were used for processing of tallow at plant. Upstream emissions prior to rendering tallow were not included. The specific mixes for LPM and micronutrients were proprietary information. As a result, the specific mixes of ingredients were unknown and Ecoinvent™ unit process data (SimaPro 2009) for trace minerals produced at the plant were used for both LPM and micronutrient production profiles. Ecoinvent™ unit process data (SimaPro 2009) were used for limestone production. Calculation of the specific impacts for feed additives was not provided in the LEAP guidelines (FAO 2016a). However, LEAP guidelines stated that data for additives should be sourced from internationally accepted databases were available (FAO 2016a).
3.4 Total amount of feedstuffs for TMR production
The TMR utilized in the present study was considered an average one might expect to find in a California feedlot ration. Rations changed depending on the region of California in which cattle were fed; however, regional detail was out of the scope of the present study. It was also important to note that, typically, animals were first fed a starter ration and then a transition ration before receiving the finishing TMR. However, the amount of time spent on each of these feeds was minimal in comparison to the time on the finishing TMR. In addition, the ingredients typically remained the same, while the proportion of each ingredient changes slightly (Table 1). Given this information, it was assumed that the contributions of starter and intermediate TMR would be minimal to the total supply chain; therefore, it was assumed that animals are fed the finishing TMR ration for their entire period at the feedlot.
To determine the amount of each feedstuff needed for transport and compound feed production, the total number of animals assumed to be fed the finishing TMR and slaughtered in a year was needed. For this, NASS 2012 census data (NASS 2015) for total head of cattle sold for slaughter in California was used. It was assumed that this number (approximately 713,000 head; Table S1) was the amount of cattle fed the finishing TMR under investigation; therefore, it was necessary to determine the amount of feed required per head to determine the total impact of the supply chain.
In California, the two primary types of cattle finished in a feedlot are Angus crosses and Holstein bull calves (a by-product of the California dairy industry). It was assumed that 50% of cattle finished in California were Angus and 50% were Holstein. This led to variability of how much feed was required to finish each type of animal (Table S1). To determine the final amount of each feedstuff needed for transport and subsequent processing at the feed mill, the percentage of each feedstuff in the finishing TMR was multiplied by the total amount of finishing TMR required per year to finish the animals. These numbers were used in transportation and TMR compound feed production to determine the impacts of each portion of the supply chain.
3.5 Transportation
Transportation distances are displayed in Table S2. Transport distances of limestone, tallow, LPM, and DDGS were averages based on personal communication with feed mill managers. These products were assumed to be transported via truck. Transport distances of corn and alfalfa were averages of relative travel distances from points of crop production. Alfalfa was assumed to be transported within the state of California via truck, while the majority of corn transport was via rail with only a small portion of corn transport assumed to be via truck.
In order to determine the amount of feedstuffs transported from field-gate to feed mill-gate, the total amount of each feed ingredient was determined (Table S2). The amount of each feedstuff in combination with distance of transport for each feedstuff was used to determine the payload distance. The payload distance was then multiplied by the applicable emissions factor to determine the total amount of CO2e emitted from transportation of each feedstuff.
3.6 Feed processing and compound feed production
Data for feed mill processing was unavailable for the present study. As a result, inventory data was determined based on information provided by Adom et al. (2013). While the types of feeds being processed by a dairy feed mill may vary from feed processed in a beef feed mill, it was assumed that milling technology (such as pellet mills, steam rollers) used at the Michigan mill was similar to what one would see in a typical California feed mill. As a result, it was assumed that the energy requirements to process a kg of feed were very similar, and that the information from Adom et al. (2013) provided a reasonable estimate of the energy inputs and emissions that result from feed mill processing. The two major inputs to the compound feed production were electricity and natural gas. Adom et al. (2013) obtained total electricity used (kWh) for an 11-month period. This information was averaged to provide an estimate of the total electricity used over 1 year of production. Natural gas consumption was averaged from the average of total natural gas used at the Michigan mill in 2007 and 2008 (Adom et al. 2013). Emission factors for electricity and natural gas were applied to determine the total kg CO2e/kg of TMR produced at the mill. In accordance with LEAP guidelines (FAO 2016a), Eoinvent™ unit process data (SimaPro 2009) were used and while this data is based largely on European conditions, it was assumed that the information was technologically relevant, as the US and EU use modern technology in processing of such products.
4 Life cycle impact assessment
Global warming impact was assessed in the present study. All life cycle data inputs were converted into CO2e following LEAP guidelines (FAO 2016a) and utilizing relevant emission factors, which were either calculated or obtained from Ecoinvent™ unit process data (SimaPro 2009). Global warming potential (GWP) was the standardized impact factor used to assess global warming. The IPCC GWP 100 method (IPCC 2007) was utilized for which emissions from CO2, CH4, and N2O are 1, 25, and 298 CO2e, respectively. In addition to these, emission factors determined through Ecoinvent™ unit process data were included for emissions of refrigerants and other chemicals with high GWP were relevant. Given that most of the emission factors used in the present study were not yet available in the updated IPCC format, the most recent IPCC guidelines were not used. Nitrous oxide emissions from fertilizer used in corn and alfalfa production were the only emissions that would result in calculated differences in emissions for the present study. Given that the updated GWP for N2O is lower than that used herein, the present estimates are more conservative.
4.1 Emission factors
A detailed list of all emission factors are given in Table 3. Emission factors used were in accordance with LEAP guidelines (FAO 2016a). Factors were sourced primarily from the Ecoinvent™ database in SimaPro 7.1 (SimaPro 2009) and Adom et al. (2012).
While the UDSA NASS database provided N fertilizer input data for corn, it did not specify the types of N fertilizer being applied to corn. This resulted in a lack of information for specific emission factors for direct- and indirect N2O emissions. Adom et al. (2012) recognized this lack of information and created an average US N-fertilizer production profile based on data for fertilizer consumption in the USA from 2004–2007. This information lead to the creation and use of emission factors for a “US mix” of N fertilizer based on corresponding Ecoinvent™ unit process data (SimaPro 2009). Included in these factors were emissions due to manufacturing of N-fertilizer, field emissions of CO2, and direct- and indirect N2O field emissions. Adom et al. (2012) followed IPCC (2006) methodology to develop these emission factors, and in accordance with LEAP guidelines (FAO 2016a), these factors (Table 3) were used to determine the direct- and indirect N2O emissions from N fertilizers in corn and alfalfa production. Adom et al. (2012) utilized a similar approach to create US mixes for P, K, and S fertilizers and then determined emissions due to manufacturing. These emission factors were used in the assessment of P, K, and S fertilizers as applicable in both corn and alfalfa production (Table S3). Emission factors for lime manufacturing and application in corn production where sourced from IPCC (2006). Note that it was assumed that alfalfa production utilized the same emission factors for relevant production inputs (specific data for alfalfa was unavailable).
Similar to emissions for fertilizer inputs, chemical crop protection inputs were determined using an average of input data for corn production. For herbicides, NASS (2014) inventory data on use of Glyphosate, Atrazine, S-Metolachlor, Acetochlor, and total herbicide use were collected. The sum of Glyphosate, Atrazine, S-Metolachlor, and Acetochlor was determined and then the percent contribution of each herbicide determined. These values (Table S3) were used to determine the weighted emission factor for the herbicide mix. Ecoinvent™ profiles (SimaPro 2009) for Glyphosate, Atrazine, S-Metolachlor, and Acetochlor were applied to each chemical, respectively, and the herbicide mix was applied to the remaining herbicide (for which the specific mix of chemicals was unknown). The specific inventory breakdown for insecticides was unknown and NASS (2014) data for total insecticide amounts were determined. A weighted emissions factor, determined by Adom et al. (2012), was used to establish the impact of insecticides. As with fertilizer emissions, it was assumed that alfalfa production utilized the same emission factors for relevant production inputs. This was because specific data for alfalfa was unavailable.
Ecoinvent™ profiles (SimaPro 2009) were selected to most closely match the road and rail transportation modes. The emission factor for a 16,300 to 32,500 kg CO2e/(kg∙km) capacity European road transport eco-profile was used to determine the impacts associated with each corresponding payload-distance (kg∙km). The emission factor for a USA freight train eco-profile was chosen to determine the impacts associated with the corresponding corn payload-distance. Ecoinvent™ profiles (SimaPro 2009) were used to determine the energy impacts. Energy impacts included gasoline, diesel, LPG, natural gas, and electricity (Table S3).
5 Results and discussion
5.1 Overview of total life cycle impacts
Life cycle results are presented in Table S4 and depicted in Fig. 2 for all three transportation scenarios under analysis. Scenario A followed LEAP guidelines (FAO 2016a) for all processes (i.e., no environmental impact allocation of DDGS) and incorporates the most extreme allocation scenario (i.e., 100% empty return load) for transportation. Considering that corn is transported across the country (almost 3000 km) via rail, it is likely an overestimation to assume a 100% empty load return trip via rail. This likely leads to a much greater life cycle impact contribution from transportation than is realistic. As a result, two additional scenarios were analyzed to compare life cycle impacts. Scenario B allocates 50% of the empty load transport to the TMR supply chain and Scenario C allocates 0% of the empty load transport to the TMR supply chain. Both scenarios B and C followed LEAP guidelines (FAO 2016a) except in the case of allocating transport, in which both provide a more realistic analysis.
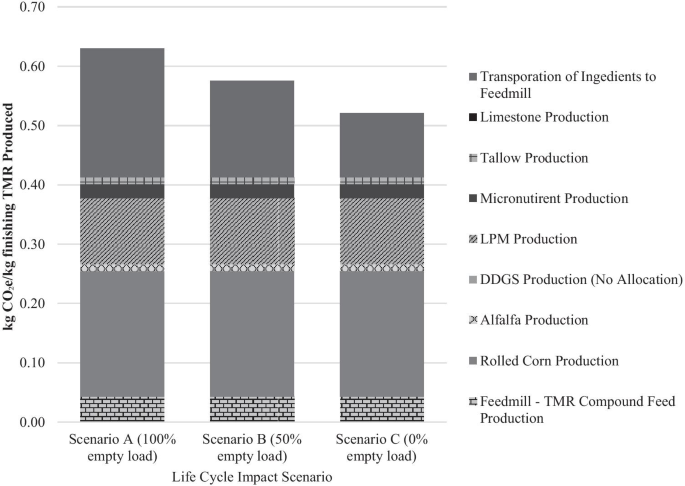
Life cycle impacts of production of an average finishing total mixed ration (TMR) fed to feedlot cattle in California, USA. Assessed with three transportation allocation scenarios (A, B, and C)
The total life cycle impact of producing 1 kg TMR at the feed mill-gate was, as expected, the greatest in Scenario A, with a total of 0.630 kg CO2e/kg finish TMR. As this was one of only a few LCA related to the production of a feedlot cattle ration, this result could only be compared with the four other scenarios presented in the present study. Adom et al. (2013) assessed the carbon footprint of dairy feed from a mill in Michigan including crop production and transport, and determined an impact of 0.620 kg CO2e/kg dairy mill output under economic allocation and 0.930 kg CO2e/kg dairy mill output under mass allocation. Adom et al. (2013) assessed a much greater array of feedstuff compared to the present study and the study was performed in a different geographic location. While the results from Adom et al. (2013) may appear similar to results in Scenario A, a direct comparison of these results would be inaccurate given the differences in system boundaries and inputs.
Figure 2 depicts the relative contribution of each stage in the finishing TMR supply chain as a percentage of the total life cycle impact for each scenario. Among all three scenarios, rolled corn production, transportation, and LPM production had the largest contributions to the overall life cycle impacts of TMR production. These three inputs made up 83–85% of the total GHG emissions, depending on the scenario (Fig. 2). In all three scenarios, compound feed production was the next largest contributor of life cycle emissions, ranging from 7–8% of total GHG emissions, with micronutrient production (4–5%), alfalfa production (2%), and tallow production (2%) following. Limestone production contributed less than 1% to total GHG emissions, and DDGS production did not contribute to total GHG emissions when no allocation was applied to DDGS production.
5.2 Crop production
Landis et al. (2007) utilized the GREET model to determine GHG impacts of corn produced in the US “cornbelt” ranged from 0.310 to 0.680 kg CO2e/kg of dry corn. While a much greater range of values, these are comparable to values found for corn production in the present study. Rolled corn production in all three scenarios contributed greater than 30% of the total emissions from the supply chain (Fig. 3), with 0.212 kg CO2e/kg TMR. Considering rolled corn makes up 58.5% of the finishing TMR, it was expected to contribute substantially to the overall feed life cycle. While there have not been any other studies to asses a similar supply chain for animal feed production, several studies have assessed the impacts of corn production. The total impact of producing 1 kg of corn grain from the Midwest is 0.362 kg CO2e (Table S5). In a study utilizing the “IPCC 2006 100a” methodology in SimaPro 7.1, Adom et al. (2012) reported a central bound estimate of 0.390 kg CO2e/kg corn grain produced in the USA and 0.370 kg CO2e/kg corn grain produced in “Region 3,” which encompassed of 8 of the 12 states assessed in the present study as the “Midwest.”
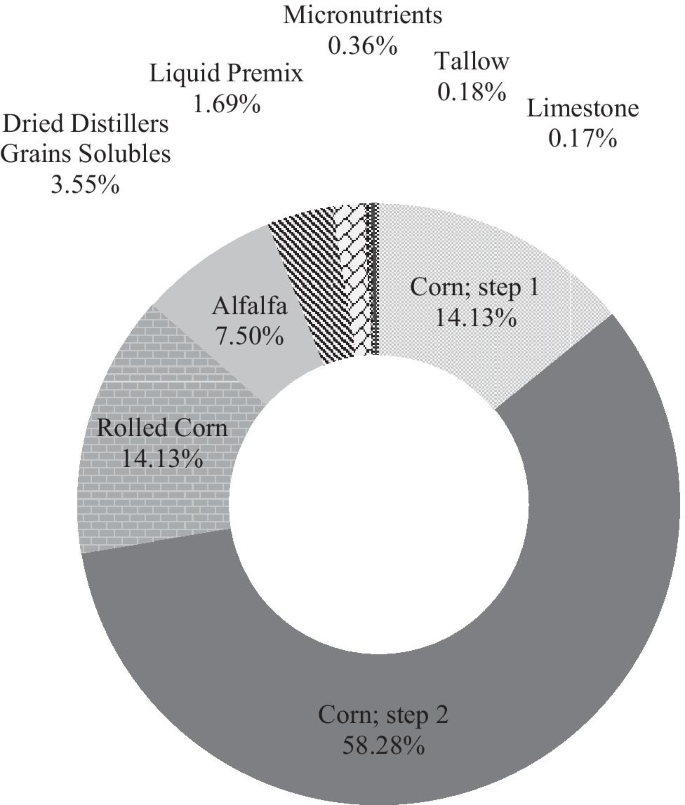
Contribution of transport for each total mixed ration (TMR) ingredient from field or factory-gate to mill-gate. Corn step 1 is the distance traveled by truck from field-gate to rail in the Midwest; corn step 2 is the distance traveled by rail from the Midwest to California; rolled corn is transport by truck from rail in California to feed mill-gate
Even so, the limitations of attributional LCAs remain and likely impacted the total impact of 1 kg of corn grain in the present work. Plevin et al. (2013) noted that the inability to directly measure inputs and outputs associated with calculating emissions associated with specific products was a shortcoming of LCAs. This is an important consideration due to the dependency on ingredients like corn in beef feedlot diets. However, FAO (2016b) stated that the LEAP protocols were meant to be specific and applicable in its capabilities in monitoring agriculture systems. Despite potential under- or overestimation of environmental impacts and criticisms of the protocols (Plevin et al. 2013), LEAP helped standardize LCA practices for both consequential and attributional studies and have proven beneficial in the present work.
In the present study, alfalfa production contributed minimally to the overall finishing TMR emissions profile, contributing to 2% of total emissions in all three scenarios (Fig. 2). The total impact of producing 1 kg of alfalfa is 0.126 kg CO2e/kg alfalfa produced (Table S5). This value was lower than similar work by Naranjo et al. (2020) because seed production and on-farm operations were not included within the scope of the present study. This value is close to the lower range of those found by Adom et al. (2012) where alfalfa production was determined to be 0.140–0.270 kg CO2e/kg alfalfa production, depending on the region under observation. Region 5, which would most closely resemble California feed production, was determined to be 0.150 kg CO2e/kg alfalfa production (Adom et al. 2012). The vast differences in production impacts for alfalfa are likely due to the lack of data available for alfalfa production and its related inputs. Similar to the present study, Adom et al. (2012) utilized crop production budgets to estimate parameters for alfalfa production. As mentioned previously, crop production budgets are farm scenarios created by experts in the field; however, the variability between the two studies indicates a clear need for primary data on alfalfa production to more appropriately assess alfalfa production.
Differences between the relative impacts of corn and alfalfa production on overall life cycle emissions are due in part to the total requirements of each crop for TMR production (58.5% for corn and 9.1% for alfalfa); the significant differences in overall emissions per kg of crop produced can be attributed to the fact that alfalfa is a nitrogen fixing plant, and as a result requires significantly less N-fertilizer inputs. Inputs of fertilizer for corn production were 0.263 kg CO2e/kg corn produced, whereas the fertilizer inputs for alfalfa production were 0.047 kg CO2e/kg alfalfa produced (Table S5).
5.3 Other TMR ingredients
The respective contributions of all other TMR ingredients (LPM, micronutrients, tallow, and limestone) for each scenario are depicted in Fig. 2. The total contribution of these four TMR ingredients ranged from 24%, in Scenario A, to 28%, in Scenario C (Table S4). The LEAP guidelines (FAO 2016a) do not provide specific information on how to assess these items for LCA; however, the large portion of GHG emissions these ingredients contribute to the total LCA indicate a need to further analyze these ingredients as well as a need to determine appropriate guidelines for quantifying such impacts.
Liquid Premix production contributed 9–17% of total GHG emissions from production of the finishing TMR (Table S4). Liquid premix is a combination of non-protein nitrogen, salt, and vitamins; however, the specific mix of these ingredients is unknown. As a result, Ecoinvent™ unit process data (SimaPro 2009) for trace minerals produced at the plant were used. This emission factor is quite large and in combination with a 7% inclusion rate into the finishing TMR, the overall contribution of LPM to the life cycle impacts of the finishing TMR is to be expected (Table S3). Micronutrient production contributed 4–5% of the total GHG emissions from the supply chain, depending on the scenario (Fig. 2). However, as with LPM, the specific mix of these ingredients is unknown. As a result, the general LPM emission factor was used for micronutrients (Table S3). This indicates need for more detailed data in order to most accurately determine the impacts of specific components of both LPM and micronutrient production.
Tallow production contributed 2% of the total GHG emissions from the supply chain, regardless of scenario under analysis (Fig. 2). More information is needed on the specific processing involved in rendering, as it is possible that the emission factor used is an underestimate of the impacts associated with tallow production. The environmental impact of limestone production was nearly 0% in all three scenarios (Table S4). It is used in such minimal quantities that it may not be necessary to include in future feed production analyses; however, it may still be necessary to more accurately define the impacts associate with limestone production to account for its impacts as accurately as possible.
5.4 Transportation
Transportation accounted for a considerable portion of the total emissions profile for TMR production; contributing 34% in Scenario A, 28% in Scenario B, and 21% in Scenario C (Fig. 2). This is not surprising, considering that corn, the largest component of the TMR, has to be sourced from the Midwest of the USA and is thus transported almost 3000 km via rail. The transport of corn by rail is by far the largest contributor to the total transportation sourced GHG emissions with 58% of the total emission profile for transportation (Fig. 3). In Scenario A, transportation of corn by rail alone accounts for 5% of the total emissions profile, which is greater than alfalfa and tallow production combined.
5.5 Compound feed production
In all three transportation scenarios, the process of milling feed in order to produce the finishing TMR contributed 7–8% of the total life cycle impacts (Fig. 3). Emissions from compound feed production were a result of information provided by Adom et al. (2013) on energy consumption of a Michigan feed mill. While technologically relevant, it is likely necessary for future studies to acquire more milling data to most accurately represent the system.
5.6 Allocation of DDGS
When allocating the production of DDGS, life cycle emissions increased drastically. The base scenario (Scenario A) was utilized for comparison of allocation methods as it was the scenario which was LEAP compliant (FAO 2016a). All allocation methods resulted in substantial increase to total emissions (Table S6); however, the relative contribution of DDGS was variable depending on allocation method (Fig. 4). Mass-based allocation led to the most significant change to the overall impacts of the finishing TMR, with a 42% increase in life cycle emissions. Energy, economic, and system expansion methods led to 34%, 23%, and 15% increases in total kg CO2e/kg finish TMR produced, respectively.
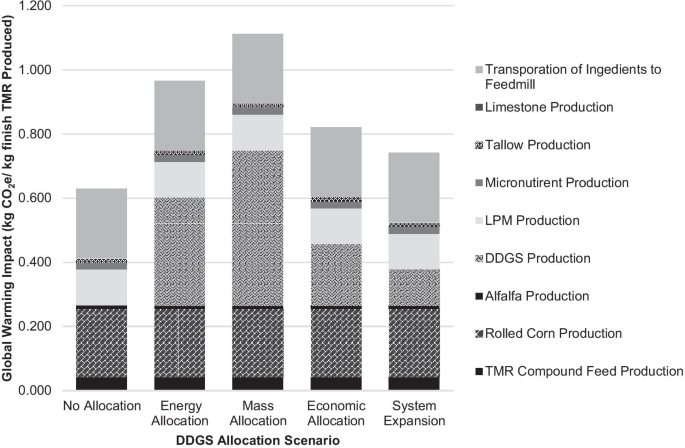
Life cycle impacts of total mixed ration (TMR) production comparing no allocation of dried distillers grain solubles (DDGS) production to four allocation scenarios
In total, the three transportation scenarios acted as their own form of sensitivity analysis, since Scenario A was considered an extreme form of allocation and therefore unlikely to best represent the true carbon footprint of feed transportation. For DDGS, in all three scenarios, mass allocation consistently showed higher emissions, with 0.48 kg CO2e/kg DDGS compared to 0.19 kg CO2e/kg DDGS for economic allocation. These values were provided by Adom et al. (2012), resulting in the same kg CO2e/kg DDGS per transportation scenario. Regardless, mass allocation resulted in a higher carbon footprint for DDGS. When producing ethanol, DDGS has traditionally been treated as waste until it becomes a feed ingredient (Adom et al. 2012). Even so, the value of ethanol remained greater than DDGS, meaning economic allocation reduced its impact. The opposite phenomenon was seen for mass allocation, given that the amount of DDGS, compared to ethanol, produced was higher (Adom et al. 2012).
5.7 TMR feed production in relation to feedlot cattle production
Given the production of feedlot TMR is a major factor in finishing of feedlot cattle, it is important to provide insight into the impacts of feed production in relation to the entire feedlot cattle production life cycle. Stackhouse-Lawson et al. (2012) assessed the carbon footprint of California beef production systems and determined an impact of 3.80 kg CO2e/kg hot carcass weight (HCW) for a typical Angus cattle feedlot and 9.80 kg CO2e/kg HCW for a typical Holstein cattle feedlot. In order to compare the results from the present study to feedlot scenarios provided by Stackhouse-Lawson et al. (2012), information provided within the study was utilized to determine global warming impact in terms of both live weight (LW) and HCW gain (Table S7). The impact of TMR production from the present study was also converted to kg CO2e/kg LW or HCW gain (Table S7). While all three production scenarios (A, B, and C) from the present study were included in this assessment, only scenario A will be discussed as it is most similar to the scenario provided by Stackhouse-Lawson et al. (2012). In order to make comparisons possible, the present study evaluated emissions utilizing IPCC (2006) AR4 values, which were updated in 2013. While updated IPCC values may provide greater insight into the emissions from cattle specifically, feed production values would likely remain largely unchanged due to the CO2 intensive practices of the feed supply chain.
Figure 5 depicts results from both Stackhouse-Lawson et al. (2012) and the present study for Angus feedlot (Fig. 5a) and Holstein feedlot (Fig. 5b) production. It was determined that the impact of Angus feedlot production was 11.3 kg CO2e/kg LW gain and 10.6 kg CO2e/kg HCW gain (Table S7) while TMR feed production contributed 3.46 kg CO2e/kg LW gain and 5.91 kg CO2e/kg HCW gain to the total impact of the Angus feedlot. The impact of Holstein feedlot production was 9.80 kg CO2e/kg LW gain and 12.8 kg CO2e/kg HCW gain (Table S7) while TMR feed production contributed 4.09 kg CO2e/kg LW gain and 6.98 kg CO2e/kg HCW gain to the total impact of the Holstein feedlot. For each scenario, total feed emissions were compared to total feedlot emissions (Table 2). For scenario A, feed used in Angus feedlot production contributed to 76% of total Angus feedlot emissions while feed used in Holstein feedlot production contributed to 58% of total Holstein feedlot emissions.
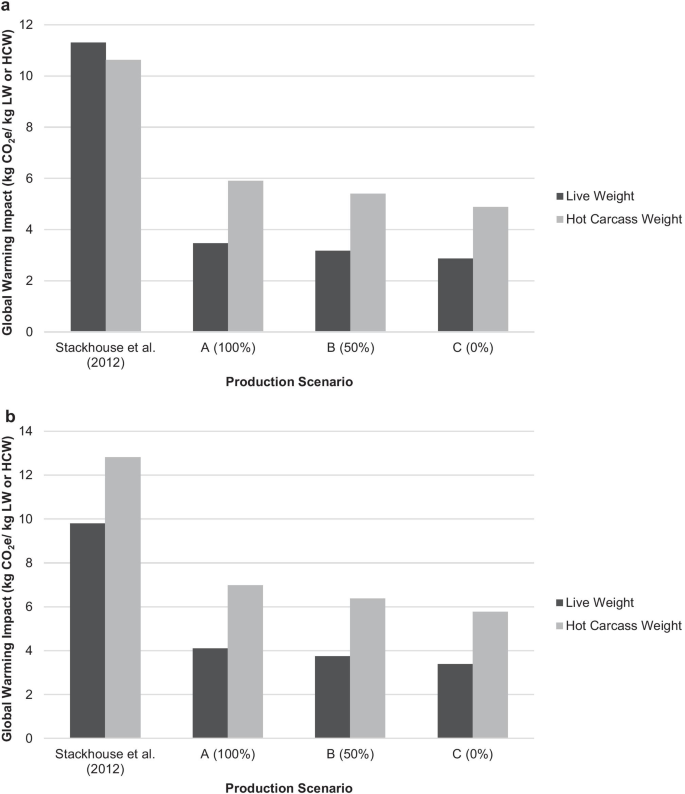
a Comparison of live weight (LW) and hot carcass weight (HCW) global warming impact (kg CO2e/kg LW or HCW) results from Angus feedlot production scenarios. First, a life cycle assessment (LCA) for Angus feedlot cattle produced in CA performed by Stackhouse et al. (2012). Second, a LCA for a finisher total mixed ration (TMR) supply chain in CA with Angus Feedlot scenarios A, B, and C. b Comparison of live weight (LW) and hot carcass weight (HCW) global warming impact (kg CO2e/ kg LW or HCW) results from Holstein feedlot production scenarios. First, a life cycle assessment (LCA) for Holstein feedlot cattle produced in CA performed by Stackhouse et al. (2012). Second, a LCA for a finisher total mixed ration (TMR) supply chain in CA with Holstein Feedlot scenarios A, B, and C
In a more recent study, Rotz et al. (2019) performed a cradle-to-farm gate LCA of the entire USA beef production chain. The study divided the USA into seven regions, modeling the most representative production scenarios across the country. Of these regions, California was grouped into the Southwest region along with states such as Arizona and Utah. The study calculated a carbon footprint of 20.2 kg CO2e/kg carcass weight (CW) for the Southwest. When including Holstein steers in production, the value decreased to 17.6 kg CO2e/kg CW in the Southwest. While these values are higher than those reported by Stackhouse-Lawson et al. (2012), they demonstrate that inclusion of Holstein steers reduces emission intensity, consistent with results from the present study.
Rotz et al. (2019) also concluded that the production of resources for beef cattle was a large contributor to emissions, especially for upstream resources like feed production. Given ingredients like corn account for 83–85% of GHG emissions for finisher feed, as determined by the present study, this highlights an area of potential improvement. Reducing dependency on corn or increasing yield per unit land becomes important means of improving the sustainability of the beef sector (Asem-Hiablie et al. 2019). It is important to note that feedlot cattle are not kept on a single ration for the duration of their time at a feedlot. The present work focused on the finisher ration as this is the ration that cattle spend the greatest amount of time on and that contributes most to daily growth of the animals. As shown in Table 1, animals typically transition between three diets: starter, intermediate, and finisher. The composition of each ration depends on the phase of growth for each animal and, therefore, the proportion of each TMR ingredient. Corn, given its higher emission intensity and high inclusion rates in finisher diets, as shown by this study, would likely have a lower contribution in the other two diets. For alfalfa, the opposite would be expected. Finisher cattle had relatively low inclusion of alfalfa in their TMR, whereas starter and intermediate diets require higher levels of forage. This would result in a greater contribution of alfalfa to the carbon footprint of the different feedlot TMRs.
Asem-Hiablie et al. (2019) performed a similar beef LCA. For feed production, the study calculated 7.42 kg CO2e/consumer benefit (CB: defined as 1 kg of consumed, boneless edible beef in the USA). Compared to the results of the present study, Asem-Hiablie et al. (2019) had higher carbon footprint which can be attributed to the study’s broader system boundary. While the present study was cradle-to-farm-gate, Asem-Hiablie et al. (2019) were cradle-to-consumer, including processes beyond the farm and into packaging and processing of beef. Furthermore, Asem-Hiablie et al. (2019) performed allocation for wet distiller’s grains. Mass allocation increased the associated impacts whereas economic allocation decreased it. This confirmed a similar finding in the present study that the use of mass allocation has a large impact on carbon footprints. Even so, this analysis demonstrates that TMR feed production is likely a significant contributor of emissions to the total life cycle of feedlot cattle production. As such, it is important to further assess each stage of feed production and determine where in the feed production supply chain emissions can be minimized.
6 Conclusions
The goal of the present LCA was to determine the climate change impact from the feed supply chain associated with production of 1 kg total mixed ration (TMR) for a finisher ration typical fed to feedlot cattle in California, USA (in kg CO2e/kg TMR). The present LCA was completed following LEAP guidelines (FAO 2016a). Total GHG emissions were determined to be 0.630 kg CO2e/kg TMR for Scenario A, the scenario in which LEAP guidelines were most closely followed. Corn production, transportation, and LPM production were the main contributors to the life cycle impacts of TMR production.
The use of fertilizers and pesticides had the greatest impact of emission from corn production. The use of fertilizers and pesticides in corn production may need to be more closely examined in order to minimize life cycle impacts associated with production. It is important to note that more specific data on fertilizer and pesticide inputs in corn production are desirable. As mentioned, the data used for these inputs were not specific to corn grain production, and the application rates were estimated based on the given information.
One reason transportation had such a considerable impact on the total life cycle of TMR production is the assumption that 100% of additional transport for empty loads was needed. This essentially doubled the calculated impacts of transportation, given that the three proposed transportation scenarios within this work spanned a large spectrum of potential transportation outcomes. While Scenario A was considered the most extreme and therefore the least likely of the three, this does not mean it would be impossible. The wide range in resulting carbon equivalents (Fig. 2) also showed that depending on the approach taken to calculate backhaul transportation, the potential for error was great. It would be beneficial to have information on what happens with transportation vehicles once required feeds are delivered to the mill site in order to better assess the impacts of transportation. Some feed mills might rely on feeds coming from thousands of miles away, via rail and/or truck, which could include significant sources of emissions that were previously being overlooked due to lack of information or extreme assumptions.
Liquid premix and micronutrient production were determined based on the best fitting ecoprofile and were not specifically assessed due to a lack of information. It will be necessary in future studies to obtain more accurate information on the ingredients and how they are processed in order to develop the most accurate emission factors and profiles for the contribution to TMR production. Similarly, it would be beneficial to have more detailed information on remaining TMR ingredients in order to most accurately represent the supply chain. The LEAP guidelines (FAO 2016a) do not presently provide information on assessing the production of feed additives; however, given the significant impact LPM has on the overall TMR production emissions profile and the uncertainty around the data accuracy, it would be beneficial to incorporate feed additives into future guidelines.
Feed production may contribute 48 to 76% of the life cycle emissions associated with the production of feedlot cattle. This demonstrates a need to better assess the feed supply chain in order to accurately identify areas within the supply chain that have the most significant impacts on overall emissions. Further analysis of the feed supply chain may help to inform producers of which feeds to purchase and, possibly more importantly, where to purchase feeds. This may aid in minimizing the impacts associated with feed production and, by extension, beef production.
With the exception of Naranjo et al. (2020), which focused on dairy cattle feed, there are no peer-reviewed LCA following LEAP guidelines (FAO 2016a) for cattle feed production to date, it can be assumed that the present study is the first of its kind. As such, the present study may serve as a tool for future LCA practitioners to utilize and may inform future decisions for improvements or modification of the LEAP guidelines (FAO 2016a).
References
Adom F, Maes A, Workman C, Clayton-Nierderman Z, Thoma G, Shonnard D (2012) Regional carbon footprint analysis of dairy feeds for milk production in the USA. Int J LCA 17:520–534. https://doi.org/10.1007/s11367-012-0386-y
Adom F, Workman C, Thoma G, Shonnard D (2013) Carbon footprint analysis of dairy feed from a mill in Michigan, USA. Int Dairy J 31:S21–S28. https://doi.org/10.1016/j.idairyj.2012.09.008
Asem-Hiablie S, Battagliese T, Stackhouse-Lawson KR, Rotz CA (2019) A life cycle assessment of the environmental impacts of a beef system in the USA. Int J LCA 24:441–455
Battagliese T, Andrade J, Schulze I, Uhlman B, Barcan C (2013) More Sustainable Beef Optimization Project: Phase 1 Final Report. BASF Corporation, Florham Park, NJ
Beauchemin KA, Janzen HH, Little SM, McAllister TA, McGinn SM (2010) Life cycle assessment of greenhouse gas emissions from beef production in western Canada: a case study. Agric Syst 103:371–379. https://doi.org/10.1016/j.agsy.2010.03.008
Beauchemin KA, Janzen HH, Little SM, McAllister TA, McGinn SM (2011) Mitigation of greenhouse gas emissions from beef production in western Canada - evaluation using farm-based life cycle assessment. Anim Feed Sci Technol 166–67:663–677. https://doi.org/10.1016/j.anifeedsci.2011.04.047
Casey JW, Holden NM (2006a) Greenhouse gas emissions from conventional, agri-environmental scheme, and organic Irish suckler-beef units. J Environ Qual 35:231–239. https://doi.org/10.2134/jeq2005.0121
Casey JW, Holden NM (2006b) Quantification of GHG emissions from sucker-beef production in Ireland. Agric Syst 90:79–98. https://doi.org/10.1016/j.agsy.2005.11.008
FAO (2016a) Environmental performance of animal feeds supply chains: guidelines for assessment, 1 edn. FAO, Rome, Italy
FAO (2016b) Developing sound tools for transition to sustainable food and agriculture: methodological notes, 1 edn. FAO, Rome, Italy
FAO (2020) Environmental performance of feed additives in livestock supply chains, 1 edn., FAO, Rome, Italy. https://doi.org/10.4060/ca9744en
Hill J, Nelson E, Tilman D, Polasky S, Tiffany D (2006) Environmental, economic, and energetic costs and benefits of biodiesel and ethanol biofuels. PNAS 103:11206–11210. https://doi.org/10.1073/pnas.0604600103
IPCC (2006) 2006 IPCC guidelines for national greenhouse gas inventories. Prepared by the National Greenhouse Gas Inventories Programme, IGES, Japan
IPCC (2007) Climate Change 2007: impacts, adaptation and vulnerability. contribution of working group II to the fourth assessment report of the intergovernmental panel on climate change. Cambridge University Press, Cambridge, UK
ISO (2006) ISO 14044, 2006 Environmental management- life cycle assessment- requirements and guidelines 1 International Organization for Standardization Genevea, Switzerland
Landis AE, Miller SA, Theis TL (2007) Life cycle of the corn-soybean agroecosystem for biobased production. Environ Sci Technol 41:1457–1464. https://doi.org/10.1021/es0606125
Long RF, Leinfelder-Miles M, Putnam D, Klonsky KM, Stewart D (2015) Sample Costs to Establish and Produce Alfalfa Hay: In the Sacramento Valley and Northern San Joaquin Valley – Flood Irrigated – 2015. University of California, Department of Agricultural and Economics, Davis, CA, UC Cooperative Extension
Long RF, Orloff SB, Klonsky KM, De Moura RL (2013) Sample Costs to Establish and Produce Organic Alfalfa Hay in California – 2013. University of California, Department of Agricultural and Economics, Davis, CA, UC Cooperative Extension
Naranjo A, Johnson A, Rossow H, Kebreab E (2020) Greenhouse gas, water, and land footprint per unit of production of the California dairy industry over 50 years. J Dairy Sci 103:3760–3773. https://doi.org/10.3168/jds.2019-16576
NASS (2014) 2014 Corn and potatoes chemical use survey. National Agricultural Statistics Service, United States Department of Agriculture
NASS (2015) USDA National Agricultural Statistics Service Quick Stats Database. National Agricultural Statistics Service. http://quickstats.nass.usda.gov/. Accessed September 2015
Nguyen TLT, Hermansen JE, Mogensen L (2010) Environmental consequences of different beef production systems in the EU. J Clean Prod 18:756–766. https://doi.org/10.1016/j.jclepro.2009.12.023
Nguyen TTH, Van der Werf HMG, Doreau M (2012a) Life cycle assessment of three bull-fattening systems: effect of impact categories on ranking. J Agric Sci 150:755–763. https://doi.org/10.1017/s0021859612000123
Nguyen TTH, van der Werf HMG, Eugene M, Veysset P, Devun J, Chesneau G, Doreau M (2012b) Effects of type of ration and allocation methods on the environmental impacts of beef-production systems. Livest Sci 145:239–251. https://doi.org/10.1016/j.livsci.2012.02.010
O'Leary M, Rehm G, Schmitt M (2013) Providing proper N credit for legumes. https://www.extension.umn.edu/agriculture/nutrient-management/nitrogen/providing-proper-n-credit-for-legumes/. Accessed September 2015
Orloff SB, Klonsky KM, Tumber KP (2012a) Sample Costs to Establish and Produce Alfalfa: Intermountain Region – Siskiyou County, Butte Valley – Center Pivot Irrigation – 2012. University of California, Department of Agricultural and Resource Economics, Davis, CA, UC Cooperative Extension
Orloff SB, Klonsky KM, Tumber KP (2012b) Sample Costs to Establish and Produce Alfalfa: Intermountain Region – Siskiyou County, Scott Valley – Mixed Irrigation – 2012. University of California, Department of Agricultural and Resource Economics, Davis, CA, UC Cooperative Extension
Pelletier N, Pirog R, Rasmussen R (2010) Comparative life cycle environmental impacts of three beef production strategies in the Upper Midwestern United States. Agric Syst 103:380–389. https://doi.org/10.1016/j.agsy.2010.03.009
Peters GM, Rowley HV, Wiedemann S, Tucker R, Short MD, Schulz M (2010a) Red meat production in Australia: life cycle assessment and comparison with overseas studies. Environ Sci Technol 44:1327–1332. https://doi.org/10.1021/es901131e
Peters GM, Wiedemann S, Rowley HV, Tucker R, Feitz AJ, Schulz M (2011) Assessing agricultural soil acidification and nutrient management in life cycle assessment. Int J LCA 16:431–441. https://doi.org/10.1007/s11367-011-0279-5
Peters GM, Wiedemann SG, Rowley HV, Tucker RW (2010b) Accounting for water use in Australian red meat production. Int J LCA 15:311–320. https://doi.org/10.1007/s11367-010-0161-x
Plevin RJ, Delucchi MA, Creutzig F (2013) Using attributional life cycle assessment to estimate climate-change mitigation benefits misleads policy makers. J Ind Ecol 18:73–83. https://doi.org/10.1111/jiec.12074
Putnam D, Long RF, Leinfelder-Miles M, Klonsky KM, Stewart D (2014) Sample Costs to Establish and Produce Alfalfa Hay: In the Sacramento Valley and Northern Delta – 2014 – Sub-Surface Drip Irrigation (SDI). University of California, Department of Agricultural and Economics, Davis, CA, UC Cooperative Extension
Rotz CA, Asem-Hiablie S, Place S, Thoma G (2019) Environmental footprints of beef cattle production in the United States. Agric Syst 169:1–13. https://doi.org/10.1016/j.agsy.2018.11.005
Shapouri H, Gallagher PW, Nefstead W, Schwartz R, Noe S, Conway R (2010) 2008 Energy balance for the Corn-Ethanol Industry. U.S. Department of Agriculture
SimaPro (2009) SimaPro 7.1 LCA software. PRé Consultants
Stackhouse-Lawson KR, Rotz CA, Oltjen JW, Mitloehner FM (2012) Carbon footprint and ammonia emissions of California beef production systems. J Anim Sci 90:4641–4655. https://doi.org/10.2527/jas.2011-4653
Wang MQ (2001) Development and use of GREET 1.6 fuel-cycle model for transportation of fuels and vehicle technologies. Argonne National Laboratory, Argonne, IL
Acknowledgements
The authors would like to acknowledge Dr. Greg Thoma for his guidance in regards to data collection and inventory setup. The authors would also like to acknowledge Dr. Alyssa Kendall for her guidance on using the EcoinventTM database and on transportation-related impacts. Finally, the authors would like to acknowledge Neena Kashyap and Ellen Lai for their help in the extensive literature review necessary prior to beginning data collection.
Author information
Authors and Affiliations
Corresponding author
Additional information
Communicated by: Brad G. Ridoutt
Publisher's Note
Springer Nature remains neutral with regard to jurisdictional claims in published maps and institutional affiliations.
Supplementary information
Below is the link to the electronic supplementary material.
Rights and permissions
Open Access This article is licensed under a Creative Commons Attribution 4.0 International License, which permits use, sharing, adaptation, distribution and reproduction in any medium or format, as long as you give appropriate credit to the original author(s) and the source, provide a link to the Creative Commons licence, and indicate if changes were made. The images or other third party material in this article are included in the article's Creative Commons licence, unless indicated otherwise in a credit line to the material. If material is not included in the article's Creative Commons licence and your intended use is not permitted by statutory regulation or exceeds the permitted use, you will need to obtain permission directly from the copyright holder. To view a copy of this licence, visit http://creativecommons.org/licenses/by/4.0/.
About this article

Cite this article
Werth, S.J., Rocha, A.S., Oltjen, J.W. et al. A life cycle assessment of the environmental impacts of cattle feedlot finishing rations. Int J Life Cycle Assess 26, 1779–1793 (2021). https://doi.org/10.1007/s11367-021-01957-3
Received:
Accepted:
Published:
Issue Date:
DOI: https://doi.org/10.1007/s11367-021-01957-3