
Abstract
Scientometric assessments of Open Educational Resources (OER) offer a way to quantitatively represent teaching in higher education through openly available and accessible artefacts. They could serve science policy monitoring and lead to greater visibility of higher education teaching in a recognition and reward system. In this context, we discuss possible statistics for OER. In a pre-study, a first version of OER indicators was discussed in three focus groups. The findings of these discussions were incorporated into the creation of a more comprehensive second version of a framework for OER statistics, which was evaluated in detail in six expert interviews. After incorporating changes as a result of the evaluation, a third version of the framework for OER statistics emerged that enables scientometric measurements of OER, while considering the common criticisms of scientometric measurements. The framework comprises an individual level, which recognizes all OER created by an individual, and an institutional level, which serves to quantify OER created by an institution. At the individual level, productivity, cooperation, resonance, openness, altmetric and transfer indicators are available. In addition, we record dichotomously whether an OER certification exists. At the institutional level, additional support indicators are proposed to recognize achievements in the development and maintenance of OER-promoting structures at institutional level.
Introduction
Historically, teaching is a primary goal of universities, yet it is often ignored in evaluations of science or rankings of science institutions (e.g., the evaluation of the excellence strategy in Germany; Möller et al., 2015). We think there is an imbalance regarding an academic community’s claim to provide good teaching and to support the next generation on the one hand, and the lack of appreciation on the other hand. Teachers who invest a lot of time and effort in their lectures tend to be punished by being evaluated poorly as they have less time to conduct research and to publish findings. We therefore explore potential performance indicators that measure teaching activities.
In addition to investigating the lack of appreciation of teaching, which goes hand in hand with the lack of consideration in performance evaluations, we also address the implementation of open scholarship strategies with the potential performance indicators for university teaching. As open scholarship encompasses the disclosure of all scholarly practices, processes and products, it also explicitly includes the open design of teaching (Mayrberger & Thiemann, 2018; Tennant et al., 2019).
Teaching practices seem to be largely cut off from other efforts in science to make activities and results open and to value these efforts also by means of performance indicators. Yet, openness is demanded by the scientific communities and highly encouraged and supported by policy-makers (European Commission, 2019).
The measurement of open teaching/learning materials is particularly conceivable in the context of the growing community of Open Educational Resources (OER) supporters. OER represent open learning/teaching resources and research materials that can be shared, edited, processed and redistributed depending on the degree of openness (UNESCO, 2019). OER provide unrestricted access to learning resources. For teachers, OER can also be seen as an opportunity to gain recognition for their efforts in teaching, as their activities in this regard become visible through open practices and OER. Moreover, openly licensed learning and teaching materials offer opportunities for exchange among teachers and the corresponding discussion of open questions (D’Antoni, 2009).
From a scientometric point of view, OER offer the possibility to analyze freely accessible teaching material and thus to expand academic performance evaluation to include teaching activities. This approach to broaden the basis for evaluation of science is for example reflected in the German Research Foundation (DFG) demand. In May 2022, the DFG published a position paper calling for research funders to broaden the range of accepted publication formats and to use scientometric indicators in a less restricted way. There are also calls for alternative systems of reputational attribution to be strengthened (DFG, 2022). The DFG’s statements relate purely to scientific research output, in particular publications, but not to learning and teaching materials from the field of higher education teaching. The reform movement of Responsible Research Assessment (RRA) (Owen et al., 2012) takes a step further, as seen, for example, in the Coalition for Advancing Research Assessment (CoARA, 2022) and related projects (Open and Universal Science Project—Research Assessment Framework (OPUS RAF; O’Neill, n/a), GraspOS Open Science Research Assessment Framework (OSAF, 2023), and others). These initiatives and guidelines emphasize the importance of responsible use of scientometric performance evaluation, the inclusion of openness practices in this regard and the consideration of non-research related output such as teaching. In this context, we aim to develop a framework that makes OER accessible to quantitative performance evaluation. We do not intend to offer a stand-alone measurement tool, but a complementary instrument to qualitative peer evaluations. The following research question is addressed: What are appropriate statistics to meaningfully quantify OER, and how do these statistics need to be embedded?
In order to pursue the research question, we introduce a theoretical classification in a larger context. “Responsible Research Assessment (RRA)” Sect. presents the measurement of openness and relates to Responsible Research Assessment. Furthermore, we present a basic definition of OER in “Open Educational Resources (OER)” Sect. As a first version of the OER statistics we conducted a pre-study with scientometric and/or OER experts to examine the meaningfulness and suitability of quantitative OER indicators for the aim of making teaching efforts more visible in the course of research assessments (see “First version (pre-study)” Sect. and: Kullmann & Weimer, 2023). We then developed our second version of the OER statistics framework which we describe in “Second version” Sect. To evaluate this second version, we interviewed six experts from the scientometric field. The discussion and outcome are outlined in the third and final version (“Third version” Sect.). “Conclusion” Sect. summarizes the results and provides an outlook.
Theoretical background
Responsible Research Assessment (RRA)
Openness in the science sector is regarded as an important value and is supported at high political level (European Commission, 2019). Open scholarship indicators can be one means of exploring and monitoring the development towards open science practices (European Commission, 2017a). The scientometric measurement instruments record openly accessible products and practices and can provide insights into how openly a person, institution or country is working. The Open Science Monitor (European Commission, 2023a), for example, tracks the development of open practices in Europe by monitoring open access publications, open research data and open collaboration on the level of EU countries and individual disciplines. In this case, scientometric recording is used for monitoring. Scientometric indicators are known to have a steering effect. Products and practices that are recorded scientometrically in academic performance measurements are visualized and possibly also rewarded. Consequently, there are positive effects for academics if they orient their academic practices to an existing recognition and reward system (Hicks et al., 2015). In this case, the indicators also work as an incentive structure (Pampel et al., 2020).
Open Scholarship indicators predominantly focus on research practices and products (including open data, open code, open peer review, etc.; Weimer et al., 2023). The RRA movement has triggered a discussion about the shortcomings of current reward and recognition systems in science and a change towards a broader view of performance can be observed (cf. e.g., DORA, 2019; VSNU et al., 2019). In this context, at the evaluation level of academics, reference should be also made to “Academic careers understood through measurement and norms” (ACUMEN; European Commission, 2023b) and the “Open Science Career Assessment Matrix” (OS-CAM; see: European Commission, 2017b). By including teaching indicators, both approaches fundamentally making teaching activities visible and appreciating them, they act as incentives. The ACUMEN portfolio allows academics to present their own academic achievements in a multi-layered and inclusive way. For example, the creation of textbooks, online courses, teaching awards and the number of views of teaching presentations can be indicated there and thus made visible. OS-CAM also presents a performance assessment that takes openness factors into account. Teaching activities can be categorized as teaching, mentoring and supervision. Unlike the Open Science Monitor, ACUMEN and OS-CAM both operate at the level of individual academics but are not based on quantification.
RRA should be mentioned that originated from frameworks like the OPUS RAF, OSAF and the SCOPE Framework for Research Evaluation (SCOPE; INORMS, 2021). RAF promotes open science practices and improves research assessment by providing a more comprehensive and inclusive approach to assessing research. By incorporating open science indicators and other quantitative and qualitative metrics, RAF aims to provide a flexible and adaptable research assessment framework, including teaching. OSAF aims to provide options for how indicators and tools used in a particular evaluation setting can consider the specificities of evaluation contexts, which may be rooted in disciplinary and institutional specificities and the level at which an evaluation takes place (e.g., individual level, level of group of researchers, institutional level). Whereas RAF and OSAF aim at the operational level, SCOPE is located at a more general level presenting a step-by-step process to support evaluators by implementing Responsible Research Assessment principles for robust research evaluations—SCOPE thus draws a larger picture for research assessments.
Open Educational Resources (OER)
OER represent a new and complex object of measurement for scientometric analyses that has so far rarely been mentioned as a performance indicator (Weimer et al., 2023). Kullmann (2023, under review) examines OER special features against the background of scientometrics. Eight significant attributes with different characteristics (see Fig. 1) are identified. The degree of openness as a central characteristic of OER as open teaching/learning resources comprises four different levels with different subsequent rights of use granted by the author. The resource type refers to the concrete representation of an OER (e.g., figure, slides, textbook). As reusable resources, OER can build on previous versions and modify them to a greater or lesser extent. It is also possible to remix different OER to create a new OER. A sufficient level of creation of OER is a special characteristic in the context of scientometric measurement. Authorship should be mentioned as a further characteristic. As with scientific publications, multi-authorships (group authorships) are possible in addition to single authorships. Particularly in the case of complex OER, additional contributors can provide services as part of the creation of an OER. OER do not have a clear target group and are aimed at both teachers and learners, thus sufficient quality is an important feature. In order to describe the diversity of OER and to categorize them according to their complexity, granularity is important. Pedagogical characteristics as well as usage data can be considered as further features. Although all of these characteristics are important in the context of scientometric analyses, the degree of openness, resource type, level of creation and quality play a special role in defining OER for scientometric purposes.

Main OER features of interest for scientometric analysis (Kullmann, 2023, under review)
Openness as a central feature of OER can vary. The Creative Commons (CC) licences established in the OER sector allow OER authors the option of assigning different degrees of openness and thus subsequent options of use for a resource. The most open licence is CC-0, which assigns all rights of use without naming the author. The least open CC licence comes very close to the copyright law regulations and is correspondingly restrictive with regard to use scenarios and modifications of the resource. In addition, teaching/learning resources that are not openly CC-licensed can also be considered to be open if they are available and accessible free of charge, i.e., can be found by third parties and used in teaching/learning contexts. The question of authorship and level of creation of OER goes hand in hand with openness. Through the OER lifecycle, CC-licensed OER can be reused or remixed within the framework, which leads to a new version of the original resources. In order to include only those OER in scientometric analyses for which creators can also claim authorship, a sufficient level of creation is an important characteristic of OER.
The generally accepted definitions of OER (Atkins et al., 2007; UNESCO, 2012; Orr et al., 2015) define the term very broadly and also comprise artefacts that are not explicitly created for teaching and/or learning contexts. In order to fulfil the purpose of making open teaching/learning resources visible through OER statistics, it is therefore necessary for scientometric purposes to restrict the definition to materials that have been created specifically for teaching/learning purposes. Since teaching/learning objects can have a wide range of concrete representations (from a figure or photo to a MOOC), Kullmann (2023, under review) proposes a division into three categories instead of defining individual measurable resource types. The category Dedicated Learning Content (DLC) includes all committed materials created for learning purposes. Learning Design Content (LDC) includes all artefacts that can support teachers in their work (e.g., syllabi, lists of references, software environments for creating learning content). As OER categorized in DLC can vary greatly in complexity, i.e., granularity in am OER context, a classification according to four different levels of granularity is proposed to make these differences explicit. The levels of granularity are taken from relevant metadata profiles for OER (see Table 1).
The third category, called OER ecosystem, includes all contributions to an OER-promoting infrastructure that makes it easier for authors to create and publish OER, e.g., OER repositories, training or funding for the creation of open teaching/learning resources.
Another important characteristic is the sufficient quality of OER, which can be determined procedurally in various ways. Formal testing procedures (IQOer by Müskens et al., 2022) or simpler approaches, e.g., by determining the author’s level of qualification (training, activity or, e.g., OER certification), are proposed as possible measures. In the case of a formal quality assessment via the IQOer measuring instrument, pedagogical characteristics would already be considered.
The analysis of OER as an object of measurement results in a definition that considers the special features of OER in the context of scientometric analyses:
OER are publicly available, freely accessible materials that have been created specifically for teaching/learning purposes and are of sufficient quality and level of creation. OER are divided into the categories of Dedicated Learning Content for learning materials primarily intended for learners, and Learning Design Content for supporting materials for teachers. OER also include contributions to a supportive OER ecosystem that facilitates the creation, use and dissemination of OER. This includes, for example, infrastructure elements developed for open teaching/learning purposes, such as OER repositories, OER-supportive working environments, editorial work, consulting services, training and other support services for OER authors.
This definition is fundamental to the development of the framework for OER statistics presented below.
Development of the OER statistics
Below, we show the conceptualization of OER statistics. Figure 2 shows that the development happened in three phases. The first version of the OER statistics represents a very rough idea to quantify open educational material. In summer 2022, we discussed this first version in focus groups as part of a pre-study (see “First version (pre-study)” Sect.). A more complex version of the framework then emerged (second version; see “Second version” Sect.). We developed this in late 2022/early 2023 and evaluated it in September 2023 subject to six expert interviews. This third version is introduced in “Third version” Sect. Please note that the third version of the OER statistics is not a final and rigid version yet, the framework is dynamic and can and must be adapted and adjusted over time. This is especially due to the constantly changing scientific and technological landscape. Thus, both publication and citation practices are changing, as are the possibilities for uploading OER and drawing attention to them. These changes are considered in the further development of the framework.

Development of OER statistics in three phases
First version (pre-study)
Basis for discussion
The pre-study presents the very first draft of the OER statistics. We can see in Fig. 3 that the OER statistics are derived from established open access (OA) indicators. A table shows that the counting of OA products is contrasted with the counting of OER. This very first version of the OER statistics shows the origin of the rough idea.

First version of the OER statistics
Method
To discuss the rough idea and the idea of scientometrically capturing OER with the scientific community, we ran three online focus group discussions between May and July 2022. Each group comprised three to six experts in scientometrics and/or in open scholarship and OER. The discussions lasted no longer than two hours. In total, 13 participants attended. At first, we showed a short presentation of the topic and the first, very rough draft of scientometric indicators for OER as outlined in Fig. 3. It is important to stress that the purpose of the focus group discussions was not to discuss the sketched, first draft OER indicators in detail. We aimed to clarify if OER indicators were suitable in making higher education efforts more visible and highlight potential effects and impacts of such indicators. To facilitate an open discussion among the participants, no further guideline was issued. Interventions were limited to answering participant’s questions and resolving ambiguities.
Discussions and outcomes
In the focus groups, the questions of the suitability of OER and an OER indicator for making higher education teaching visible as well as the expected positive and negative effects of OER statistics were discussed (for the questions see Fig. 3). A clear position shared by all participants on these questions cannot be derived. The complex outcome can be presented as follows: OER represent a part of teaching, but not teaching practice in its entirety. The openness of OER makes them visible and accessible for outsiders. They are thus fundamentally suited to making teaching visible as part of science, in analogy to research. However, the relationship between OER and teaching in general requires further investigation.
Qualitative procedures for science evaluation should be given preference due to the inadequacies of quantitative procedures, especially with regard to the lack of statements on the quality of work results. Also, scientometric indicators for OER cannot make qualitative statements about the underlying resources, which is why scientometrics in performance evaluation should only be seen as an accompanying instrument, never as a stand-alone assessment criterion. Against the background of the resource-related impossibility of proceeding purely qualitatively in the evaluation of scientific achievements, there is still justification for quantitative methods. Particularly in the current situation, where quantitative methods predominate, statistics of OER could contribute to making OER, and thus also teaching, relevant for a framework of science evaluation.
OER measurement is very complex. In particular, the property of changeability, which can always lead to new versions by editing and mixing OER with other resources, raises questions about the appropriate consideration of contributors and the attribution of reputation. Furthermore, there are currently structural obstacles such as a lack of citation practices for teaching/learning materials in general and an infrastructure that is not fully suitable for easily applicable quantitative analysis. For example, citation data is not available in a structured and easily processable format. The same problem occurs in relation to the citation of research data, and metadata can currently not be downloaded for further use.
Looking at potential OER statistics, the significance and importance of the measurement results achieved need to be classified against the background of the measurement objective (making teaching more visible). With regard to the measurement levels, the institutional level is particularly interesting. Here, an OER indicator set could contribute to the development and presentation of teaching profiles for higher education institutions. Furthermore, a cultural change towards open teaching could be visualized via OER statistics. Measurements at the teachers’ individual levels are viewed critically due to the negative experiences from the research area.
In developing the potential OER statistics, the ten principles of the Leiden Manifesto (Hicks et al., 2015) should be considered. Based on the discussions held in the focus groups, these include in particular the demands for support of qualitative methods through scientometric applications (Principle 1), the consideration of discipline-specific subject cultures (Principle 6) as well as the individual appreciation of achievements in addition to scientometrically determined indicators. A transfer of the Leiden Manifesto principles related to the world of scholarly publishing to the world of OER is imperative.
As an alternative to OER indicators, there are other qualitative evaluations of teaching (e.g., portfolios). At this point, it is necessary to clarify how these can find their way into a science evaluation. With regard to potential OER indicators, it is interesting to see how the two approaches can complement each other in terms of an informed peer review. The participants in the focus group discussions clearly rejected simplified scientometric indicators for OER like counting without the consideration of the special characteristics of the measurement object OER. They argued in line with the position paper of the German Research Foundation, which rejects the limited use of bibliometric indicators and promotes a more comprehensive science assessment (DFG, 2022). Despite many concerns, however, a balanced set of OER indicators, especially at certain levels of measurement (e.g., at the level of institutions), was considered useful by the focus groups. Likewise, a combination of qualitative and quantitative methods to make teaching visible and appreciated as a separate performance category of science assessment was viewed positively.
From our point of view, the estimation of different effects and impacts of the OER statistics by the focus group participants is justified and enriching. Some criticism, on the other hand, is directed less against the use of scientometric indicators on the subject of OER, but rather against the abuse of scientometric indicators in general. These dangers are well known to the scientometric community and are considered in the practice of responsible scientometrics. The detailed results of the preliminary study are summarized in Kullmann and Weimer (2023). Building on these outcomes, we developed the second version of the OER statistics.
Second version
Basis for discussion
The development of the OER statistics framework is rooted in the results of the pre-study (Kullmann & Weimer, 2023), the examination of OER as a measurement object (Kullmann, 2023, under review) and the general methodological basis for scientometrics.
Following the preliminary study, we embedded the pure statistics in a context. Figure 4 shows that the second version of the framework of OER statistics can be divided into four parts. The first part is called “Methodological Basis”, referring to fundamental scientometric approaches and decisions, which always have to be considered in relation to such analyses. Part two is called “OER Statistics” and relates to the actual metrics. Part three is called “use cases” and considers where the OER statistics can be applied. The last part is called “Limitations” and refers to the restrictions of the OER statistics that should always be considered in the analysis.
-
(1)
The methodological basis of the second version of the framework (part one in Fig. 4) is represented by the used data basis, the document types which are quantified, weighting procedures to give some artefacts more importance in comparison to others (weighting and counting), subject classification and normalization procedures for comparisons between different disciplines, the dealing with citation windows and self-citations and the necessity to determine the exact way of calculating indicators by naming data and instruments like software and code (Fig. 4). When transferred to the world of OER, we adjusted this generally accepted methodological basis which led to a change of terminology. The term “citation” was replaced with “attribution” as the equivalent for CC-licensed artefacts to the reference practice of research publications (Creative Commons, 2022).
-
(2)
Centrally, the framework focusses on the OER statistics with two different levels of measurement (part two in Fig. 4). The individual level enables the representation of the achievements in the OER field of individual actors. It comprises six different indicators and two different categories of measurement objects. The indicators are well known to bibliometric measurements and are adjusted to the specificities of OER: indicators for productivity, cooperation, resonance, openness, altmetrics and percentiles. The adjustment to OER is further illustrated by the use of the two categories “Dedicated Learning Content” and “Learning Design Content” instead of different document types. The summarization into categories instead of focusing on concrete artefact types has the advantage of dealing with the large variety of open teaching/learning materials in a measurable way and at the same time committing to the creation of OER in a way that can be easily recorded. In addition, four levels of granularity are introduced to categorize OER according to their complexity. This approach to describing OER was adopted from the OER world and it has the advantage of allowing depiction of differences in the complexity of measurement objects without stating values, as it would be the case with weightings. It should also be noted that highly granular, complex OER can lead to counts at all four levels of granularity, provided that the OER allows authors to split the highly granular OER into individual OER with lower levels of granularity.
Fig. 4 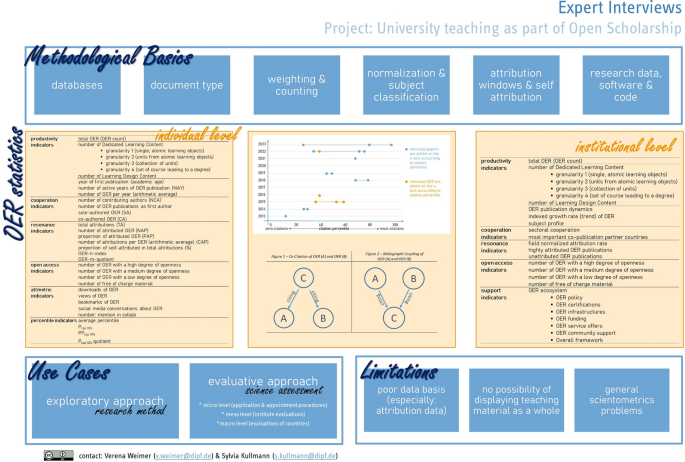
Second version of the OER statistics
The institutional level focuses on institutions that engage in open education by supporting the creation, dissemination and reuse of OER. The indicators for productivity, cooperation and resonance of the individual level can also be found here. Through these indicators, institutions such as universities can present their profile in the field of open education.
In addition, the new category of support indicators is introduced that deals with supportive activities of institutions and it presents the institution’s OER ecosystem. The OER ecosystem as outlined in the OER definition for scientometric purposes (Kullmann, 2023, under review) focus on the existence of an OER policy, OER certifications (VFNM, 2022), OER infrastructures like OER repositories, funding for OER projects, services for OER authors and activities to support the OER community.
-
(3)
The third part of the OER statistics framework are the use cases (Fig. 4). On the one hand, the OER indicators can be used as a research method in exploratory studies with dedicated research questions. On the other hand, they are suitable for evaluative purposes on an individual and an institutional level.
-
(4)
Limitations are another important area of the OER statistics framework draft and round it off (part four in Fig. 4). First of all, the general challenges of scientometric measurements documented in the Leiden Manifesto (Hicks et al., 2015) are mentioned. In addition, the currently poor data basis for OER in general is an important issue. In principle, OER repositories can be used for scientometric analyses. They usually offer an interdisciplinary range of OER in various formats and levels of granularity. However, OER repositories are currently not comparable with research databases such as Web of Science or Scopus. First of all, OER are not published by all teaching researchers or teachers in higher education but only by a relatively small number. Second, OER repositories do not usually provide attribution data. OER repositories usually only contain openly licensed artefacts. Artefacts without an open license that are available and accessible free of charge are not included in this way. Finally, OER are a part of open education but do not represent teaching in its entirety.

Taken together, these four areas (methodological basis; OER statistics; use cases and limitations) result in the second version of OER statistics (see Fig. 4). In addition to the four areas, two visualizations also appear in the second version of the framework. On the one hand, we see the visualization of a scientist’s performance based on percentile indicators. This shows the time course between 2013 and 2023 on the y-axis and the percentiles between 0 (0 citations) and 100 (highest number of citations in the period in a specific discipline) on the x-axis. The blue dots indicate the publication of a paper, the orange dots indicate the publication of an OER. The visualization shows how many publications the person published and also how these publications compare to others in the same discipline in terms of citations. The second visualization shows the theoretical concept of co-citation and bibliographic coupling of OER. It describes the transfer of the well-known concepts from scientometrics.
Method
For the evaluation of the second version of the OER statistics, we organized six expert interviews with expertise in scientometrics. The interviews took place in September 2023. Two of the interviews were conducted online, the other four were held face to face. The conversations lasted no more than one hour each. For the interviews, we prepared a presentation that shows the second version of the OER statistics framework (Fig. 4) which was introduced at the beginning. The draft was then discussed in detail with the interviewees, the four areas of the framework being addressed in detail. Our open research data in the form of interview transcripts can be found here: https://doi.org/https://doi.org/10.17026/SS/W8MDOI . The evaluation was carried out deductively, following Mayring (2015). The categories used were identical to the four dimensions of the framework, which were “methodological basis”, “OER statistics”, “use cases” and “limitations”. The analysis focused on critical remarks that could be the basis for changes in the framework. The evaluation was carried out in two stages. At first, the interviews were analyzed independently by the authors of this publication. The results were discussed and summarized in a second step, which focuses on the aspects of the expert interviews that lead to adjustments to the existing framework.
Discussion and results
The following chapter outlines the critical comments on the second version of the OER statistics framework. The changes resulting from the experts’ input are described in this context.
Methodological basis
During the expert interviews, elements of the second version of the framework were confirmed. However, there were also a number of critical comments that led to changes. The most important change is a fundamental separation between the individual and the institutional level, which goes beyond the separation regarding the concrete OER statistics and also includes the methodological basis, the use cases and limitations. Accordingly, we present the framework in the evaluated version (third version; “Third version” Sect.) on two different visualizations (Figs. 5 and 6).

Third version of the OER statistics (individual level)

Third version of the OER statistics (institutional level)
The determination of a statistical data basis is generally challenging in scientometric analyses and is associated with many uncertainties that can falsify results. This is particularly difficult with evaluative assessments of individuals. In order to avoid this methodological weakness, i.e., incorrect or incomplete data basis in individual statistics, the data base should draw on support from the individual being evaluated—see the following quote:
…we should give more responsibility to those being evaluated in kind of making sure we have the data that we need. The academics, if they feel that what they do really matters like these contributions to OER, and they feel like they deserve to be recognized and rewarded for this, then there is a responsibility on their part to make visible the work they have been doing. [...]And based on that, we should invite them or make them partly responsible for registering the things that matter to them. (cf. 2:14)
Existing systems could be used to provide such lists, such as ORCID as a public data base or also current research information systems (CRIS) as they are common at universities and research institutes (cf. 4: 23, 24). Of course, OER repositories can play a role here. However, these usually only include openly licensed artefacts and OER that can only be used free of charge but do not grant third parties any further rights of use cannot usually be found here. Consequently, the “data bases” (Fig. 4) is renamed into “use of manually compiled databases (in cooperation with those to be evaluated)” (Fig. 5). The examination of a sufficient level of creation, especially in the case of revised or remixed OER, as well as sufficient quality as entry requirements for the OER statistic, must then be carried out for the OER in the list. This qualitative approach leads to an enhancement of the methodological basis which is expressed by a new category “accompanying qualitative assessment” (Fig. 4).
The determination of the document types to be counted is very important in the context of scientometric studies. For publications, the term “document type” is very appropriate. However, teaching/learning objects such as OER can have many different representations (figures, slides, videos, tables, software etc.). The term “document” was therefore not considered to be a precise fit by the interviewees. In order to reflect this diversity in the methodological basis, the original term “document type” (Fig. 4) is changed to “open artefact type” (cf. 2: 2–3; 4: 3, 4) (Figs. 5 and 6).
The question which artefact types are considered is important in scientometrics in order to record working results provided by different counting units according to the same procedure and thus establishing comparability. The change in the recording procedure at the individual level results in further changes in the area of counting and weighting. At the individual level, all artefacts created by a person and recorded in the personal record of achievement for OER are fully counted, provided they meet the entry requirements of a sufficient level of creation and quality and are freely accessible and available. This includes OER at all levels of granularity. If a higher level of granularity OER (e.g., a textbook or course) is split into its individual parts and these lower granularity elements (e.g., chapters or figures) are also published as OER, this is explicitly permitted. The following quote stresses this point:
I like the idea of small pieces that are building others. (cf. 4:18)
Due to our changes, we dispense the categorization in terms of granularity on the individual level. In this way, we are responding to the fundamental criticism of the quantitative recording of the performance of individuals and the desire for a more qualitative assessment at this level. At the institutional level, all OER with fulfilled entry requirements are recorded in the OER statistics. The categorization into levels of granularity continues to happen here (cf. 2: 3; 4: 5, 15–16). “Attribution” is to OER what citation is to publications. Due to the adjustments to the methodological basis at the individual level described above, all OER meeting entry requirements are counted. As a logical consequence, all attributions must also be considered (cf. 2: 4–5). “Weighting and counting” (Fig. 4) is renamed “full counting of authorship and attributions” for both levels (Figs. 5 and 6).
Normalizations and subject classifications are used in scientometrics for comparisons between different domains with different publication cultures and have become established there. At the individual level, a more qualitative approach is now chosen. Therefore, comparisons based on quantitative data are no longer focused as it can be on the institutional level. While subject classifications were seen positively due to their descriptive character, the usefulness of normalizations with the aim of comparisons was seen critically:
I see value in having some subject classification for descriptive purposes. Normalization we do for comparisons. So, what we want is to compare papers in chemistry with papers in humanities, for example. Unless it’s super necessary I wouldn’t bother. (cf. 4: 6)
This perspective was supported by others (cf. 6: 14). As a consequence, “normalization & subject classification” (Fig. 4) is deleted. At the institutional level, “disclosure of well selected subject classifications” remains (Fig. 6).
For the correct interpretation of scientometric analyses, the underlying data and the tools and programming code used to perform the analyses are important. To avoid confusion, we adjust the terminology from “research data, software & code” (Fig. 4) to “disclosure of research data, software and code” (cf. 4: 10) (Figs. 5 and 6).
Investigation of OER is highly complex, which requires a specific definition for a fair attribution of artefacts and services. This should include a sufficient level of creation and quality as a basic prerequisite for the countability of OER which was also emphasized in the expert interviews:
So, one question I have is ultimately the question of quality control. When we talk about scientific publications, it’s the case that you can’t just publish in a journal, so to speak, but that ultimately journal publications are always something that is also quality-checked. How is that with OER? Who does the quality assurance there? (cf. 1: 3–4)
The broad perspective on OER with regard to their openness is important. The framework treats all artefacts as OER which are created for learning/teaching purposes and are freely accessible and available. An open license is not necessary as long as the artefact can be accessed and used free of charge. Furthermore, it is important that OER can be clearly identified in scientometric analyses (cf. 1: 6). Accordingly, “consideration of OER requirements (persistent identifier; sufficient level of quality; sufficient level of creation)” was added to the framework for the individual and institutional level (Figs. 5 and 6).
OER statistics
Changes have also occurred in the area of OER statistics and their metrics. These derive in particular from the fundamentally stricter separation between the individual and institutional levels and the resulting different methodological bases.
At the individual level, the weaker emphasis on quantitative recording and a more qualitative assessment of service provision leads to an abandonment of the categorization of OER in terms of granularity with regard to the productivity indicators (cf. 2: 6, 7). For this, qualitative methods are included (cf. 1: 13–14; 2: 4), which at the same time leads to a new box “accompanying qualitative assessment” (Figs. 5 and 6). The following quote suggests the desirable integration of qualitative measures:
And by starting from some of these fundamental notions of what quality in that area means to then consider how can we demonstrate that quality in some kind of evidence that could be used in evaluations. […] Typically, then the alternative would be narratives for instance. (cf. 3:3)
At the institutional level, however, the categories regarding levels of granularity remain (cf. 4: 18, 19). We argue that qualitative assessment at institutional level is no longer possible in detail and therefore coarser classifications are appropriate. Maintaining granularity can be useful in this context to give an impression of teaching performance. Nevertheless, qualitative methods can also be used at institutional level. In this case, a report on teaching practices that also addresses OER as a component of open teaching practice would be conceivable. An institution’s teaching profile could be described in these reports.
Percentiles could help in the evaluation of the position of an assessed entity (publication or researcher) within a citation distribution of their field (Waltman & Schreiber, 2013; Bornmann & Marx, 2014). For the calculation, a high-quality data basis is necessary. Percentiles could be calculated on the basis of attributions of OER as an equivalent to citation of publications. Due to the rather negative attitude shown by participants towards percentiles for OER, these were removed from the framework. The main criticism refers to the false accuracy suggested by percentile indicators. Ratios change strongly when only small changes were made to the data basis. These indicators are thus anything but robust and precise (cf. 2: 6–7, 9). However, against the background of a possible profile representation, the idea of visualization was transferred to simple counts of created artefacts. In this approach, analogous to percentiles, the numbers of OER produced in certain time periods are plotted together with other scientific outputs (publications, data sets, etc.) also produced in these time periods (cf. 4:12).
One change to the indicator name relates to the indicators of openness known in bibliometrics. They were renamed from “open access indicators” (Fig. 4) to “openness indicators” (Figs. 5 and 6) to adapt them to the language used in the OER sector. Two indicators were removed from the framework: the OER-h-index and the OER-m-quotient. We do not base the deletion on comments from the interviews (these two specific indicators were not explicitly discussed), but there is general criticism of the indicators in scientometrics. This can be read in the following blog post and can be summarized with the following quote: “The use of a single unrepresentative, and in many cases even unfair, indicator based on publication and citation counts is not acceptable” (de Rijcke et al., 2021).
We included two new indicator types in the framework. The first new indicator focus on the transfer of knowledge via OER from research to teaching and vice versa (cf. 1: 6). These “transfer indicators” can record when, for example, research projects produce OER for teaching in addition to other output for both the individual and institutional level (Figs. 5 and 6). The second new indicator is derived from the existing indicator on “OER certifications” at the institutional level and takes this dichotomous approach to the individual level (Fig. 5).
Use cases
The use cases of the framework basically remain, but are further specified. The explorative area at the institutional level is supplemented by the aspect of network analyses for researching structures in the OER sector, e.g., at the level of the universities (cf. 2: 16). The evaluative area experiences two additions with the inclusion of use case monitoring (cf. 2: 11–12; 4: 31) and the explicit mentioning of teaching profiles and incentive structures (Figs. 5 and 6) which is clearly expressed by the following quote:
So, in the end, I need an incentive somewhere that I can also create when I say that in appointment procedures or in other contexts, they also look at what I have taught. (cf. 1: 5).
Limitations
The experts’ opinions have also resulted in changes to the framework in terms of limitations. Currently, the data base is still slim due to a still insufficient culture in the creation, publication and subsequent use of OER, a differentiation has resulted. A distinction is now drawn between the technical and the statistical/mathematical dimension (Figs. 5 and 6) to which following quote refers:
You already have very, very small numbers for publications at the level of individuals. In other words, the number of publications by a person is difficult to determine statistically because the numbers are so small. The question for me now is, what does that look like for OER? I simply assume that the number of publications is even higher than the number of OER. That’s why I’m not sure if we’re not also moving in this area of small numbers or if the numbers are perhaps even smaller than for publications, to what extent this is actually statistically tangible. (cf. 1: 3–4).
OER statistics focus on OER as artefacts for teaching and additionally as services within the framework of an OER ecosystem at the institutional level. The fact that OER can only represent a part of the teaching artefacts created and used was already covered by the previous limitations. In order to clarify that teaching as a whole cannot be represented by OER alone, the framework has been expanded here. This can be seen in the figure of the framework by the more general formulation “no possibility of displaying teaching as a whole” (“material” was deleted; cf. 3: 20) (Figs. 5 and 6).
Many limitations have been formulated in connection with scientometric studies in general which are outlined in the Leiden Manifesto (Hicks et al., 2015). The users of these studies are also responsible for interpreting the quantitative results presented against the background of their calculation modalities and limitations (cf. 3: 3–4, 19; 5: 12). To emphasize this, we have added the aspect of “missing metric literacy” to the critical points summarized under the limitation “general scientometric problems” (Figs. 5 and 6). The following quote stresses this point particularly clearly:
So, there’s a question about literacy. Literacy of kind of what is in terms of understanding, what can people handle? The literacy that they have of metrics, indicators, data. And we need to recognize that in most settings that is limited. And that’s not a problem. That’s just a fact of life. But we should adjust the way we deal with data to the literacy that the people that need to ultimately make decisions that they have. (cf. 2: 16)
Furthermore, we include two new limitations. The first concerns the current lack of theoretical foundations (Figs. 5 and 6), as they are extensively available for bibliometric studies, but must first be carried out for the area of OER. This effect, for example, questions about the diversity of subject domains in teaching or attribution behavior (cf. 1: 12; 5: 9–10, 19). The second supplement documents limitations that arise from the object of study OER itself. First and foremost, the voluntary nature of the creation, publication and subsequent use of OER should be mentioned, which represents a significant distinction from other academic output:
Then you probably need an institutional policy or something that says: You have to do this now. You have to load your teaching materials onto these platforms so that we can map them accordingly. But I think that would probably not be entirely unproblematic. (cf. 5:4)
Furthermore, the attribution practice of OER (cf. 1: 6, 5: 17), which is fraught with difficulties, as well as the great variety of possible forms and the resulting difficulty in comparing artefacts should be mentioned (cf. 1: 14; 5: 5). In summary, we added “OER-specific limitations (attribution practice of OER; large variety of possible forms of OER; difficulty to compare artefacts)” (Figs. 5 and 6).
Third version
In the third version of the OER statistics, we distinguish between the individual level and the institutional level. Figure 5 presents the third version of the OER statistics of scientometric analyses at the individual level. The division into the four areas of methodological basis, OER statistics, use cases and limitations remains the same. The area methodological basis is rooted in the basics of scientometric analyses and reminds of aspects which have to be considered before applying and presenting statistical calculations of OER. The data basis must be selected very carefully and justified in detail. In the best case, data sets are created manually and in collaboration with the person being evaluated. This ensures a detailed representation of the openly accessible teaching materials and empowers the people concerned through participation. Furthermore, we point out that we need to know which artefacts are considered in the analysis. Under certain circumstances and depending on the particular use case, it may be important to consider only certain artefacts. This has to be justified and presented in detail. With respect to authorship and attribution counts, we recommend to use the full-counting method and not to apply methodological procedures such as fractional counting or to restrict with respect to attribution windows or to exclude self-attributions. We argue that this approach provides a very transparent view of the data basis and does not obscure ratios.
General OER requirements must be considered before applying OER statistics. It is important to remember that persistent identifiers are needed for the OER, and that the OER considered must have a certain level of quality and level of creation. Concluding the area of the methodological basis, research data, the software and the code used should be founded in open metrics in order to ensure the transparency and traceability of the analysis.
Regarding the use cases of the OER statistics, we resort to the classical separation between explorative and evaluative approaches. The first one describes the application of the OER statistics as a research method. An exemplary use case could be a network analysis of a given subject. Regarding the evaluative approach, the OER statistics could serve as informed statistics for assessment purposes, they could be used as a monitoring tool, serve as incentive structures for the visibility of university teaching, or strengthen a second career path by helping scholars to present their teaching profile.
The specific indicators are divided into productivity indicators, cooperation indicators, resonance indicators, openness indicators, altmetric indicators, transfer indicators and the OER certification indicator. The sub-units are shown in the table in Fig. 5. At this point, it is important to enrich the metrics with “accompanying qualitative assessment”. The indicators we discuss should never legitimize higher education policy decisions on their own, but act exclusively as a quantitatively informing part of a more complex process. For example, it is conceivable to consult the OER statistics when it is necessary to justify which of a person’s works are reviewed by means comparable to peer review procedures.
The visualization of the OER statistics in Fig. 5 shows an openness profile of a person. Both visualizations show the same example in different ways. The left graph shows the number of different open products (OA articles, OER, open data and contributions to open review processes). The graph on the right shows the same numbers distributed over time. In this case, a dot refers to the publication of a product. The color indicates the type of publication and can be taken from the legend. The metrics and visualizations like these can help perceive the science system in a more multidimensional way.
In Fig. 5, we highlight five limitations that should be considered when using OER statistics. First, the rather weak data basis for OER must be considered. As already mentioned, OER are still not a widespread practice, which is why we should not assume them as an absolutely self-evident part of current scientific practice. This brings about mathematical/statistical difficulties. In particular, calculations such as arithmetic means can only be calculated to a very limited extent with the current data base. Furthermore, the technical data infrastructure is quite diverse and offers some technical hurdles, such as a smooth download of the OER metadata or the availability of attribution data. When applying OER statistics, it is important to remember that OER is only a slice of the field of teaching activities and must be treated as such. This goes hand in hand with general scientometric problems, such as the fact that readers of scientometric analyses must have a certain level of metric literacy in order to assess the significance of the results and avoid misjudgements. Furthermore, it should be noted that no theories on scientometric analyses of OER exist yet. Our work is a first step in this direction, but following the development of the framework, it is necessary to empirically test how the indicators behave in practical application and what effects and impacts they actually have. Finally, limitations should be mentioned that are specific to OER. No common attribution practices have yet become established in the OER world. There is a wide range of OER forms and artefacts and these are more difficult to compare than research materials. Thus, there are three factors that constitute OER-specific difficulties and need to be considered, which are the missing attribution practice of OER, the large variety of possible OER formats and the difficulty of comparing artefacts.
The OER statistics at the institutional level behave similarly in parts (Fig. 6). The methodological basis is comparable. In the analysis of institutions, the assessment of units in the context of the corresponding subject classification can be very useful. Especially in the development of a particular teaching profile, the performance of a university should be appraised in the context of the relevant disciplines. Also, if resonance indicators are compared, for example, then field normalization is important to avoid comparing apples with oranges. The choice for a certain subject classification is crucial for the outcome of the analysis and has to be justified carefully.
The indicators differ from the calculations at the individual level. At this point, reference should be made to productivity indicators, cooperation indicators, resonance indicators, openness indicators and support indicators. Regarding the productivity indicators, special reference should be made to the division of the “number of Dedicated Learning Content” into different levels of granularity. These divide the OER into classifications of degrees. Granularity 1, for example, means stand-alone learning objects, which in themselves have value in higher education teaching. Granularity 4, on the other hand, means a set of course units that leads to the attainment of a degree. The categories are not weighted, but serve as a more detailed mapping regarding the production of OER.
At this point, the visualization represents networks of OER. The classical scientometric approach of visualizing citation networks is schematically shown in Fig. 6. An example is shown that clearly illustrates how institution (A) behaves in a collaboration network. In the lower part of the visualization, the theoretical background of co-citations and bibliographic coupling is shown. The limitations of OER statistics are unchanged from those of individual-level statistics.
Conclusion
The OER statistics framework aims to make teaching activities visible and to value them within the Recognition and Reward System and RRA. The development was carried out in a multi-stage process. In a preliminary study, we explored the feasibility of such a framework in focus group discussions with experts from scientometrics and OER and a first idea about OER indicators (see the first version in “First version (pre-study)” Sect. and Fig. 3). The detailed results are documented in Kullmann and Weimer (2023). On this basis, we developed a second version of the framework (see “Second version” Sect. and Fig. 4) with four dimensions: methodological basis, OER statistics for the individual and institutional level, the exploratory and evaluative use cases, and limitations. In September 2023, we discussed this refined framework with scientometric experts for evaluation. We present the findings from the expert interviews in the third version of the framework (“Third version” Sect. and Figs. 5 and 6).
In summary, this paper discusses the evaluation of our OER statistical framework by experts in scientometrics and the changes resulting from this evaluation. As a particularly relevant improvement through the evaluation, we would like to emphasize the addition of the qualitative dimension to the OER statistics. It is important to show that we do not see the proposed framework as a stand-alone instrument that by itself succeeds in making higher education teaching more valuable. Like all other scientometric methods, we see our contribution accompanied by qualitative assessments by peers. We would also like to emphasize that we do not see the framework as final and conclusive, but as dynamic and fluid. We would like our work to initiate a discourse. Actual appreciation of university teaching depends, at the end of the day, on the values and norms of the people who shape and form the academic landscape on a daily basis.
References
Atkins, D., Brown, J., & Hammond, A. (2007). A review of the Open Educational Resources (OER) movement: Achievements, challenges, and new opportunities. The William and Flora Hewlett Foundation. Retrieved from http://www.hewlett.org/wp-content/up-loads/2016/08/ReviewoftheOERMovement.pdf
Bornmann, L., & Marx, W. (2014). How to evaluate individual researchers working in the natural and life sciences meaningfully? A proposal of methods based on percentiles of citations. Scientometrics, 98, 487–509. https://doi.org/10.1007/s11192-013-1161-y
CoARA—Coalition for Advancing Research Assessment. (2022). Agreement on reforming research assessment. Retrieved from https://coara.eu/app/uploads/2022/09/2022_07_19_rra_agreement_final.pdf
Creative Commons. (2022). Best practices for attribution Retrieved from: https://wiki.creativecommons.org/wiki/Best_practices_for_attribution#Attributing_text
D’Antoni, S. (2009). Open Education Resources: Reviewing initiatives and issues. Open Learning: the Journal of Open, Distance and e-Learning., 24(1), 3–10. https://doi.org/10.1080/02680510802625443
de Rijcke, S. Waltman, L., & van Leeuwen, T. (2021). Halt the h-index. Leiden Madtrics. Retrieved from https://www.leidenmadtrics.nl/articles/halt-the-h-index
DFG—Deutsche Forschungsgemeinschaft. (2022). Academic Publishing as a Foundation and Area of Leverage for Research Assessment. Challenges and Fields of Action. https://doi.org/10.5281/ZENODO.6538163
DORA—Declaration on Research Assessment. (2019). San Francisco Declaration on Research Assessment. Retrieved from https://sfdora.org/read/
European Commission. (2017a). Next-generation metrics: responsible metrics and evaluation for open science. Retrieved from https://op.europa.eu/o/opportal-service/download-handler?identifier=b858d952-0a19-11e7-8a35-01aa75ed71a1&format=pdf&language=en&productionSystem=cellar&part
European Commission, Directorate-General for Research and Innovation, Cabello Valdes, C., Rentier, B., Kaunismaa, E. et al. (2017b). Evaluation of research careers fully acknowledging Open Science practices – Rewards, incentives and/or recognition for researchers practicing Open Science. Publications Office. https://data.europa.eu/doi/10.2777/75255
European Commission. (2019). Open science monitor. Study on open science: monitoring trends and drivers. Final Report. Retrieved from https://ec.europa.eu/info/sites/default/files/research_and_innovation/knowledge_publications_tools_and_data/documents/ec_rtd_open_science_monitor_final-report.pdf
European Commission. (2023a). Open science monitor. Retrieved from https://research-and-innovation.ec.europa.eu/strategy/strategy-2020-2024/our-digital-future/open-science/open-science-monitor_en
European Commission. (2023b). Academic Careers Understood through Measurement and Norms (ACUMEN). Better measures for evaluating researchers. Retrieved from https://cordis.europa.eu/article/id/159979-better-measures-for-evaluating-researchers
Hicks, D., Wouters, P., Waltman, L., de Rijcke, S., & Rafols, I. (2015). Bibliometrics: The Leiden Manifesto for research metrics. Nature, 520(7548), 429–431. https://doi.org/10.1038/520429a
INORMS—The International Network of Research Management Societies. Research Evaluation Group (REG). (2021). The SCOPE framework: A five-stage process for evaluating research responsibly. Retrieved from https://inorms.net/wp-content/uploads/2022/03/21655-scope-guide-v10.pdf
Kullmann, S. (2023, under review). Teaching counts! Open Educational Resources as an object of measurement for scientometric analysis. DIPF | Leibniz Institute for Research and Information in Education.
Kullmann, S., & Weimer, V. (2023). Teaching as part of open scholarship—Scientometric indicators for Open Educational Resources. ISSI 2013 Proceedings, 6, 667–683. https://doi.org/10.5281/zenodo.8246995
Mayrberger, K., & Thiemann, S. (2018). Jenseits von Selbstreferenzialität. Awareness for Openness @ UHH. Retrieved from https://uhh.de/gxoal
Mayring, P. (2015). Qualitative Inhaltsanalyse. Grundlagen und Techniken.
Möller, T., Schmidt, M., & Hornbostel, S. (2015). Assessing the effects of the German Excellence Initiative with bibliometric methods. Scientometrics, 109, 2217–2239.
Müskens, W., Zawacki-Richter, O., & Dolch, C. (2022). Quality assurance tool for OER—IQOer—Development version 17. https://doi.org/10.13140/RG.2.2.16987.03363/1
O’Neill, G., Open and Universal Science Project (OPUS). (n/a). Deliverable 3.1. Indicators and metrics to test in the pilots. Retrieved from https://opusproject.eu/wp-content/uploads/2023/09/OPUS_D3.1_IndicatorsMetrics_FINAL_PUBLIC.pdf
OER Repo-AG. (2021). LOM for Higher Education OER Repositories. Retrieved from https://dini-ag-kim.github.io/hs-oer-lom-profil/latest
Orr, D., Rimini, M., & van Damme, D. (2015). Open educational resources: A catalyst for innovation: Educational research and innovation. OECD. https://doi.org/10.1787/9789264247543-en
OSAF—Open Science Assessment Framework. (2023). GraspOS Open Research Assessment Dataspace. Retrieved from https://graspos.eu/open-science-assessment-framework
Owen, R., Macnaghten, P. and Stilgoe, J. (2012). Responsible research and innovation: From science in society to science for society, with society. Science and Public Policy; Doi: https://doi.org/10.1093/scipol/scs093
Pampel, H., Ferguson, L., Messerschmidt, R. and Faensen, K. (2020). Indikatoren für Open Science: Diskussionspapier des Helmholtz Open Science Office. Retrieved from https://gfzpublic.gfz-potsdam.de/rest/items/item_5004269_2/component/file_5004271/content
Tennant, J., Beamer, J. E., Bosman, J., Brembs, B., Chung, N. C., Clement, G., Crick, T., Dugan, J., Dunning, A., Eccles, D., Enkhbayar, A., Graziotin, D., Harding, R., Havemann, J., Katz, D. S., Khanal, K., Kjaer, J. N., Koder, T., Macklin, P. … Turner, A. (2019). Foundations for open scholarship strategy development. Retrieved from https://open-scholarship-strategy.github.io/site/#1-purpose-of-this-document
UNESCO. (2012) Paris declaration: World Open Educational Resources (OER) Congress. Retrieved from https://unesdoc.unesco.org/ark:/48223/pf0000246687
UNESCO. (2019). Recommendation on Open Educational Resources (OER). Retrieved from https://unesdoc.unesco.org/ark:/48223/pf0000373755/PDF/373755eng.pdf.multi.page=3
VFNM—Verein Forum Neue Medien in der Lehre Austria. (2022). OER-Zertifikate. Retrieved from https://www.oer-zertifikat.at/oer/de/zertifizierung
VSNU, NFU, KNAW, NWO and ZonMw. (2019). Room for everyone´s talent: Towards a new balance in the recognition and rewards of academics. Retrieved from https://www.universiteitenvannederland.nl/recognitionandrewards/wp-content/uploads/2019/11/Position-paper-Room-for-everyone%E2%80%99s-talent.pdf
Waltman, L., & Schreiber, M. (2013). On the calculation of percentile-based bibliometric indicators. Journal of the American Society for Information Science and Technology, 64(2), 372–379. https://doi.org/10.1002/asi.22775
Weimer, V., Heck, T., van Leeuwen, T., & Rittberger, M. (2023). The quantification of open scholarship—A mapping review. Quantitative Science Studies, 4(3), 650–670. https://doi.org/10.1162/qss_a_00266
Acknowledgements
This paper is an extension of our full paper presented at the ISSI Conference 2023, which is included in the Proceedings of the ‘18th International Society of Scientometrics and Informetrics Conference (ISSI 2023)’ (Kullmann & Weimer, 2023). There, we present the pre-study to our project. This paper presents the further development as a main study. We wish to thank all participants in the expert interviews for the highly constructive discussions. This applies both to all anonymous participants and to the following persons, whom we are allowed to mention by name in the acknowledgements: Rodrigo Costas, Vincent Traag, Dirk Tunger and Ludo Waltman. All discussions have sustainably differentiated and improved the framework.
Funding
Open Access funding enabled and organized by Projekt DEAL.
Author information
Authors and Affiliations
Corresponding author
Additional information
Publisher's Note
Springer Nature remains neutral with regard to jurisdictional claims in published maps and institutional affiliations.
Please note: Authorship is evenly split at 50/50%. The order of authorship is alphabetical and has no further meaning.
Rights and permissions
Open Access This article is licensed under a Creative Commons Attribution 4.0 International License, which permits use, sharing, adaptation, distribution and reproduction in any medium or format, as long as you give appropriate credit to the original author(s) and the source, provide a link to the Creative Commons licence, and indicate if changes were made. The images or other third party material in this article are included in the article's Creative Commons licence, unless indicated otherwise in a credit line to the material. If material is not included in the article's Creative Commons licence and your intended use is not permitted by statutory regulation or exceeds the permitted use, you will need to obtain permission directly from the copyright holder. To view a copy of this licence, visit http://creativecommons.org/licenses/by/4.0/.
About this article

Cite this article
Kullmann, S., Weimer, V. Teaching as part of open scholarship: developing a scientometric framework for Open Educational Resources. Scientometrics (2024). https://doi.org/10.1007/s11192-024-05007-1
Received:
Accepted:
Published:
DOI: https://doi.org/10.1007/s11192-024-05007-1