
Abstract
The h-index is a widely used scientometric indicator on the researcher level working with a simple combination of publication and citation counts. In this article, we pursue two goals, namely the collection of empirical data about researchers’ personal estimations of the importance of the h-index for themselves as well as for their academic disciplines, and on the researchers’ concrete knowledge on the h-index and the way of its calculation. We worked with an online survey (including a knowledge test on the calculation of the h-index), which was finished by 1081 German university professors. We distinguished between the results for all participants, and, additionally, the results by gender, generation, and field of knowledge. We found a clear binary division between the academic knowledge fields: For the sciences and medicine the h-index is important for the researchers themselves and for their disciplines, while for the humanities and social sciences, economics, and law the h-index is considerably less important. Two fifths of the professors do not know details on the h-index or wrongly deem to know what the h-index is and failed our test. The researchers’ knowledge on the h-index is much smaller in the academic branches of the humanities and the social sciences. As the h-index is important for many researchers and as not all researchers are very knowledgeable about this author-specific indicator, it seems to be necessary to make researchers more aware of scholarly metrics literacy.
Introduction
In 2005, Hirsch introduced his famous h-index. It combines two important measures of scientometrics, namely the publication count of a researcher (as an indicator for his or her research productivity) and the citation count of those publications (as an indicator for his or her research impact). Hirsch (2005, p. 1569) defines, “A scientist has index h if h of his or her Np papers have at least h citations each and the other (Np – h) papers have < h citations each.” If a researcher has written 100 articles, for instance, 20 of these having been cited at least 20 times and the other 80 less than that, then the researcher’s h-index will be 20 (Stock and Stock 2013, p. 382). Following Hirsch, the h-index “gives an estimate of the importance, significance, and broad impact of a scientist’s cumulative research contribution” (Hirsch 2005, p. 16,572). Hirsch (2007) assumed that his h-index may predict researchers’ future achievements. Looking at this in retro-perspective, Hirsch had hoped to create an “objective measure of scientific achievement” (Hirsch 2020, p. 4) but also starts to believe that this could be the opposite. Indeed, it became a measure of scientific achievement, however a very questionable one.
Also in 2005, Hirsch derives the m-index with the researcher’s “research age” in mind. Let the number of years after a researcher’s first publication be tp. The m-index is the quotient of the researcher’s h-index and her or his research age: mp = hp/tp (Hirsch 2005, p. 16,571). An m-value of 2 would mean, for example, that a researcher has reached an h-value of 20 after 10 research years. Meanwhile, the h-index is strongly wired in our scientific system. It became one of the “standard indicators” in scientific information services and can be found on many general scientific bibliographic databases. Besides, it is used in various contexts and generated a lot of research and discussions. This indicator is used or rather misused—dependent on the way of seeing—in decisions about researchers’ career paths, e.g. as part of academics’ evaluation concerning awards, funding allocations, promotion, and tenure (Ding et al. 2020; Dinis-Oliveira 2019; Haustein and Larivière 2015; Kelly and Jennions 2006). For Jappe (2020, p. 13), one of the arguments for the use of the h-index in evaluation studies is its “robustness with regards to incomplete publication and citation data.” Contrary, the index is well-known for its inconsistencies, incapability for comparisons between researchers with different career stages, and missing field normalization (Costas and Bordons 2007; Waltman and van Eck 2012). There already exist various advantages and disadvantages lists on the h-index (e.g. Rousseau et al. 2018). And it is still questionable what the h-index underlying concept represents, due to its conflation of the two concepts’ productivity and impact resulting in one single number (Sugimoto and Larivière, 2018).
It is easy to identify lots of variants of the h-index concerning both, the basis of the data as well as the concrete formula of calculation. Working with the numbers of publications and their citations, there are the data based upon the leading general bibliographical information services Web of Science (WoS), Scopus, Google Scholar, and, additionally, on ResearchGate (da Silva and Dobranszki 2018); working with publication numbers and the number of the publications’ reads, there are data based upon Mendeley (Askeridis 2018). Depending of an author’s visibility on an information service (Dorsch 2017), we see different values for the h-indices for WoS, Scopus, and Google Scholar (Bar-Ilan 2008), mostly following the inequation h(R)WoS < h(R)Scopus < h(R)Google Scholar for a given researcher R (Dorsch et al. 2018). Having in mind that WoS consists of many databases (Science Citation Index Expanded, Social Science Citation Index, Arts & Humanities Citation Index, Emerging Sources Citation Index, Book Citation Index, Conference Proceedings Citation Index, etc.) and that libraries not always provide access to all (and not to all years) it is no surprise that we will find different h-indices on WoS depending on the subscribed sources and years (Hu et al. 2020).
After Hirsch’s publication of the two initial formulas (i.e. the h-index and the time-adjusted m-index) many scientists felt required to produce similar, but only slightly mathematically modified formulas not leading to brand-new scientific insights (Alonso et al. 2009; Bornmann et al. 2008; Jan and Ahmad 2020), as there are high correlations between the values of the variants (Bornmann et al. 2011).
How do researchers estimate the importance of the h-index? Do they really know the concrete definition and its formula? In a survey for Springer Nature (N = 2734 authors of Springer Nature and Biomed Central), Penny (2016, slide 22) found that 67% of the asked scientists use the h-index and further 22% are aware of it but have not used it before; however, there are 10% of respondents who do not know what the h-index is. Rousseau and Rousseau (2017) asked members of the International Association of Agricultural Economists and gathered 138 answers. Here, more than two-fifth of all questionees did not know what the h-index is (Rousseau and Rousseau 2017, p. 481). Among Taiwanese researchers (n = 417) 28.78% self-reported to have heard about the h-index and fully understood the indicator, whereas 22.06% never heard about it. The remaining stated to hear about it and did not know its content or only some aspects (Chen and Lin 2018). For academics in Ireland (n = 19) “journal impact factor, h-index, and RG scores” are familiar concepts, but “the majority cannot tell how these metrics are calculated or what they represent” (Ma and Ladisch 2019, p. 214). Likewise, the interviewed academics (n = 9) could name “more intricate metrics like h-index or Journal Impact Factor, [but] were barely able to explain correctly how these indicators are calculated” (Lemke et al. 2019, p. 11). The knowledge about scientometric indicators in general “is quite heterogeneous among researchers,” Rousseau and Rousseau (2017, p. 482) state. This is confirmed by further studies on the familiarity, perception or usage of research evaluation metrics in general (Aksnes and Rip 2009; Derrick and Gillespie 2013; Haddow and Hammarfelt 2019; Hammarfelt and Haddow 2018).
In a blog post, Tetzner (2019) speculates on concrete numbers of a “good” h-index for academic positions. Accordingly, an h-index between 3 and 5 is good for a new assistant professor, an index between 8 and 12 for a tenured associate professor, and, finally, an index of more than 15 for a full professor. However, these numbers are gross generalizations without a sound empirical foundation. As our data are from Germany, the question arises: What kinds of tools do German funders, universities, etc. use for research evaluation? Unfortunately, there are only few publications on this topic. For scientists at German universities, bibliometric indicators (including the h-index and the impact factor) are important or very important for scientific reputation for more than 55% of the questionees (Neufeld and Johann 2016, p.136). Those indicators have also relevance or even great relevance concerning hiring on academic positions in the estimation of more than 40% of the respondents (Neufeld and Johann 2016, p.129). In a ranking of aspects of reputation of medical scientists, the h-index takes rank 7 (with a mean value of 3.4 with 5 being the best one) out of 17 evaluation criteria. Top-ranked indicators are the reputation of the journals of the scientists’ publications (4.1), the scientists’ citations (4.0), and their publication amount (3.7) (Krempkow et al. 2011, p. 37). For hiring of psychology professors in Germany, the h-index had factual relevance for the tenure decision with a mean value of 3.64 (on a six-point scale) and ranks on position 12 out of more than 40 criteria for professorship (Abele-Brehm and Bühner 2016). Here, the number of peer-reviewed publications is top-ranked (mean value of 5.11). Obviously, these few studies highlight that the h-index indeed has relevance for research evaluation in Germany next to publication and citation numbers.
What is still a research desideratum is an in-depth description of researchers’ personal estimations on the h-index and an analysis of possible differences concerning researchers’ generation, their gender, and the discipline.
What is about the researchers’ state of knowledge on the h-index? Of course, we may ask, “What’s your knowledge on the h-index? Estimate on a scale from 1 to 5!” But personal estimations are subjective and do not substitute a test of knowledge (Kruger and Dunning 1999). Knowledge tests on researchers’ state of knowledge concerning the h-index are—to our best knowledge—a research desideratum, too.
In this article, we pursue two goals, namely on the one hand—similar to Buela-Casal and Zych (2012) on the impact factor—the collection of data about researchers’ personal estimations of the importance of the h-index for themselves as well as their discipline, and on the other hand data on the researchers’ concrete knowledge on the h-index and the way of its calculation. In short, these are our research questions:
-
RQ1: How do researchers estimate the importance of the h-index?
-
RQ2: What is the researchers’ knowledge on the h-index?
In order to answer RQ1, we asked researchers on their personal opinions; to answer RQ2, we additionally performed a test of their knowledge.
Methods
Online survey
Online-survey-based questionnaires provide a means of generating quantitative data. Furthermore, they ensure anonymity, and thus, a high degree of unbiasedness to bare personal information, preferences, and own knowledge. Therefore, we decided to work with an online survey. As we live and work in Germany, we know well the German academic landscape and thus restricted ourselves to professors working at a German university. We have focused on university professors as sample population (and skipped other academic staff in universities and also professors at universities of applied sciences), because we wanted to concentrate on persons who have (1) an established career path (in contrast to other academic staff) and (2) are to a high extent oriented towards publishing their research results (in contrast to professors at universities of applied science, formerly called Fachhochschulen, i.e. polytechnics, who are primarily oriented towards practice).
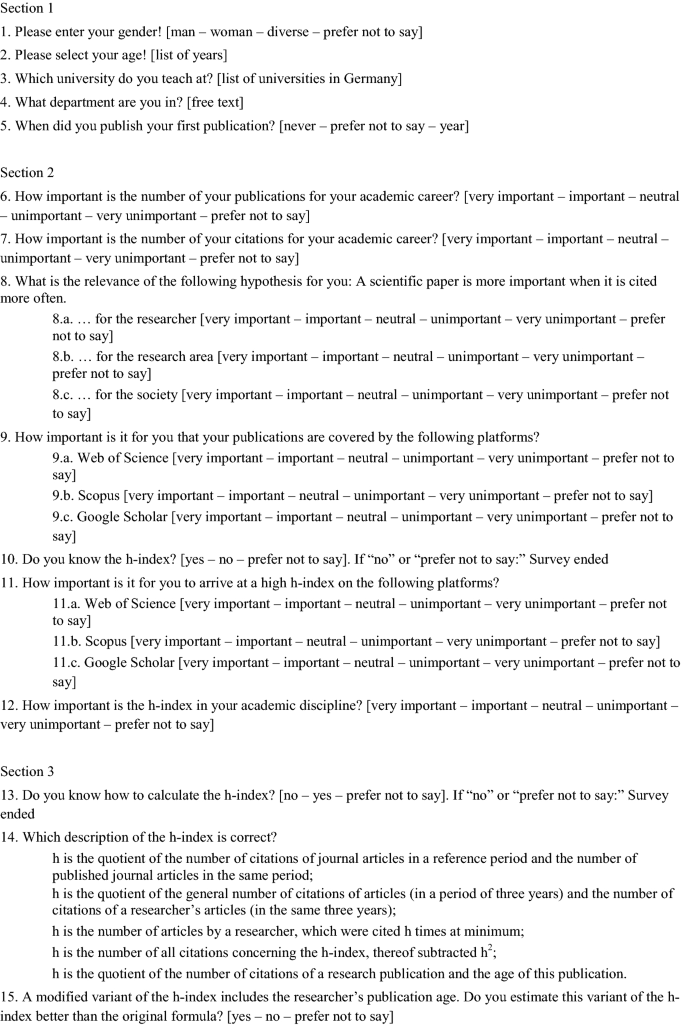
The online questionnaire (see Appendix 1) in German language contained three different sections. In Sect. 1, we asked for personal data (gender, age, academic discipline, and university). Section 2 is on the professors’ personal estimations of the importance of publications, citations, their visibility on WoS, Scopus, and Google Scholar, the h-index on the three platforms, the importance of the h-index in their academic discipline, and, finally, their preferences concerning h-index or m-index. We chose those three information services as they are the most prominent general scientific bibliographic information services (Linde and Stock 2011, p. 237) and all three present their specific h-index in a clearly visible way. Section 3 includes the knowledge test on the h-index and a question concerning the m-index.
In this article, we report on all aspects in relation with the h-index (for other aspects, see Kamrani et al. 2020). For the estimations, we used a 5-point Likert scale (from 1: very important via 3: neutral to 5: very unimportant) (Likert 1932). It was possible for all estimations to click also on “prefer not to say.” The test in Sect. 3 was composed of two questions, namely a subjective estimation of the own knowledge on the h-index and an objective knowledge test on this knowledge with a multiple-choice test (items: one correct answer, four incorrect ones as distractors, and the option “I’m not sure”). Those were the five items (the third one being counted as correct):
-
h is the quotient of the number of citations of journal articles in a reference period and the number of published journal articles in the same period;
-
h is the quotient of the general number of citations of articles (in a period of three years) and the number of citations of a researcher’s articles (in the same three years);
-
h is the number of articles by a researcher, which were cited h times at minimum;
-
h is the number of all citations concerning the h-index, thereof subtracted h2;
-
h is the quotient of the number of citations of a research publication and the age of this publication.
A selected-response format for the objective knowledge test was chosen since it is recommended as the best choice for measuring knowledge (Haladyna and Rodriguez 2013). For the development of the knowledge test items we predominantly followed the 22 recommendations given by Haladyna and Rodriguez (2013, in section II). Using a three-option multiple-choice should be superior to the four- or five-option for several reasons. However, we decided to use five options because our test only contained one question. The “I’m not sure” selection was added for the reason that our test is not a typical (classroom) assessment test. We, therefore, did not want to force an answer, for example through guessing, but rather wanted to know if participants do not know the correct answer. Creating reliable distractors can be seen as the most difficult part of the test development. Furthermore, validation is a crucial task. Here we tested and validated the question to the best of our knowledge.
As no ethical review board was involved in our research, we had to determine the ethical harmlessness of the research project ourselves and followed suggestions for ethical research applying online surveys such as consent, risk, privacy, anonymity, confidentiality, and autonomy (Buchanan and Hvizdak 2009). We found the e-mail addresses of the participants in a publicly accessible source (a handbook on all German faculty members, Deutscher Hochschulverband 2020); the participation was basically voluntary, and the participants knew that their answers became stored. At no time, participants became individually identifiable through our data collection or preparation as we strictly anonymized all questionnaires.
Participants
The addresses of the university professors were randomly extracted from the German Hochschullehrer-Verzeichnis (Deutscher Hochschulverband 2020). So, our procedure was non-probability sampling, more precisely convenience sampling in combination with volunteer sampling (Vehovar et al. 2016). Starting with volume 1 of the 2020 edition of the handbook, we randomly picked up entries and wrote the e-mails addresses down. The link to the questionnaire was distributed to every single professor by the found e-mail addresses; to host the survey we applied UmfrageOnline. To strengthen the power of the statistical analysis we predefined a minimum of 1000 usable questionnaires. The power tables provided by Cohen (1988) have a maximum of n = 1000 participants. Therefore, we chose this value of the sample size to ensure statistically significant results, also for smaller subsets as single genders, generations, and disciplines (Cohen 1992). We started the mailing in June 2019 and stopped it in March 2020, when we had response of more than 1000 valid questionnaires. All in all we contacted 5722 professors by mail and arrived at 1081 completed questionnaires, which corresponds to a response rate of 18.9%.
Table 1 shows a comparison between our sample of German professors at universities with the population as one can find it in the official statistics (Destatis 2019). There are only minor differences concerning the gender distribution and also few divergences concerning most disciplines; however, Table 1 exhibits two huge differences. In our sample, we find more (natural) scientists than in the official statistics and less scholars in the humanities and the social sciences.
Analysis
In our analysis, we distinguished always between the results for all participants, and, additionally, the results by gender (Geraci et al. 2015), generation (Fietkiewicz et al. 2016), and the field of knowledge (Hirsch and Buela-Casal 2014). We differentiated two genders (men, women) (note the questionnaire also provided the options “diverse” and “prefer not to say,” which were excluded from further calculations concerning gender), four generations: Generation Y (born after 1980), Generation X (born between 1960 and 1980), Baby Boomers (born after 1946 and before 1960), Silent Generation (born before 1946), and six academic disciplines: (1) geosciences, environmental sciences, agriculture, forestry, (2) humanities, social sciences, (3) sciences (including mathematics), (4) medicine, (5) law, and (6) economics. This division of knowledge fields is in line with the faculty structure of many German universities. As some participants answered some questions with “prefer not to say” (which was excluded from further calculations), the sum of all answers is not always 1081.
As our Likert scale is an ordinal scale, we calculated in each case the median as well as the interquartile range (IQR). For the analysis of significant differences we applied the Mann–Whitney u-test (Mann and Whitney 1947) (for the two values of gender) and the Kruskall–Wallis h-test (Kruskal and Wallis 1952) (for more than two values as the generations and academic disciplines). The data on the researchers’ knowledge on the h-index are on a nominal scale, so we calculated relative frequencies for three values (1: researcher knows the h-index in her/his self-estimation and passed the test; 2: researcher does not know the h-index in her/his self-estimation; 3: researcher knows the h-index in her/his self-estimation and failed the test) and used chi-squared test (Pearson 1900) for the analysis of differences between gender, knowledge area, and generation. We distinguish between three levels of statistical significance, namely *: p ≤ 0.05 (significant), **: p ≤ 0.01 (very significant), and ***: p ≤ 0.001 (extremely significant); however, one has to interpret such values always with caution (Amrhein et al. 2019). All calculations were done with the help of SPSS (see a sketch of the data analysis plan in Appendix 2).
Researchers’ estimations of the h-index
How do researchers estimate the importance of the h-index for their academic discipline? And how important is the h-index (on WoS, Scopus, and Google Scholar) for themselves? In this paragraph, we will answer our research question 1.
Table 2 shows the different researcher estimations of the importance of the h-index concerning their discipline. While for all participants the h-index is “important” (2) for their academic field (median 2, IQA 1), there are massive and extremely significant differences between the single disciplines. For the sciences, medicine, and geosciences (including environmental sciences, agriculture, and forestry) the h-index is much more important (median 2, IQA 1) than for economics (median 3, IQA 1), humanities and social sciences (median 4, IQA 2), and law (median 5, IQA 0). The most votes for “very important” come from medicine (29.1%), the least from the humanities and social sciences (1.0%) as well as from law (0.0%). Conversely, the most very negative estimations (5: “very unimportant”) can be found among lawyers (78.6%) and scholars from the humanities and social sciences (30.4%). There is a clear cut between sciences (including geosciences, etc., and medicine) on one hand and humanities and all social sciences (including law and economics) on the other hand—with a stark importance of the h-index for the first-mentioned disciplines and a weak importance of the h-index for the latter.
In Tables 3, 4 and 5 we find the results for the researchers’ estimations of the importance of their h-index on WoS (Table 3), Scopus (Table 4), and Google Scholar (Table 5). For all participants, the h-index on WoS is the most important one (median 2; however, with a wide dispersion of IQR 3), leaving Scopus and Google Scholar behind it (median 3, IQR 2 for both services). For all three bibliographic information services, the estimations of men and women do not differ in the statistical picture. For scientists (including geoscientists, etc.), a high h-index on WoS and Scopus is important (median 2); interestingly, economists join scientists when it comes to the importance of the h-index on Google Scholar (all three disciplines having a median of 2). For scholars from humanities and social sciences, the h-indices on all three services are unimportant (median 4), for lawyers they are even very unimportant (median 5). For researchers in the area of medicine there is a decisive ranking: most important is their h-index on WoS (median 2, IQR 2, and 41.5% votes for “very important”), followed by Scopus (median 2, IQA 1, but only 18.4% votes for “very important”), and, finally, Google Scholar (median 3, IQR 1, and the modus also equals 3, “neutral”). For economists, the highest share of (1)-votes (“very important”) is found for Google Scholar (29.9%) in contrast to the fee-based services WoS (19.7%) and Scopus (12.2%).
Similar to the results of the knowledge areas, there is also a clear result concerning the generations. The older a researcher, the less important is his or her h-index for him- or herself. We see a declining number of (1)-votes in all three information services, and a median moving over the generations from 2 to 3 (WoS), 2 to 4 (Scopus), and 2 to 3 (Google Scholar). The youngest generation has a preference for the h-index on Google Scholar ((1)-votes: 34.9%) over the h-indices on WoS ((1)-votes: 25.9%) and Scopus ((1)-votes: 19.8%).
A very interesting result of our study are the impressive differences of the importance estimations of the h-index by discipline (Fig. 1). With three tiny exceptions, the estimations for the general importance and the importance of the h-indices on WoS, Scopus, and Google Scholar are consistent inside each scientific disciplines. For the natural sciences, geosciences etc., and medicine, the h-index is important (median 2), for economics, it is neutral (median 3), for the humanities and social sciences it is unimportant (median 4), and, finally, for law this index is even very unimportant (median 5).

Researchers’ estimations of the h-index by discipline (medians). N = 1001 (general importance), N = 961 (WoS), N = 946 (Scopus), N = 966 (Google Scholar); Scale: (1) very important, (2) important, (3) neutral, (4) unimportant, (5) very unimportant
We do not want to withhold a by-result on the estimation on a modification of the h-index by the time-adjusted m-index. 567 participants made a decision: for 50.8% of them the h-index is the better one, 49.2% prefer the m-index. More women (61.1%) than men (47.3%) choose the m-index over the original h-index. All academic disciplines except one prefer the m-index; scientists are the exception (only 42.8% approval for the m-index). For members of Generation Y, Baby Boomers, and Silent Generation the m-index is the preferable index; Generation X prefers mainly (54.3%) the h-index. Inside the youngest generation, Generation Y (being discriminated by the h-index), the majority of researchers (65.5%) likes the m-index more than the h-index.
Researchers’ state of knowledge on the h-index
Answering our research question 2, the overall result is presented in Fig. 2. This is a combination of three questions, as we initially asked the researchers regarding their personal estimations of their general familiarity (Appendix 1, Q10) and calculation knowledge (Q13) on the h-index. Only participants who confirmed that they have knowledge on the indicators’ calculation (Q10 and Q13) made the knowledge test (Q14). About three fifths of the professors know the h-index in their self-estimations and passed the test, one third of all answering participants does not know the h-index following their self-estimations, and, finally, 7.2% wrongly estimated their knowledge on the h-index, as they failed the test but meant to know it.

Researchers’ state of knowledge on the h-index: The basic distribution. N = 1017
In contrast to many of our results concerning the researchers’ estimation of the importance of the h-index we see differences in the knowledge on the h-index by gender (Table 6). Only 41.6% of the women have justified knowledge (men: 64.6%), 50.0% do not know the definition or the formula of the h-index (men: 28.7%), and 8.3% wrongly estimate their knowledge as sufficient (men: 6.9%). However, these differences are statistically not significant.
In the sciences (incl. geosciences, etc.) and in medicine, more than 70% of the participants do know how to calculate the h-index. Scientists have the highest level of knowledge on the h-index (79.1% passed the knowledge test). Participants from the humanities and social sciences (21.1%) as well as from law (7.1%) exhibit the lowest states of knowledge concerning the h-index. With a share of 48.3%, economists take a middle position between the two main groups of researchers; however, there are 13.8% of economists who wrongly overestimate their knowledge state.
We found a clear result concerning the generations: the older the researcher the less is the knowledge on the h-index. While 62.9% of the Generation X know the calculation of the h-index, only 53.2% of the Baby Boomers possess this knowledge. The differences in the states of the researchers’ knowledge on the h-index within the knowledge areas and generations are extremely significant each.
Discussion
Main results
Our main results are on the researchers’ estimations of the h-index and their state of knowledge on this scientometric indicator. We found a clear binary division between the academic knowledge fields: For the sciences (including geosciences, agriculture, etc.) and medicine the h-index is important for the researchers themselves and for their disciplines, while for the humanities and social sciences, economics, and law the h-index is considerably less important. For the respondents from the sciences and medicine, the h-index on WoS is most important, followed by the h-index of Google Scholar and Scopus. Surprisingly, for economists Google Scholar’s h-index is very attractive. We did not find significant differences between the estimations of the importance of the h-index between men and women; however, there are differences concerning the generations: the older the participants the less important they estimate the importance of the h-index.
Probably, for older professors the h-index has not the same significance as for their younger colleagues, as they are not so much in need to plan their further career or to apply for new research projects. On average, for researchers aged 60 and more, their productivity declines in contrast to younger colleagues (Kyvik 1990). And perhaps some of them simply do not know the existence of more recent services and of new scientometric indicators. Younger researchers are more tolerant of novelty in their work (Packalen and Bhattachrya 2015), and such novelty includes new information services (as Scopus and Google Scholar) as well as new indicators (as the h-index). It is known that young researchers rely heavily on search engines like Google (Rowlands et al. 2008), which partly may explain the high values for Google Scholar especially from Generation Y. Furthermore, the increasing publication pressure and the h-index utilization for decisions about early career researchers’ work-related paths thus also impact the importance of the indicator for those young professors (Farlin and Majewski 2013).
All in all, two fifths of the professors do not know the concrete calculation of the h-index or—which is rather scary—wrongly deem to know what the h-index is and failed our simple knowledge test. The women do even worse, as only about two fifths really know what the h-index is and how it is defined and calculated, but we should have in mind that this gender difference is statistically not significant. The older the researcher, the higher is the share of participants who do not know the definition and calculation of the h-index. The researchers’ knowledge on the h-index is much smaller in the academic disciplines of the humanities and the social sciences.
The h-index in the academic areas
Especially the obvious differences between the academic areas demand further explanation. Participants from the natural sciences and from medicine estimate the importance of the h-index as “important” or even “very important,” and they know details on this indicator to a high extend. The participants from the humanities, the social sciences, economics, and law are quite different. They estimate the h-index’ importance as “neutral,” “unimportant,” or even as “very unimportant,” and the share of researchers with profound knowledge on the h-index is quite low. Haddow and Hammarfelt (2019) also report a lower use of the h-index within these fields. Similar to our study, especially researchers in the field of law (n = 24) did not make use of the h-index. All researchers publish and all cite, too. There are differences in their publication channels, as scientists publish mostly in journals and researchers from the humanities publish in monographs and sometimes also in journals (Kulczycki et al. 2018), but this may not explain the differences concerning the importance of and the knowledge state on the h-index. Furthermore, more information on how such researchers’ h-index perceptions through different disciplines comply with the h-index (mis)usage for research evaluation within those disciplines would add another dimension to this topic.
The indeed very large general information services WoS and Scopus are, compared to personal literature lists of researchers, quite incomplete (Hilbert et al. 2015). There is also a pronounced unequal coverage of certain disciplines (Mongeon and Paul-Hus 2016) and many languages (except English) (Vera-Baceta et al. 2019). Perhaps these facts, in particular, prevent representatives of the disadvantaged disciplines and languages (including German—and we asked German professors) from a high estimation of the relevance of their h-index as important on these platforms. Then, however, the rejection of the h-index of Google Scholar, which can also be seen, is surprising, because this information service is by far the most complete (Martin-Martin et al. 2018). However, economists are very well informed here, as they—as the only academic representatives—highly value their h-index at Google Scholar. On the other hand, the use of Google Scholar for research evaluation is discussed in general. Although its coverage is usually broader than those provided by more controlled databases and steadily expanding its collection, there exist widely known issues, for example, its low accuracy (Halevi et al. 2017). Depending on a researcher’s own opinion on this topic, this could be a reason for seeing no importance in the h-index provided by Google Scholar as well.
Another attempt for an explanation may be the different cultures in the different research areas. For Kagan (2009, p. 4), natural scientists see their main interest in explanation and prediction, while for humanists it is understanding (following Snow 1959 and Dilthey 1895, p. 10). The h-index is called an indicator allowing explanation and prediction of scientific achievement (Hirsch 2007); it is typical for the culture of natural sciences. Researchers from the natural science and from medicine are accustomed to numbers, while humanists seldom work quantitatively. In the humanities, other indicators such as book reviews and the quality of book publishers are components for their research evaluation; however, such aspects are not reflected by the h-index. And if humanities scholars are never asked for their h-index, why should they know or use it?
Following Kagan (2009, p. 5) a second time, humanists exhibit only minimal dependence on outside support and natural scientists are highly dependent on external sources of financing. The h-index can work as an argument for the allocation of outside support. So for natural scientists the h-index is a very common fabric and they need it for their academic survival; humanists are not as familiar with numerical indicators and for them the h-index is not so much-needed as for their colleagues from the science and medicine faculties. However, this dichotomous classification of research and researchers may be an oversimplifying solution (Kowalski and Mrdjenovich 2016) and there is a trend in consulting and using such research evaluation indicators in the humanities and social sciences, too. For preparing a satisfying theory of researchers’ behavior concerning the h-index (or, in general, concerning scientometric indicators)—also in dependence on their background in an academic field—more research is needed.
Limitations, outlook, and recommendations
A clear limitation of the study is our studied population, namely university professors from Germany. Of course, researchers in other countries should be included in further studies. It seems necessary to broaden the view towards all researchers and all occupational areas, too, including, for instance, also lecturers in polytechnics and researchers in private companies. Another limitation is the consideration of only three h-indices (of WoS, Scopus, and Google Scholar). As there are other databases for the calculation of an h-index (e.g., ResearchGate) the study should be broadened to all variants of the h-index.
Another interesting research question may be: Are there any correlations between the estimations of the importance of the h-index or the researcher’s knowledge on the h-index and the researcher’s own h-index? Does a researcher with a high h-index on, for instance, WoS, estimate the importance of this indicator higher than a researcher with a low h-index? Hirsch (2020) speculates that people with high h-indexes are more likely to think that this indicator is important. A more in-depth analysis on the self-estimation of researchers’ h-index knowledge might also consider the Dunning-Kruger effect, showing certain people can be wrongly confident about their limited knowledge within a domain and not having the ability to realize this (Kruger and Dunning 1999).
As the h-index has still an important impact on the evaluation of scientists and as not all researchers are very knowledgeable about this author-specific research indicator, it seems to be a good idea to strengthen their knowledge in the broader area of “metric-wiseness” (Rousseau et al. 2018; Rousseau and Rousseau 2015). With a stronger focus on educating researchers and research support staff in terms of the application and interpretation of metrics as well as to reduce misuse of indicators, Haustein (2018) speaks about better (scholarly) “metrics literacies.” Following Hammarfelt and Haddow (2018), we should further discuss possible effects of indicators within the “metrics culture.” Likewise, this also applies to all knowledgeable researchers as well as research evaluators who also may or may not be researchers by themselves. Here, the focus rather lies to raise awareness for metrics literacies and to foster fair research evaluation practices not incorporating any kind of misuse. This leads directly to a research gap in scientometrics. Further research on concrete data about the level of researchers’ knowledge not only concerning the h-index, but also on other indicators such as WoS’s impact factor, Google’s i-10 index, Scopus’ CiteScore, the source normalized impact per paper (SNIP), etc., also in a comparative perspective would draw a more comprehensive picture on the current indicator knowledge. All the meanwhile “classical” scientometric indicators are based upon publication and citation measures (Stock 2001). Alternative indicators are available today, which are based upon social media metrics, called “altmetrics” (Meschede and Siebenlist 2018; Thelwall et al. 2013). How do researchers estimate the importance of these alternative indicators and do they know their definitions and their formulae of calculation? First insights on this give Lemke et al. (2019), also in regard to researchers’ personal preferences and concerns.
Following Hirsch (2020), the h-index is by no means a valid indicator of research quality; however, it is very common especially in the sciences and medicine. Probably, it is a convenient indicator for some researchers who want to avoid the hassle of laborious and time-consuming reviewing and scrutinizing other researchers’ œuvre. Apart from its convenience and popularity, and seen from an ethical perspective, one should consider what significance a single metric should have and how we—in general—want to further shape the future of research evaluation.
References
Abele-Brehm, A., & Bühner, M. (2016). Wer soll die Professur bekommen? Eine Untersuchung zur Bewertung von Auswahlkriterien in Berufungsverfahren der Psychologie. Psychologische Rundschau, 67, 250–261. https://doi.org/10.1026/0033-3042/a000335.
Aksnes, D. W., & Rip, A. (2009). Researchers’ perceptions of citations. Research Policy, 38(6), 895–905. https://doi.org/10.1016/j.respol.2009.02.001.
Amrhein, V., Greenland, S., & McShane, B. (2019). Retire statistical significance. Nature, 567(7748), 305–307. https://doi.org/10.1038/d41586-019-00857-9.
Askeridis, J. (2018). An h index for Mendeley: Comparison of citation-based h indices and a readership-based hmen index for 29 authors. Scientometrics, 117, 615–624. https://doi.org/10.1007/s11192-018-2882-8.
Bar-Ilan, J. (2008). Which h-index?—A comparison of WoS, Scopus and Google Scholar. Scientometrics, 74(2), 257–271. https://doi.org/10.1007/s11192-008-0216-y.
Bornmann, L., Mutz, R., & Daniel, H.-D. (2008). Are there better indices for evaluation purposes than the h index? A comparison of nine different variants of the h index using data from biomedicine. Journal of the American Society for Information Science and Technology, 59(5), 830–837. https://doi.org/10.1002/asi.20806.
Bornmann, L., Mutz, R., Hug, S. E., & Daniel, H.-D. (2011). A multilevel meta-analysis of studies reporting correlations between the h index and 37 different h index variants. Journal of Informetrics, 5, 346–359. https://doi.org/10.1016/j.joi.2011.01.006.
Buchanan, E. A., & Hvizdak, E. E. (2009). Online survey tools: Ethical and methodological concerns of human research ethics committees. Journal of Empirical Research on Human Research Ethics, 4(2), 37–48. https://doi.org/10.1525/jer.2009.4.2.37.
Buela-Casal, G., & Zych, I. (2012). What do the scientists think about the impact factor? Scientometrics, 92, 281–292. https://doi.org/10.1007/s11192-012-0676-y.
Alonso, S., Cabrerizo, F. J., Herrera-Viedma, E., & Herrera, F. (2009). H-index: A review focused in its variants, computation and standardization for different scientific fields. Journal of Informetrics, 3(4), 273–289. https://doi.org/10.1016/j.joi.2009.04.001.
Chen, C. M.-L., & Lin, W.-Y. C. (2018). What indicators matter? The analysis of perception toward research assessment indicators and Leiden Manifesto. The case study of Taiwan. In R. Costas, T. Franssen, & A. Yegros-Yegros (Eds.), Proceedings of the 23rd International Conference on Science and Technology Indicators (STI 2018) (12–14 September 2018) (pp. 688–698). Leiden, NL: Centre for Science and Technology Studies (CWTS). https://openaccess.leidenuniv.nl/bitstream/handle/1887/65192/STI2018_paper_121.pdf?sequence=1.
Cohen, J. (1988). Statistical power analysis for the behavioral science. (2nd ed.). Hillsdale: Lawrence Erlbaum. https://doi.org/10.4324/9780203771587.
Cohen, J. (1992). A power primer. Psychological Bulletin, 112(1), 155–159. https://doi.org/10.1037//0033-2909.112.1.155.
Costas, R., & Bordons, M. (2007). The h-index: Advantages, limitations and its relation with other bibliometric indicators at the micro level. Journal of Informetrics, 1(3), 193–203. https://doi.org/10.1016/j.joi.2007.02.001.
da Silva, J. A. T., & Dobranszki, J. (2018). Multiple versions of the h-index: Cautionary use for formal academic purposes. Scientometrics, 115(2), 1107–1113. https://doi.org/10.1007/s11192-018-2680-3.
Derrick, G. E., & Gillespie, J. (2013). A number you just can’t get away from: Characteristics of adoption and the social construction of metric use by researchers. In S. Hinze & A. Lottman (Eds.), Proceedings of the 18th International Conference on Science and Technology Indicators (pp. 104–116). Berlin, DE: Institute for Research Information and Quality Assurance. http://www.forschungsinfo.de/STI2013/download/STI_2013_Proceedings.pdf.
Destatis. (2019). Bildung und Kultur. Personal an Hochschulen (Fachserie 11, Reihe 4.4). Wiesbaden, Germany: Statistisches Bundesamt. https://www.destatis.de/DE/Themen/Gesellschaft-Umwelt/Bildung-Forschung-Kultur/Hochschulen/Publikationen/Downloads-Hochschulen/personal-hochschulen-2110440187004.html.
Deutscher Hochschulverband. (2020). Hochschullehrer-Verzeichnis 2020, Band 1: Universitäten Deutschland. 28th Ed. Berlin, New York: De Gruyter Saur. https://db.degruyter.com/view/product/549953.
Dilthey, W. (1895). Ideen über eine beschreibende und zergliedernde Psychologie. Sitzungsberichte der königlich preussischen Akademie der Wissenschaften zu Berlin, 7. Juni 1894, Ausgabe XXVI, Sitzung der philosophisch historischen Classe, 1–88. http://www.uwe-mortensen.de/Dilthey%20Ideen%20beschreibendezergliederndePsychologie.pdf.
Ding, J., Liu, C., & Kandonga, G. A. (2020). Exploring the limitations of the h-index and h-type indexes in measuring the research performance of authors. Scientometrics, 122(3), 1303–1322. https://doi.org/10.1007/s11192-020-03364-1.
Dinis-Oliveira, R. J. (2019). The h-index in life and health sciences: Advantages, drawbacks and challenging opportunities. Current Drug Research Reviews, 11(2), 82–84. https://doi.org/10.2174/258997751102191111141801.
Dorsch, I. (2017). Relative visibility of authors’ publications in different information services. Scientometrics, 112, 917–925. https://doi.org/10.1007/s11192-017-2416-9.
Dorsch, I., Askeridis, J., & Stock, W. G. (2018). Truebounded, overbounded, or underbounded? Scientists’ personal publication lists versus lists generated through bibliographic information services. Publications, 6(1), 1–9. https://doi.org/10.3390/publications6010007.
Farlin, J., & Majewski, M. (2013). Performance indicators: The educational effect of publication pressure on young researchers in environmental sciences. Environmental Science and Technology, 47(6), 2437–2438. https://doi.org/10.1021/es400677m.
Fietkiewicz, K. J., Lins, E., Baran, K. S., & Stock, W. G. (2016). Inter-generational comparison of social media use: Investigating the online behavior of different generational cohorts. In Proceedings of the 49th Hawaii international conference on system sciences (pp. 3829–3838). Washington, DC: IEEE Computer Society. https://doi.org/10.1109/HICSS.2016.477.
Geraci, L., Balsis, S., & Busch, A. J. B. (2015). Gender and the h index in psychology. Scientometrics, 105(3), 2023–2043. https://doi.org/10.1007/s11192-015-1757-5.
Haddow, G., & Hammarfelt, B. (2019). Quality, impact, and quantification: Indicators and metrics use by social scientists. Journal of the Association for Information Science and Technology, 70(1), 16–26. https://doi.org/10.1002/asi.24097.
Haladyna, T. M., & Rodriguez, M. C. (2013). Developing and validating test items. New York: Routledge. https://doi.org/10.4324/9780203850381.
Halevi, G., Moed, H., & Bar-Ilan, J. (2017). Suitability of Google Scholar as a source of scientific information and as a source of data for scientific evaluation. Review of the literature. Journal of Informetrics, 11(3), 823–834. https://doi.org/10.1016/j.joi.2017.06.005.
Hammarfelt, B., & Haddow, G. (2018). Conflicting measures and values: How humanities scholars in Australia and Sweden use and react to bibliometric indicators. Journal of the Association for Information Science and Technology, 69(7), 924–935. https://doi.org/10.1002/asi.24043.
Haustein, S. (2018). Metrics literacy [Blog post]. https://stefaniehaustein.com/metrics-literacy/
Haustein, S., & Larivière, V. (2015). The use of bibliometrics for assessing research: Possibilities, limitations and adverse effects. In I. Welpe, J. Wollersheim, S. Ringelhan, & M. Osterloh (Eds.), Incentives and performance: Governance of research organizations (pp. 121–139). Cham, CH: Springer. https://doi.org/10.1007/978-3-319-09785-5_8
Hilbert, F., Barth, J., Gremm, J., Gros, D., Haiter, J., Henkel, M., Reinhardt, W., & Stock, W. G. (2015). Coverage of academic citation databases compared with coverage of social media: Personal publication lists as calibration parameters. Online Information Review, 39(2), 255–264. https://doi.org/10.1108/OIR-07-2014-0159.
Hirsch, J. E. (2005). An index to quantify an individual’s scientific research output. Proceedings of the National Academy of Sciences of the United States of America, 102(46), 16569–16572. https://doi.org/10.1073/pnas.0507655102.
Hirsch, J. E. (2007). Does the h index have predictive power? Proceedings of the National Academy of Sciences of the United States of America, 104(49), 19193–19198. https://doi.org/10.1073/pnas.0707962104.
Hirsch, J. E. (2020). Superconductivity, What the h? The emperor has no clothes. Physics and Society, 49(1), 4–9.
Hirsch, J. E., & Buela-Casal, G. (2014). The meaning of the h-index. International Journal of Clinical and Health Psychology, 14(2), 161–164. https://doi.org/10.1016/S1697-2600(14)70050-X.
Hu, G. Y., Wang, L., Ni, R., & Liu, W. S. (2020). Which h-index? An exploration within the Web of Science. Scientometrics, 123, 1225–1233. https://doi.org/10.1007/s11192-020-03425-5.
Jan, R., & Ahmad, R. (2020). H-index and its variants: Which variant fairly assess author’s achievements. Journal of Information Technology Research, 13(1), 68–76. https://doi.org/10.4018/JITR.2020010105.
Jappe, A. (2020). Professional standards in bibliometric research evaluation? A meta-evaluation of European assessment practice 2005–2019. PLoSONE, 15(4), 1–23. https://doi.org/10.1371/journal.pone.0231735.
Kagan, J. (2009). The three cultures. Natural sciences, social sciences, and the humanities in the 21st century. Cambridge, MA: Cambridge University Press. https://www.cambridge.org/de/academic/subjects/psychology/psychology-general-interest/three-cultures-natural-sciences-social-sciences-and-humanities-21st-century?format=HB&isbn=9780521518420.
Kamrani, P., Dorsch, I., & Stock, W. G. (2020). Publikationen, Zitationen und H-Index im Meinungsbild deutscher Universitätsprofessoren. Beiträge zur Hochschulforschung, 42(3), 78–98. https://www.bzh.bayern.de/fileadmin/user_upload/Publikationen/Beitraege_zur_Hochschulforschung/2020/3_2020_Kamrani-Dorsch-Stock.pdf.
Kelly, C. D., & Jennions, M. D. (2006). The h index and career assessment by numbers. Trends in Ecology and Evolution, 21(4), 167–170. https://doi.org/10.1016/j.tree.2006.01.005.
Kowalski, C. J., & Mrdjenovich, A. J. (2016). Beware dichotomies. Perspectives in Biology and Medicine, 59(4), 517–535. https://doi.org/10.1353/pbm.2016.0045.
Krempkow, R., Schulz, P., Landrock, U., & Neufeld, J. (2011). Die Sicht der Professor/innen auf die Leistungsorientierte Mittelvergabe an Medizinischen Fakultäten in Deutschland. Berlin: iFQ–Institut für Forschungsinformation und Qualitätssicherung. http://www.forschungsinfo.de/Publikationen/Download/LOM_Professorenbefragung.pdf.
Kruger, J., & Dunning, D. (1999). Unskilled and unaware of it: How difficulties in recognizing one’s own incompetence lead to inflated self-assessments. Journal of Personality and Social Psychology, 77(6), 1121–1134. https://doi.org/10.1037/0022-3514.77.6.1121.
Kruskal, W. H., & Wallis, W. A. (1952). Use of ranks in one-criterion variance analysis. Journal of the American Statistical Association, 47(260), 583–621. https://doi.org/10.1080/01621459.1952.10483441.
Kulczycki, E., Engels, T. C. E., Pölönen, J., Bruun, K., Dušková, M., Guns, R., Nowotniak, R., Petr, M., Sivertsen, G., Istenič Starčič, A., & Zuccala, A. (2018). Publication patterns in the social sciences and humanities: Evidence from eight European countries. Scientometrics, 116(1), 463–486. https://doi.org/10.1007/s11192-018-2711-0.
Kyvik, S. (1990). Age and scientific productivity. Differences between fields of learning. Higher Education, 19, 37–55. https://doi.org/10.1007/BF00142022.
Lemke, S., Mehrazar, M., Mazarakis, A., & Peters, I. (2019). “When you use social media you are not working”: Barriers for the use of metrics in Social Sciences. Frontiers in Research Metrics and Analytics, 3(39), 1–18. https://doi.org/10.3389/frma.2018.00039.
Likert, R. (1932). A technique for the measurement of attitudes. Archives of Psychology, 22(140), 5–55.
Linde, F., & Stock, W. G. (2011). Information markets. Berlin, New York: De Gruyter Saur. https://doi.org/10.1515/9783110236101.
Ma, L., & Ladisch, M. (2019). Evaluation complacency or evaluation inertia? A study of evaluative metrics and research practices in Irish universities. Research Evaluation, 28(3), 209–217. https://doi.org/10.1093/reseval/rvz008.
Mann, H., & Whitney, D. (1947). On a test of whether one of two random variables is stochastically larger than the other. Annals of Mathematical Statistics, 18(1), 50–60. https://doi.org/10.1214/aoms/1177730491.
Martin-Martin, A., Orduna-Malea, E., Thelwall, M., & Lopez-Cozar, E. D. (2018). Google Scholar, Web of Science, and Scopus: A systematic comparison of citations in 252 subject categories. Journal of Informetrics, 12(4), 1160–1177. https://doi.org/10.1016/j.joi.2018.09.002.
Meschede, C., & Siebenlist, T. (2018). Cross-metric compatibility and inconsistencies of altmetrics. Scientometrics, 115(1), 283–297. https://doi.org/10.1007/s11192-018-2674-1.
Mongeon, P., & Paul-Hus, A. (2016). The journal coverage of Web of Science and Scopus: A comparative analysis. Scientometrics, 106(1), 213–228. https://doi.org/10.1007/s11192-015-1765-5.
Neufeld, J., & Johann, D. (2016). Wissenschaftlerbefragung 2016. Variablenbericht – Häufigkeitsauszählung. Berlin: Deutsches Zentrum für Hochschul- und Wissenschaftsforschung. https://www.volkswagenstiftung.de/sites/default/files/downloads/Wissenschaftlerbefragung%202016%20-%20Variablenbericht%20-%20H%C3%A4ufigkeitsausz%C3%A4hlungen.pdf
Packalen, M., & Bhattacharya, J. (2015). Age and the trying out of new ideas. Cambridge, MA: National Bureau of Economic Research. (NBER Working Paper Series; 20920). http://www.nber.org/papers/w20920.
Pearson, K. (1900). On the criterion that a given system of deviations from the probable in the case of a correlated system of variables is such that it can be reasonably supposed to have arisen from random sampling. The London, Edinburgh, and Dublin Philosophical Magazine and Journal of Science. Series, 50(302), 157–175.
Penny, D. (2016). What matters where? Cultural and geographical factors in science. Slides presented at 3rd altmetrics conference, Bucharest, 2016. https://figshare.com/articles/What_matters_where_Cultural_and_geographical_factors_in_science/3969012.
Rousseau, R., Egghe, L., & Guns, R. (2018). Becoming metric-wise: A bibliometric guide for researchers. Cambridge, MA: Chandos.
Rousseau, S., & Rousseau, R. (2015). Metric-wiseness. Journal of the Association for Information Science and Technology, 66(11), 2389. https://doi.org/10.1002/asi.23558.
Rousseau, S., & Rousseau, R. (2017). Being metric-wise: Heterogeneity in bibliometric knowledge. El Profesional de la Informatión, 26(3), 480–487.
Rowlands, I., Nicholas, D., William, P., Huntington, P., Fieldhouse, M., Gunter, B., Withey, R., Jamali, H. R., Dobrowolski, T., & Tenopir, C. (2008). The Google generation: The information behaviour of the researcher of the future. Aslib Proceedings, 60(4), 290–310. https://doi.org/10.1108/00012530810887953.
Snow, C. P. (1959). The two cultures and the scientific revolution. Cambridge: Cambridge University Press.
Stock, W. G. (2001). Publikation und Zitat. Die problematische Basis empirischer Wissenschaftsforschung. Köln: Fachhochschule Köln; Fachbereich Bibliotheks- und Informationswesen (Kölner Arbeitspapiere zur Bibliotheks- und Informationswissenschaft; 29). https://epb.bibl.th-koeln.de/frontdoor/deliver/index/docId/62/file/Stock_Publikation.pdf.
Stock, W. G., & Stock, M. (2013). Handbook of information science. De Gruyter Saur. https://doi.org/10.1515/9783110235005.
Sugimoto, C. R., & Larivière, V. (2018). Measuring research: What everyone needs to know. New York: Oxford University Press.
Tetzner, R. (2019). What is a good h-index required for an academic position? [Blog post]. https://www.journal-publishing.com/blog/good-h-index-required-academic-position/.
Thelwall, M., Haustein, S., Larivière, V., & Sugimoto, C. R. (2013). Do altmetrics work? Twitter and ten other social web services. PLoS ONE, 8(5), e64841. https://doi.org/10.1371/journal.pone.0064841.
Vehovar, V., Toepoel, V., & Steinmetz, S. (2016). Non-probability sampling. In C. Wolf, D. Joye, T. W. Smith, & Y.-C. Fu (Eds.), The SAGE handbook of survey methodology. (pp. 327–343). London: Sage. https://doi.org/10.4135/9781473957893.n22.
Vera-Baceta, M. A., Thelwall, M., & Kousha, K. (2019). Web of science and Scopus language coverage. Scientometrics, 121(3), 1803–1813. https://doi.org/10.1007/s11192-019-03264-z.
Waltman, L., & van Eck, N. J. (2012). The inconsistency of the h-index. Journal of the American Society for Information Science and Technology, 63(2), 406–415. https://doi.org/10.1002/asi.21678.
Funding
Open Access funding enabled and organized by Projekt DEAL. No external funding.
Author information
Authors and Affiliations
Contributions
Conceptualization: PK, ID, WGS; Methodology: PK, ID, WGS; Data collection: PK; Writing and editing: PK, ID, WGS; Supervision: WGS.
Corresponding author
Ethics declarations
Conflict of interest
No conflicts of interest, no competing interests.
Appendices
Appendix 1: List of all questions (translated from German)
Appendix 2: Data analysis plan (intuitive sketch)

Rights and permissions
Open Access This article is licensed under a Creative Commons Attribution 4.0 International License, which permits use, sharing, adaptation, distribution and reproduction in any medium or format, as long as you give appropriate credit to the original author(s) and the source, provide a link to the Creative Commons licence, and indicate if changes were made. The images or other third party material in this article are included in the article's Creative Commons licence, unless indicated otherwise in a credit line to the material. If material is not included in the article's Creative Commons licence and your intended use is not permitted by statutory regulation or exceeds the permitted use, you will need to obtain permission directly from the copyright holder. To view a copy of this licence, visit http://creativecommons.org/licenses/by/4.0/.
About this article

Cite this article
Kamrani, P., Dorsch, I. & Stock, W.G. Do researchers know what the h-index is? And how do they estimate its importance?. Scientometrics 126, 5489–5508 (2021). https://doi.org/10.1007/s11192-021-03968-1
Received:
Accepted:
Published:
Issue Date:
DOI: https://doi.org/10.1007/s11192-021-03968-1