
Abstract
The purpose of this research is to identify topics in library and information science (LIS) using latent Dirichlet allocation (LDA) and to visualize the knowledge structure of the field as consisting of specific topics and its transition from 2000–2002 to 2015–2017. The full text of 1648 research articles from five peer-reviewed representative LIS journals in these two periods was analyzed by using LDA. A total of 30 topics in each period were labeled based on the frequency of terms and the contents of the articles. These topics were plotted on a two-dimensional map using LDAvis and categorized based on their location and characteristics in the plots. Although research areas in some forms were persistent with which discovered in previous studies, they were crucial to the transition of the knowledge structure in LIS and had the following three features: (1) The Internet became the premise of research in LIS in 2015–2017. (2) Theoretical approach or empirical work can be considered as a factor in the transition of the knowledge structure in some categories. (3) The topic diversity of the five core LIS journals decreased from the 2000–2002 to 2015–2017.
Introduction
Background
Investigating the kind of research being done in a field of research involves understanding the knowledge structure of that field and, in turn, revealing the identity of that field. In library and information science (LIS), such investigations have been undertaken since the 1970s using a variety of approaches. However, the topic modeling approach has recently garnered considerable attention. This approach is a type of big data analysis of words in articles that can reveal hidden relationships between them and can sometimes find non-thematic topics. This article uses this topic modeling approach to clarify the knowledge structure of LIS.
Literature Review
Content Analysis
Content analysis is used to identify and record the meanings of documents in a systematic and quantitative way (Allen and Reser 1990). In LIS, surveys to examine trends of research based on content analysis began in the 1970s. Atkins (1988) conducted a content analysis of research articles published from 1975 to 1984 and found a list of 58 subjects in LIS. As recently as the 2000s, information retrieval (IR) was consistently the subject of approximately 30% of research articles in LIS (Jarvelin and Vakkari 1993, Pettigrew and McKechnie 2001, Koufogiannakis et al. 2004, Miyata et al. 2010).
A survey by Tuomaala et al. (2014), which was a follow-up to the analysis by Jarvelin and Vakkari (1993), examined data from 718 articles in 2005. They found that information storage and retrieval (30%) was the most common subdomain of LIS, followed by scientific and professional communication (24%), library and information service activities (17%), and information seeking (12%). This survey also revealed that other research topics in LIS had been rarely studied (Tuomaala et al. 2014).
Some studies have conducted a content analysis of LIS research by country, such as Denmark (Kajberg 1996), Japan (Sugiuchi et al. 2011), Spanish-speaking countries (Kawalec 2013), and India (Dora and Kumar 2017).
Content analysis is the method of reading articles to identify topics and assigning prepared subject headings or classification numbers to them. It is necessary to prepare an appropriate classification system to this end. Jarvelin and Vakkari (1993) proposed a classification system, but Tuomaala et al. (2014) showed that generative subjects needed to be added to it.
Content analysis is limited in tracking long-term transitions in research. Furthermore, because it is based on manual work, the number of articles analyzed is always limited.
Citation Analysis
White and Griffith (1981) mapped information science (IS) using authors as units of analysis and the co-citation of pairs of authors as the variable. They chose 39 authors, formed author pairs using a citation index to determine the number of co-cited articles, and plotted a co-citation matrix in two dimensions using MDSCAL. They found that “information science lacks a strong central author, or group of authors, whose work orients the work of others across the board, and the field consists of several specialties around a weak center” (White and Griffith 1981, p. 343). Also, they successfully identified and visualized specialties that constitute IS. Their results were confirmed by the consensus among researchers on the correctness of the knowledge structure that they had attributed to IS. Moreover, the study has been appreciated as pioneering the use of a quantitative approach to identify the knowledge structure of a research field.
Since then, a large number of studies have used author co-citation analysis. For example, Zhao and Strotmann (2008) introduced author bibliographic coupling analysis. They observed that research on webometrics was active in the years 2001–2005 but appeared to have declined since. Similarly, research on information retrieval was no longer an active research area although it had attracted a number of researchers in the years 1996–2000. Yang et al. (2016) proposed author keyword coupling analysis (AKCA) to visualize the intellectual structure of information science and used the data analyzed by Zhao and Strotmann (2008). They labeled factors obtained by the AKCA as bibliometrics, IR, and information behavior, mapping of science, research performance, impact and ranking, patent analysis, and digital library. Citation analysis has been most frequently used to elucidate trends in a research field, and is becoming more sophisticated over time.
Another approach to co-citation is document co-citation. Hou et al. (2018) analyzed emerging trends and new developments in information science in the years 2009–2016 through document co-citation. In their study, they found that the positions of certain core topics found in the previous studies (i.e., information retrieval, webometrics, and citation behavior) had been replaced by other topics (i.e., scientometric indicators, citation analysis, scientific collaboration, and information behavior) in the recent period.
Analysis of Co-occurring Words
In addition to analyzing the structure of a field by grouping authors through citation information in articles, some studies have used co-occurrence word analysis. Co-occurrence word analysis has been used to clarify the relatedness of co-occurring words from different articles and has often been used to analyze a combination of co-citation and co-author relations to identify topics. Milojevic et al. (2011) identified three main branches of LIS—LS (academic/public/school librarianship, information literacy, technology, policy, the Web, knowledge management, and others), IS (information retrieval, Web search, catalogs, and databases), and scientometrics/bibliometrics (SCI-BIB).
Topic Modeling and LDA
The last 20 years have witnessed a rise in the number of studies using topic modeling in a large number of articles. Probabilistic Latent Semantic Analysis (PLSA) is a traditional method used to classify a large amount of bibliographic data. Wang and McCallum (2006) presented Topics over Time (TOT), which is a topic modeling method that models timestamp values in order to discuss the topics’ occurrence and correlation changes over time.
Blei et al. (2003) proposed latent Dirichlet allocation (LDA) as an approach that represents topic in documents by using a mixture of words to analyze how topics had changed over time. Since then, topic modeling has focused on LDA. Blei and Lafferty (2006) applied LDA to analyze trends in the journal Science. They collected 30,000 articles and gleaned 7.5 million words from them by stemming each term to its root. They also removed function terms as well as terms occurring fewer than 25 times. LDA has also been used for topic modeling in computer linguistics (Hall et al. 2008), statistics (De Battisti et al. 2015), international speech communication (Liu et al. 2015), and software engineering (Dam and Ghose 2016).
Some studies have examined trends of research in LIS using LDA, as shown in Table 1. Sugimoto et al. (2011) indicated that the main topics in LIS had changed significantly from those in the initial period (1930–1969) to what was then 2000 through 2009. The main topics from 2000 through 2009 were information use; the Internet; information-seeking behavior; information retrieval and user centeredness; and information retrieval and classification. The study showed that LDA can be used to map trends in LIS over long periods.
Lu and Wolfram (2012) identified 20 topics and presented an LDA map consisting of informetric laws, scientific impact evaluations, webometrics and search engine analysis, and information retrieval. They concluded that “the overall layout of the clusters in the LDA map is more distinctive than the word-based maps” (Lu and Wolfram 2012, p. 1981).
Yan (2014) found research topics as follows: Web information retrieval, citation and bibliometrics, system and technology, health science, the h-index, online communities, data preservation, social media, and Web analysis. Yan (2015) also stated that topics related to online technologies, informetrics, information retrieval systems, health communication and informetrics, and online social networks have become popular over the last few decades. On the contrary, topics concerning books, collections, and cataloging have declined in popularity.
Figuerola et al. (2017) applied LDA to identify and label the main topics and categories in the corpus. Their quantitative results identified 19 important topics that were grouped into four areas: processes, information technology, library, and specific areas of information application.
Kurata et al. (2018) analyzed LDA results for five LIS journals by the ratio of articles. They showed that a few topics were stable in the periods and others were influenced by journals’ orientation (i.e. library science or information science) and publication periods. Lamba and Madhusudhan (2019) mapped the topics in DESIDOC Journal of Library and Information Technology for the period of 1981–2018 using LDA and found that bibliometrics, information and communication technology (ICT), information retrieval, and user studies were highly researched areas in India during the period.
Studies using LDA in subdomains of LIS have also been conducted, including information retrieval (Chen et al. 2017a), knowledge organization (Joo et al. 2018), and electronic health records (Chen et al. 2017b).
Research Questions
Understanding the knowledge structure of research fields using traditional research methods was intended to provide a big picture of these areas (Borner et al. 2003). In other words, the aim was to draw a map of the given research area consisting of subfields. On the contrary, research using LDA is intended to clarify the changes in topics over time, and it can help reveal new aspects of research on LIS. The purpose of this research is to understand the knowledge structure of LIS using specific topics identified by LDA and visualize the big picture of the field consisting of them. Moreover, it describes the transition of the knowledge structure between specific periods (2000–2002 and 2015–2017).
We chose academic articles published in core journals as a source of information to reflect the knowledge structure of LIS. As a result, our datasets are not very large. Then we decided to use the full text, not the article title and abstract, although all previous studies using LDA to investigate research trends in LIS have used titles and abstracts. This is because Syed and Spruit (2017) applied LDA to four kinds of datasets of articles; two of them were title and abstracts, the other two were full texts. This showed that terms of topics obtained by LDA had not been appropriate in small datasets constructed with titles and abstracts.
We selected the two periods (2000–2002 and 2015–2017) to understand the transition of the knowledge structure in LIS. The period 2015–2017 coincides with the beginning of this research, and the period 2000–2002 (15 years ago) is a sufficient amount of time for a marked transition to have occurred. This is especially true given that 10–20 years has been chosen as the period to observe changes in previous research (Jarvelin and Vakkari 1993, Tuomaala et al. 2014). Moreover, the time around 2000–2002 was when the Internet was becoming popular and its influence was becoming noticeable.
We refer not only to its top five most frequently used terms but also its title, abstract, and full text because topic label in previous studies was difficult to understand. Additionally, we categorize the topics and analyze the knowledge structure of the field by visualizing the distance between pairs of labeled topics using a two-dimensional (2D) map. Next, we examine the transition of the knowledge structure in the two periods mentioned. Finally, we analyze the relationship between journals and topics, which has not been considered in previous research.
Summarizing the above, the research questions for this study are as follows.
-
(1)
Which categories are identified as research areas using the 2D map?
-
(2)
What kinds of transitions are seen in the two periods among categories and topics?
-
(3)
What kinds of relationships are observed between topics and journals, and what are the transitions in this relationship between the periods?
Method
Data Collection
The data used for topic modeling were derived from research articles published in core LIS journals. We selected journals that were peer-reviewed, had high prestige among researchers, belonged to the LIS domain, were not narrowly specialized, and continually published a sufficient number of articles per year. Although it is possible to obtain metadata for a large number of articles from databases, such databases include not only peer-reviewed journals, but also magazine articles and other non-peer-reviewed sources. Moreover, the journals selected using the Journal Citation Report (JCR) include those that are said not to be considered core journals in LIS. We thus selected five journals given that previous studies identified core journals.
Nixon (2014) reviewed tiered or ranked lists of LIS journals, and proposed an expert opinion study and a citation study for such research. Kohl and Davis (1985) asked deans of library schools accredited by the American Library Association and directors of the Association of Research Libraries about representative journals in LIS. Follow-up studies were published by Blake (1996), Nisonger and Davis (2005), and Manzari (2013). The ranking by deans of LIS faculty in each result are summarized in Table 2. Because of the newness and the sample size, we selected the top five journals according to the result by Manzari (2013) as our datasets.
Information Processing & Management (IPM), Journal of Documentation (JDOC),Journal of the Association for Information Science and Technology (JASIST), Library & Information Science Research (LISR), and Library Quarterly (LQ) were selected. The articles that were included in special issues such as “Special Issue; Digital Libraries” (Volume 51, Issue 4) were excluded from our sample because of their negative influence on topic extraction. We acquired the full text of 1648 articles from HTML files from each journal’s online platform. This number of articles is similar to the small number of articles surveyed by Syed and Spruit (2017). We also considered it appropriate to use the full text of the articles. The number of the articles in two periods is shown in Table 3.
Experimental Settings
Preprocessing for the full text was performed as follows: (1) All letters were converted to lower case. (2) Stop words from the NLTK library (available at https://www.nltk.org/nltk_data/) (e.g., a, it, not, etc.), functional words, words containing numbers, and words frequently used in research articles (e.g., table, figure) were removed. (3) The remaining words were stemmed by Porter’s algorithm; (4) Frequently used words that had appeared in more than 90% of our datasets and rare words appearing fewer than nine times were removed.
LDA was performed using Python’s gensim library (available at https://radimrehurek.com/gensim/index.html) for each period. The number of iterations was set to 500 and the other parameters were set according to the standard setting of gensim. The number of topics was set to 30 based on previous research.
Labels were assigned to the 30 topics in each period. Topic labels were determined by the agreement of the authors based on the top 10 most frequently used terms as well as the metadata and full text with a probability of over 0.5 for a given topic. In this study, preliminary analysis was conducted with multiple parameter settings and different numbers of topics. The most interpretable settings were then selected.
LDAvis was then used to interpret the results visually. It can plot topics on a 2D scale and the sizes of topics in the plot represent the ratios of topic probabilities. Topic probabilities are calculated by aggregate of the probability of all articles in each topic. We used pyLDAVis (available at https://github.com/bmabey/pyLDAvis), which is a Python implementation of LDAVis (available at https://CRAN.R-project.org/package=LDAvis).
Based on their location and proximity in the plots, the topics were categorized. We analyzed changes in the categories and topics between 2000–2002 and 2015–2017. By comparing the distributions of topic probabilities, changes in the specializations of the journals were explored.
Results
Labeling the Topics
The process of labeling is explained using the topic Modeling student information-seeking behavior in the period 2000–2002 as an example. First, we examined the top five most frequently used terms in this topic (student, search, device, user, and database) indicated by LDA. Considering the topic labels from these five words, student or users searching databases or some device was assumed to be appropriate. Then, we examined the titles, abstracts, and full texts of the articles with probabilities of higher than 0.5 for this topic (eight articles). The titles and authors of articles with a probability of higher than 0.7 for this topic are shown in Table 4. Half of the articles focused on students and search behavior in various search systems was targeted rather than specific databases. Moreover six out of eight articles conducted theoretical modeling of information behavior than an empirical survey. For example, the first article in Table 4 modeled the user’s coding of information received from an IR system using Kintsch’s theory. Based on the above features, this topic was labeled Modeling student information-seeking behavior. In this example, the top five most frequently used terms did not represent this topic.
All thirty topics were similarly labeled. The results are as shown in Table 5 for 2000–2002 and Table 6 for 2015–2017.
Categorization of Topics
Thirty topics were placed on a 2D plot for each of the two periods and were categorized based on their locations and contents. Starting from where similar topics were overlapped, the extent to which the topics around the starting point could be included in one category was examined. If two topics were located in the same place but had different content, they were classified into different categories. We have reported briefly categories between periods in Miyata et al. (2018), but here we added description of each category and discussed insights in transition of categories between periods.
Categories in 2000–2002. Figure 1 shows a 2D plot of thirty topics and categories in 2000–2002. The topics were grouped into the following six categories: Information Retrieval, Information Search and User, Library, Scholarly Communication, Library and Information Science, and Bibliometrics.

Topics and categories in 2000–2002
The Information Retrieval category was used to identify the place (location) where several topics (Multilingual IR, Image retrieval, and Word similarity) overlapped. This category denoted various types of IR, and topics on theories and methods supporting the IR systems. The topics Query expansion and database compression and Stemming and lemmatization were also included into the category because they are related methods to IR. Although the topic Document analysis overlapped with Modeling student information-seeking behavior, only Document analysis was included in the Information Retrieval category according to the labels.
The Bibliometrics category consisted of only the topic Bibliometrics and statistical method.
The Information Search and User category was used to identify overlapping topics related to search behavior, such as Interaction in information seeking behavior. Despite this, the category also included topics focusing on system development (e.g., Information architecture and UI). Therefore, rather than Information Search Behavior, Information Search and User was chosen as the name of the category to denote the broader context.
The Library category was used to identify the overlap between Roles of public library and Library and print media. The topic Research and education in LIS which did not focus on libraries was included in the Library category. This is because in the map, it overlapped almost completely with the Library category but was significantly far from the LIS category, which would otherwise be considered its natural abode based on the content.
The Scholarly Communication category was used to identify the overlap between the topics Internet impact on scholarly communication and Social network in discipline. The topic Economy of digital academic publishing was close to the Library category, but its contents were unrelated to the library and instead pertained to scholarly communication.
As Topic Epistemology in LIS had the unique feature in that it philosophically examines LIS, the Library and Information Science category was created as an independent category.
Categories in 2015–2017. Figure 2 shows a 2D plot of the thirty topics and the categories in 2015–2017. The topics in 2015–2017 were divided into the following five categories: Information Retrieval, Information Search and User, Library, Scholarly Communication, and Tweet Analysis.

Topics and categories in 2015–2017
The Information Retrieval category was based on two topics, IR algorithm and Classification and selection algorithm, related to the IR algorithm.
The Tweet Analysis category was centered on the topic Twitter. It included topics analyzing big data, with tweets (posts to SNS) such as those on Feature extraction from the Web, for example. The topic Recommendation system overlapped with the topic IR algorithm in Information Retrieval category but did not deal with an IR algorithm. It consisted of articles on the analysis of tweets. Therefore, the topic Recommendation system was included in the Tweet Analysis category.
The Information Search and User category spanned from the topic Health information search behavior, located on the left, to the topic Search strategies during task, located at the center. This category included topics on typical information behavior research and ones focusing on systems for searching, such as News sites and business intelligence, the effects of using SNS (Emotion in social media), and the attention or interests in search in diverse environments (Motivation). Therefore, the category was called Information Search and User instead of Information-seeking Behavior.
The Scholarly Communication category summarized topics dealing with the structure of academic communication (Network of academic knowledge), and those related to the evaluation and analysis of research achievements (Research evaluation). The topic Research data sharing was close to Information Search and User category but was included in Scholarly Communication because it had been a latest topic of that.
Library was a category consisting only of the topic Philosophical approach to the library and document. This topic deals with libraries and documents from a philosophical perspective (e.g., public space and publicity) and, according to its content, this category is different from Information Search and User or Scholarly Communication.
Transition of Categories Between Periods
Overview of changes. The categories Library and Information Science and Bibliometrics were only identified in the 2000–2002 period. The category Bibliometrics included only the topic of bibliometrics and statistical method, which contained theoretical articles on bibliometrics, in 2000–2002. In 2015–2017, research applying bibliometric approaches, such as the topic of research evaluation belonged to the category Scholarly Communication and the category Bibliometrics was no longer independent.
The category identified only in the 2015–2017 period was Tweet analysis. In 2000–2002, there was no work on the analysis of big data, and so this topic was not identified.
Changes in the same category. In the category Information Retrieval, the number of topics decreased significantly in 2015–2017. This category in 2000–2002 contained theoretical views on IR system development, and empirical analyses of different kind of IR systems. However, the category in 2015–2017 contained only two topics, both focusing on more abstract algorithms.
The category Library in 2000–2002 contained topics focusing on library services and functions of the library. This category in 2015–2017 contained only one topic focusing on the library function. The category Users and Information Search in 2000–2002 contained 10 topics and then 16 in 2015–2017. This category was altered to cover broader concepts in the periods 2000–2002 and 2015–2017. In 2000–2002, it included topics focusing on information search using a new technology or system on the Web in the traditional framework of information search behavior (e.g., Topic Web information-seeking behavior of children and students). On the other hand, in this category in 2015–2017, there is no longer a topic that emphasizes the use of the Web for information behavior. As the Web has become the premise of research, focus of topics became a specific context, such as health information or various communities online. Furthermore, the category included topics that focused on emotions and motivation on the Web and was not limited to traditional information search behavior directed toward a clear goal.
In the category Scholarly Communication, there were four topics in 2000–2002 and six in 2015–2017. In 2000–2002, three of its four topics focused on changes to scholarly communications through the Internet and digital environments. In 2015–2017, the topics included new features and systems of scholarly communication, such as open access and data sharing, due to the influence of the Internet and digital environments (e.g., Scholarly communication and OA). Furthermore, it included topics related to the evaluation of research results as scholarly communication using bibliometrics. (e.g., Analysis of authors).
Relationships Between Topics and Journals
We analyzed the transitions in the journals based on the topics. For each topic, the characteristics of the journals were viewed in terms of probability distributions of topics per journal and calculated as follows: (1) sum of topic probability for each article per journal and (2) standardize the value by dividing by the number of articles. Tables 7 and 8 show the relationships between topics and journals using probability distributions of topics per journal.
Topics with a probability higher than 0.1 were regarded as those with which the journal mainly dealt. In 2000–2002, the probability of Roles of public library, (Topic 25) for LQ was 0.42, the highest value among all topics in all journals. Approximately 40% of the contents of the journal as a whole had some relationship with the topic Roles of public library. It was followed by the topics Research and education in LIS (Topic 24) and Epistemology in LIS (Topic 26). LQ had strong relationships with topics on theoretical and philosophical approaches to LIS. On the contrary, LQ had a near zero probability for IR-related topics and those focusing on empirical approaches to library services, such as Library services on the Internet (Topic 23).
The topic specialties were also seen in other journals. The topic Roles of public library also had the highest probability in LISR (0.22). In IPM, IR-related topics, such as Word similarity (for document retrieval) (Topic 11) (0.10) and Query expansion and database compression (Topic 8) (0.13) had probabilities higher than 0.1. In JDOC, only Economy of digital academic publishing (Topic 27) (0.15) had a probability higher than 0.1.
On the contrary, JASIST in 2000–2002 did not contain a topic exceeding a probability of 0.1 but had no topic with a near-zero probability (p < 0.01). It can be concluded that JASIST uniformly treated various research topics in LIS.
In 2015–2017, LQ was highly biased toward Health information search behaviors (Topic 6) (0.45) and Philosophical approach to the library and document (Topic 19) (0.26). The topic of Health information search behaviors was also highly rated in JDOC and LISR (0.25 for both).
IPM had the same tendency in 2000–2002, whereby IR-related topics such as IR algorithm (Topic 2) (0.13) and SNS-related topics such as Twitter (Topic 30) (0.12) had a probability of over 0.1.
The topic Research evaluation (Topic 24) had the highest probability of 0.17 in JASIST, which did not have any other topic over 0.1 in 2000–2002. However, JASIST also maintained topic generality because it did not have a topic with a near-zero probability.
We measured topical diversity by calculating the standard deviation of topic distribution for each journal in the two periods. A large standard deviation indicated a large bias in the topics, and a small standard deviation indicated a diversity of topics. Figure 3 shows the transition of standard deviation in the two periods.
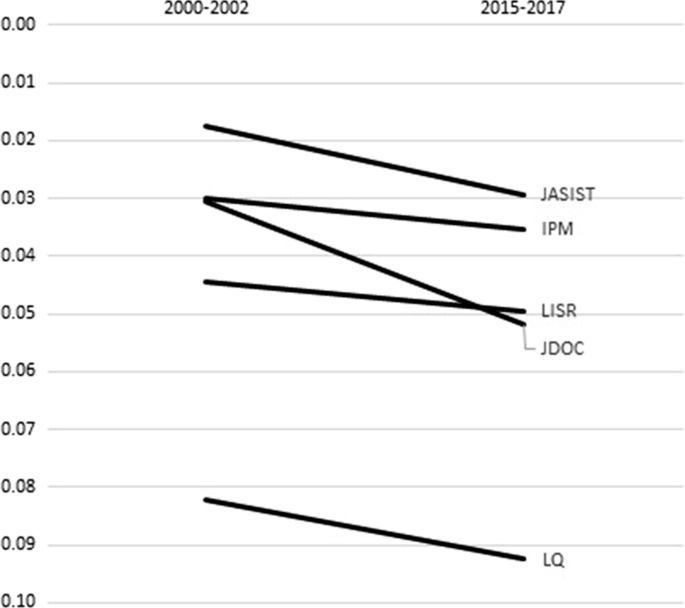
Comparison of standard deviation in the two periods by each journal
For each journal, LQ had the largest standard deviation in the two periods, which increased in 2015–2017. Its bias toward topics was the largest of all journals. Meanwhile, JASIST in 2000–2000 had the smallest standard deviation and bias for topics. JASIST had a smaller standard deviation in each period and the largest diversity of topics.
In 2000–2002, the standard deviation of JDOC had a similar value to that of IPM. But in 2015–2017, the bias of JDOC became very large and followed that of LQ. In other words, the diversity of JDOC decreased the most in five journals. IPM and LISR were more or less stable.
The standard deviations for all journals in 2015–2017 were higher than those in 2000–2002. This means that bias in topic distribution increased. This result indicates that topic diversity in core LIS journals decreased compared with that in 2000–2002.
Discussion
For the categorization of topics into research areas (RQ1), we found some commonalities with the results of previous studies using co-citation analysis and content analysis. For example, the classic research by White and Griffith (1981) clarified the knowledge structure in IS by author co-citation analysis. They identified the five categories in IS, and the three thematic research areas of it (i.e. IR, Bibliometrics, Scientific Communication) which are all included in the six categories found in the 2000–2002 period in our results. Furthermore, the other two areas excluded Bibliometrics persisted in 2015–2017. Thus, research areas discovered 40 years ago have persisted to the present in some form.
Comparing with other LDA studies in LIS, the declining library topics in our results was similar to the study by Sugimoto et al. (2011) and that by Figuerola et al. (2017). Concerning information retrieval and informetric laws, which were two of the main clusters in a study by Lu and Wolfram (2012), our two-period and journal-based analysis revealed a drop in the LIS domain. In contrast to Yan (2015), Journal based analysis indicated a decline of the diversity of topics in all five journals. The difference could be attributed to the fact that Yan analyzed long-term macro trends from the early days of LIS, while our analysis concerned trends after 2000. Especially, JASIST’s specialization in bibliometrics coincidenced with a citation analysis by Nicolaisen and Frandsen (2015).
The key points of the transition of the knowledge structure in LIS from 2000–2002 to 2015–2017 (RQ2) are as follows:
-
(1)
The Internet became the premise of research in LIS.
-
(2)
A relationship was established between research on theoretical modeling and its application.
First, in 2000–2002, Internet impact and Web information seeking had already been identified as keywords for topics. By 2015–2017, the use of the Web had become a premise and ceased to be identified as a topic. Instead of discussing the holistic effects of the Internet, the use of new services and means of communication, such as Twitter in the Tweet Analysis category and open access in the topic Scholarly communication and OA, were emphasized as research issues.
Second, the question of whether given research is a theoretical approach or an empirical work can be considered a factor in the transition of the knowledge structure in the categories Information Retrieval, Bibliometrics, as well as various topics related to IR which were identified in Information Retrieval in 2000–2002. However, only one topic focused on IR algorithms in 2015–2017. Hjørland (2017) cited Bawden’s blog post about IR following: “[Thirty] years ago, it [IR] was clearly part of LIS, and very few computer scientists took it seriously; 15 years ago it was spread across the boundary lines of the disciplines; now, the party line is that it is an integral part of computer science.” This indicates that research on IR is published in journals dedicated to fields other than the core LIS journals. We identified the category Tweet Analysis as a new category in 2015–2017. This can be considered an applied research from of IR in the Web environment. Bibliometrics in 2000–2002 contained only one topic, and in 2015–2017 was no longer identified. This indicates that research applying bibliometric methods came to be part of scholarly communication. With the spread (generalization) of the bibliometric method, there is no topic on which bibliometrics itself focuses.
Regarding the relationship between topics and journals (RQ3), we found that the topic diversity of the five core LIS journals decreased from 2000–2002 to 2015–2017. One reason for a decline in topic diversity is that these journals have become highly competitive, and the range of topics for which it is easier to obtain acceptance for publication in these journals has narrowed regardless of the subject.
Conclusion
We explored the transition of knowledge structure of LIS in the years 2000–2002 and 2015–2017, using LDA. Our results indicated that there were drastic changes in topics while there were slight changes in categories. Technological advances and new digital environments have generated changes in topics. Because LIS was established before the millennium, the categories were less variable. Therefore, the more the digital environment was introduced to LIS, the more the changes in topics would accelerate. Thus, we comprehend the transition of topics that shape the core of LIS.
Our results were based on an analysis of 1648 articles published in five core LIS journals. Because of the difficulty in obtaining full text data, our experiment utilized a relatively small dataset, but using full text can lead to extracting more detailed topics. Journal selection for bibliometric analysis is always a difficult task. Articles published in JASIST accounts for 52% of our dataset. Although we thought that was the actual state of the core LIS area and used it as our dataset, we may be missing out on the diversity of LIS in the broad sense. Notably, articles about bibliometrics and informetrics were published in specialized journals such as Scientometrics and Journal of Informetrics. Including such journals might give us insights into the relationship between core topics and specialized topics. Future research may examine a broader range of journals and a greater amount of full text data to get a more in-depth understanding of the knowledge structure of LIS.
References
Allen, B., & Reser, D. (1990). Content analysis in library and information science research. Library & Information Science Research, 12(3), 251–262.
Atkins, S. E. (1988). Subject trends in library and information science research 1975–1984. Library Trends, 36(4), 633–658.
Blake, V. L. (1996). The perceived prestige of professional journals, 1995: A replication of the Kohl–Davis study. Education for Information, 14(3), 157–179.
Blei, D. M., & Lafferty, J. D. (2006). Dynamic topic models. In Proceedings of the 23rd international conference on machine learning (pp. 113–120). Pittsburgh: ACM.
Blei, D. M., Ng, Y. A., & Jordan, M. I. (2003). Latent Dirichlet allocation. Journal of Machine Learning Research, 3, 993–1022.
Borner, K., Chen, C., & Boyack, K. W. (2003). Visualizing knowledge domains. Annual Review of Information Science and Technology, 37(1), 179–255.
Chen, B., Tsutsui, S., Ding, Y., & Ma, F. (2017a). Understanding the topic evolution in a scientific domain: An exploratory study for the field of information retrieval. Journal of Informetrics, 11(4), 1175–1189.
Chen, J., Wei, W., Guo, C., Tang, L., & Sun, L. (2017b). Textual analysis and visualization of research trends in data mining for electronic health records. Health Policy and Technology, 6(4), 389–400.
Dam, H. K., & Ghose, A. (2016). Analyzing Topics and Trends in the PRIMA Literature. In International conference on principles and practice of multi-agent systems (pp. 216–229). Puckett: Springer International Publishing.
De Battisti, F., Ferrara, A., & Salini, S. (2015). A decade of research in statistics: a topic model approach. Scientometrics, 103(2), 413–433.
Dora, M., & Kumar, H. A. (2017). An empirical analysis of the research trends in the field of library and information science in India—2004–2015. COLLNET Journal of Scientometrics and Information Management, 11(2), 361–378.
Figuerola, C. G., Marco, F. J. G., & Pinto, M. (2017). Mapping the evolution of library and information science (1978–2014) using topic modeling on LISA. Scientometrics, 112(3), 1507–1535.
Hall, D., Jurafsky, D., & Manning, C. D. (2008). Studying the history of ideas using topic models. In Proceedings of the conference on empirical methods in natural language processing (pp. 363–371). Honolulu: Association for Computational Linguistics.
Hjørland, B. (2017). Theory development in the information sciences. Journal of the Association for Information Science & Technology, 68(7), 1796–1801.
Hou, J., Yang, X., & Chen, C. (2018). Emerging trends and new developments in information science: A document co-citation analysis (2009–2016). Scientometrics, 115(2), 869–892.
Jarvelin, K., & Vakkari, P. (1993). The evolution of library and information science 1965–1985: A content analysis of journal articles. Information Processing and Management, 29(1), 129–144.
Joo, S., Choi, I., & Choi, N. (2018). Topic analysis of the research domain in knowledge organization: A latent Dirichlet allocation approach. Knowledge Organization, 45(2), 170–183.
Kajberg, L. (1996). A citation analysis of LIS serial literature published in Denmark 1957–1986. Journal of Documentation, 52(1), 69–85.
Kawalec, A. (2013). Information science based on Spanish scientific publication 2000 to 2010. Malaysian Journal of Library & Information Science, 18(2), 1–13.
Kohl, D. F., & Davis, C. H. (1985). Ratings of journals by ARL library directors and deans of library and information science schools. College and Research Libraries, 46(1), 40–47.
Koufogiannakis, D., Slater, L., & Crumley, E. (2004). A content analysis of librarianship research. Journal of Information Science, 30(3), 227–239.
Kurata, K., Miyata, Y., Ishita, E. Yamamoto, M., Yang, F., & Iwase, A. (2018). Analyzing library and information science full-text articles using a topic modeling approach. In Proceedings of the association for information science and technology (pp. 847–848). Hoboken, NJ: Wiley.
Lamba, M., & Madhusudhan, M. (2019). Mapping of topics in DESIDOC Journal of Library and Information Technology, India: a Study. Scientometrics, 120(2), 477–505.
Liu, P., Jameel, S., Lam, W., Ma, B., & Meng, H. M. (2015) Topic modeling for conference analytics. In 16th annual conference of the international speech communication association (pp. 707–711). Dresden: INTERSPEECH.
Lu, K., & Wolfram, D. (2012). Measuring author research relatedness: A comparison of word-based, topic-based, and author cocitation approaches. Journal of the Association for Information Science and Technology, 63(10), 1973–1986.
Manzari, L. (2013). Library and information science journal prestige as assessed by library and information science faculty. The Library Quarterly, 83(1), 42–60.
Milojević, S., Sugimoto, C. R., Yan, E., & Ding, Y. (2011). The cognitive structure of library and information science: Analysis of article title words. Journal of the American Society for Information Science and Technology, 62(10), 1933–1953.
Miyata, Y., Habu, E., Sugiuchi, M., Koizumi, M., Kurata, K., & Ueda, S.(2010). Toshokan ohogaku kenkyu no trend: kaigai zasshi keisai ronbun no naiyo bunseki wo chushin toshite (The trend of library and information science research: A content analysis of research articles in LIS core journals). In Proceedings of Japan society of library and information science annual meeting, (pp. 141–144). Sapporo: Fuji Women’s University.
Miyata, Y., Yamamoto, M., Yang, F., Iwase, A., Ishita, E., Kurata, K., & Ueda, S. (2018). LDA wo mochiita toshokan johogaku no kenkyu topic no henka: 2 kikan no zasshi ronbun no zenbun wo taisho ni (Topic transition in library and information science research using LDA: A full-text analysis in two periods). In Proceedings of the 2018 the Mita society for library and information science (pp. 41–44). Tokyo: Mita Society for Library and Information Science.
Nicolaisen, J., & Frandsen, T. F. (2015). Bibliometric Evolution: Is the journal of the association for information science and technology transforming into a specialty Journal? Journal of the Association for Information Science and Technology, 66(5), 1082–1085.
Nisonger, T. E., & Davis, C. H. (2005). The perception of library and information science journals by LIS education deans and ARL library directors: A replication of the Kohl–Davis study. College & Research Libraries, 66(4), 341–377.
Nixon, J. M. (2014). Core journals in library and information science: Developing a methodology for ranking LIS journals. College & Research Libraries, 75(1), 66–90.
Pettigrew, K. E., & McKechnie, L. (2001). The use of theory in information science research. Journal of the American Society for Information Science and Technology, 52(1), 62–73.
Sugimoto, C. R., Li, D., Russell, T. G., Finlay, S. C., & Ding, Y. (2011). The shifting sands of disciplinary development: Analyzing North American Library and Information Science dissertations using latent Dirichlet allocation. Journal of the Association for Information Science and Technology, 62(1), 185–204.
Sugiuchi, M., Habu, E., Ueda, S., Kurata, K., Miyata, Y., & Koizumi, M. (2011). Ronbun kara mita nihon no toshokanjohogaku kenkyu no doko (The trend of library and information science research in Japan: A content analysis of research articles). Library and Information Science, 66, 127–151.
Syed, S., & Spruit, M. (2017). Full-text or abstract? Examining topic coherence scores using latent Dirichlet allocation. In 2017 IEEE international conference on data science and advanced analytics (DSAA). Tokyo: IEEE.
Tuomaala, O., Jarvelin, K., & Vakkari, P. (2014). Evolution of library and information science, 1965–2005: Content analysis of journal articles. Journal of the Association for Information Science and Technology, 65(7), 1446–1462.
Wang, X., & McCallum, A. (2006). Topics over time: A non-Markov continuous-time model of topical trends. In Proceedings of the 12th ACM SIGKDD international conference on Knowledge discovery and data mining (pp. 424–433). New York: ACM.
White, H. D., & Griffith, B. C. (1981). Author co-citation: A literature measure of intellectual structure. Journal of the American Society for Information Science, 32(3), 163–171.
Yan, E. (2014). Research dynamics: Measuring the continuity and popularity of research topics. Journal of Informetrics, 8(1), 98–110.
Yan, E. (2015). Research dynamics, impact, and dissemination: A topic-level analysis. Journal of the Association for Information Science and Technology, 66(11), 2357–2372.
Yang, S., Han, R., Wolfram, D., & Zhao, Y. (2016). Visualizing the intellectual structure of information science (2006–2015): Introducing author keyword coupling analysis. Journal of Informetrics, 10(1), 132–150.
Zhao, D., & Strotmann, A. (2008). Evolution of research activities and intellectual influences in information science 1996–2005: Introducing author bibliographic coupling analysis. Journal of the American Society for Information Science and Technology, 59(13), 2070–2086.
Acknowledgements
The authors thank Shuichi Ueda, professor emeritus at Keio University, for his support and invaluable advice. We also thank the editors and anonymous reviews for their meaningful comments.
Funding
This work was supported by JSPS KAKENHI Grant Number 19K12702 and 19H04423.
Author information
Authors and Affiliations
Corresponding author
Ethics declarations
Conflict of interest
The authors declare that they have no conflict of interest.
Rights and permissions
Open Access This article is licensed under a Creative Commons Attribution 4.0 International License, which permits use, sharing, adaptation, distribution and reproduction in any medium or format, as long as you give appropriate credit to the original author(s) and the source, provide a link to the Creative Commons licence, and indicate if changes were made. The images or other third party material in this article are included in the article's Creative Commons licence, unless indicated otherwise in a credit line to the material. If material is not included in the article's Creative Commons licence and your intended use is not permitted by statutory regulation or exceeds the permitted use, you will need to obtain permission directly from the copyright holder. To view a copy of this licence, visit http://creativecommons.org/licenses/by/4.0/.
About this article

Cite this article
Miyata, Y., Ishita, E., Yang, F. et al. Knowledge structure transition in library and information science: topic modeling and visualization. Scientometrics 125, 665–687 (2020). https://doi.org/10.1007/s11192-020-03657-5
Received:
Published:
Issue Date:
DOI: https://doi.org/10.1007/s11192-020-03657-5