
Abstract
I examine developments in the application of performance-based regulation (PBR) to electricity distribution and transmission in the United States. Applications of comprehensive PBR to electricity distribution had been slow to diffuse in the U.S. prior to roughly 2000. PBR mechanisms are now being applied more frequently to electricity distribution, which reflects the changing structure of the electric power industry and the increasing obligations that are being placed on electric distribution companies. The new obligations are a consequence primarily of aggressive targets for decarbonizing the electricity sector in nearly half the states and the goal of using “clean” electricity to electrify transportation, buildings, and other sectors. PBR should be viewed as a set of “building blocks” that can be adopted in various combinations and should recognize that PBR and traditional cost-of-service regulation (COSR) are properly viewed as complements rather than substitutes. Recent reforms in the regulation of distribution companies in Great Britain—“RIIO”—have been influential in the U.S. The main reforms contained in RIIO are discussed. There has been essentially no application of PBR by the Federal Energy Regulatory Commission (FERC) to owners of transmission assets or to independent transmission operators. FERC has applied targeted incentives to encourage investment in transmission facilities and membership in independent system operator organizations. However, the regulation of transmission rates relies primarily on COSR in the form of formula rates and has poor incentive properties. Regulation of independent system operators is a challenge because they are non-profit organizations with no equity to put at risk. Reforms here are suggested.
“All Regulation is Incentive Regulation”.Footnote 1
“…it would be simpleminded to make a strong distinction between [cost of service] regulations and [incentive] regulations… the contrast between the two modes is mostly one of emphasis.”Footnote 2
“There is a fundamental evolution taking place in the way electricity is being produced and consumed in Massachusetts. This evolution has been driven, in large part, by a number of legislative and administration policy initiatives to address climate change and to foster a clean energy economy…”.Footnote 3
1 Introduction
There is by now an extensive and mature theoretical literature on incentive regulation of legal monopolies (e.g., Armstrong & Sappington, 2004, 2007; Sappington, 2005; Laffont & Tirole, 1993). At least some of the teachings of this literature—especially simple price-cap or indexed price regulation (Laffont & Tirole, 1993, p. 17)—have guided reforms to traditional cost-of-service regulatory (COSR) practices in several U.S. industries; regulated telephone service at both the federal and state levels is the most widely cited (Lowry and Kaufman, 2002, pp. 408–409; Sappington et al., 2001; Sappington & Weisman, 2010) (see their Table 1).
Incentive regulation mechanisms have been applied for many years to the regulation of electric utilities in countries other than the U.S., including Great Britain, Chile, Argentina, Japan, New Zealand, Australia, and Canada. In an earlier paper (Joskow, 2014, p. 310),Footnote 4 I concluded “Formal comprehensive incentive regulation mechanisms have been slow to spread in the U.S. electric power industry [reference omitted], though rate freezes, rate case moratoria, and other alternative regulatory mechanisms have been adopted in many states, sometimes informally, since the mid-1990s.”
The early applications of incentive regulation principles in the electric power sector tended to be very partial (e.g., focused on the performance of generating plants, Joskow & Schmalensee, 1986, p. 39), quasi-automatic adjustment mechanisms in response to high rates of inflation in the 1970s and early 1980s, or were temporary de facto price cap mechanisms (e.g. short-term rate freezes) that emerged as settlementsFootnote 5 of rate cases—often in connection with vertical and horizontal restructuring, stranded cost recovery, and mergers, especially in the late 1990s and early 2000s as industry restructuring occurred. Administrative convenience rather than clearly articulated performance goals drove many of these experiments.
More recently—especially since around 2015—the situation with regard to the applications of incentive regulation mechanisms to electric distribution companies in the U.S. has changed considerably: Incentive regulation mechanisms of some type have now been introduced into the electricity distribution regulatory process in a majority of U.S. states. Comprehensive incentive regulation mechanisms have been or are now being introduced or evaluated in about a dozen states.
There are a few things that are worth noting about this recent trend: First, these initiatives are never called “incentive regulation” by regulators and policy makers in the U.S. The policy phrases used routinely now are “performance-based regulation” (PBR) or “alternative regulatory mechanisms (ARM).” I will use the term PBR in the rest of this article. I have been told by a few regulators that the term “incentive regulation” sounds like a potential giveaway to utilities, while “performance-based regulation” sounds like the focus is on holding the utilities’ feet to the fire. Perhaps this should remind us that language matters to successfully apply theoretical results to public policy; but the advances in PBR regulation of electric distribution utilities in the U.S. reflects more than just politically appealing language.
Second, I am sorry to conclude that the extensive theoretical literature and the details of optimal regulatory mechanism design in different contexts that has emerged from that literature has left very few clearly visible footprints in the policy discussion and in the design of PBR mechanisms in practice in the U.S. I have reviewed perhaps 100 regulatory reports, regulatory commission orders, advisory and consulting firm educational materials that have been provided to policymakers, and media discussions of PBR regulation in the course of preparing this article. Discussions of important concepts—such as imperfect and asymmetric information, adverse selection, managerial effort and moral hazard, rent extraction/efficiency tradeoffs, and the use of incentive-compatible menus—are rarely if ever mentioned. Advisory and consulting firm reports, presentations, and general guidance—which involves organizations such as the Regulatory Assistance Project (RAP), Rocky Mountain Institute (RMI), and U.S. national labs, especially the National Renewable Energy Laboratory (NREL) and the Lawrence Berkeley National Laboratory (LBNL or LBL)—have played a primary role in educating policy makers and promoting PBR.
These reports have few citations to the key papers and books in the academic literature. The reports rely on fairly simple incentive and disincentive concepts that are applied in practical ways to the nuts and bolts of the regulation of (primarily) electricity distribution utilities. They also draw on the experiences in other countries and in various U.S. states—especially the recent regulatory reforms in Great Britain—as those experiences related to the regulation of electric distribution companies.
Nevertheless, several of the more comprehensive mechanisms that have been introduced to regulate electricity distribution in the U.S. have features that can be readily found in the theoretical incentive regulation literature even if the relationships between the theory and applications are not specified clearly.
Simple price-cap mechanisms alone (Laffont & Tirole, 1993, p. 17) are never used in practice as the core PBR structure for regulating electricity distribution utilities in the U.S. Nor indeed was a simple price-cap mechanism alone used to regulate distribution companies in Great Britain during the first decade of the twenty-first century (Joskow, 2014, pp. 309–326). Automatic inflation and productivity adjustments are often included as a component of more comprehensive PBR mechanisms; but the length of time between formal regulatory reviews is typically three-to-five years, so ratchets that rely on COSR to reset prices play a significant role, along with sets of specific performance metrics and incentives, profit sharing mechanisms, reopeners, revenue decoupling, limited cost pass-throughs for extraordinary costs, and other more targeted incentive mechanisms.
The goals of mitigating the regulated monopoly’s market power, stimulating cost efficiencies, and encouraging innovation—while meeting economic and legal constraints that require regulatory mechanisms to allow regulated firms to cover their “reasonable” costsFootnote 6—continue to guide the evolution of PBR mechanisms for electric distribution utilities in the U.S. There is also considerable respect for the limited information that regulatory agencies have at their disposal, the limited resources that the typical state regulator can draw upon, uncertainties about future cost opportunities, uncertainties about future electricity demand and distribution utilities services, and uncertainties about the expectations that will be placed on distribution utilities in the future.
Overall, PBR applied to electricity distribution in the U.S. is best viewed as a complement to COSR regulation—not a complete substitute—as Laffont and Tirole (1993) recognize. The post-RPI-X regulatory mechanisms that have been adopted in Great Britain for major distribution companies that are subject to the jurisdiction of the regulator (OFGEM) in Great Britain, called RIIO-1 (ED1) and now RIIO-2 (ED2),Footnote 7 which were developed through its “RPI-X@20” review process from 2008 to 2010,Footnote 8 have been especially influential for regulatory reforms of electricity distribution recently in the U.S.
Third, as I will discuss below, the use of standard theoretical and empirical PBR concepts in the regulation of electricity distribution has not extended to the regulation of transmission owners and independent system operators in the US. The state of PBR that is applied to transmission companies and the system operator are far more advanced in Great Britain—both during the “RPI-X” period (Joskow, 2014, pp. 326–332), and under the more recent RIIO reforms. This is despite—or perhaps because of—the dramatic shift of regulatory responsibility for transmission rates and services from state regulators to the Federal Energy Regulatory Commission (FERC) since the late 1990s, especially where vertically integrated utilities have unbundled transmission service from distribution and generation.
Moreover, non-profit independent system operators (single state ISOs or multi-state RTOs)Footnote 9 now manage the operation of both organized competitive wholesale markets for electricity in conjunction with the management of the operation of the transmission networks that serve about 2/3 of the retail customers in the U.S. They also have responsibility for transmission planning in their regions and, in principle, across ISO/RTO boundaries.
While FERC has introduced a set of targeted incentives to encourage more investment in transmission networks, transmission service price regulation still relies primarily on traditional COSR in a form that is antithetical to the goals of PBR. The experience in Great Britain with PBR regulation of transmission companies and the system operator under the RPI-X regime and its replacement by the RIIO framework to transmission owners and the system operator has had little if any influence on the regulation of transmission and system operators in the U.S.
I have previously discussed the application of the so-called RPI-X framework to transmission owners and the system operators in Great Britain (Joskow, 2014). In light of the lack of influence of both RPI-X and RIIO on transmission and system operations in the U.S., I will not discuss the RPI-X regime further here. Nor will I discuss the RIIO framework that is applied to transmission owners and the system operator in Great Britain further here, aside from a few references in the context of the regulatory and organization framework for transmission and system operations in the U.S.
Finally, the quotations at the beginning of the article reflect the realities of regulation of electric distribution and transmission in practice in the U.S. Of course, all regulatory mechanisms provide incentives that affect the behavior of the firms that are subject to these regulatory mechanisms. The incentives and associated behavior may be consistent with advancing the regulator’s objective function or inconsistent with it.
However, in the context of this article, this observation has important implications. There has been a tendency in the incentive regulation literature to characterize regulatory mechanisms as either/or choices: Regulated firms either are or are not subject to COSR or PBR.
This is a false dichotomy: COSR in practice has always varied considerably from pure textbook COSR—except perhaps for some formula rate mechanisms which I will discuss further below. Moreover, introducing PBR is not an either/or decision. There are many possible components of PBR mechanisms that can and have been introduced over time. This is why we see responses to the question “how many states have adopted PBR regulation?” vary widely. One report observed that 39 states had at least some form of PBR mechanism (PEPCO, 2020). On the other hand, there are only a handful of states that have implemented comprehensive PBR mechanisms similar to those in Great Britain and a few more that are in the process of doing so.
In the end, one needs to examine the incentive properties of the package of PBR mechanisms that have been introduced—typically in parallel with fairly frequent recalibration that uses COSR—as a touchstone for price and nonprice performance results, the derivation of new starting prices (the ratchet), and changes in the design of the PBR mechanisms.
Finally, the nature of the obligations that are being placed on electricity distribution and transmission companies in the U.S. has changed considerably: This reflects decarbonization policies, competition policies, and changes in the technologies that are used in all segments of the electric power sector. This has increased the administrative burdens on state regulatory agencies, which as I will show below, typically have very limited resources compared to OFGEM in Great Britain. The expectation that PBR mechanisms can reduce this burden—whether this is a reasonable assumption or not—has increased the state regulators’ interest in PBR mechanisms.
This article proceeds as follows: The next section provides a brief description of the U.S. electric power sector and how it has evolved over the last 30 years. Section 3 focuses on the changing obligations that are being placed on electric distribution companies in the U.S. Section 4 discusses the building blocks of the PBR mechanisms that are being applied to electric distribution companies in the U.S. Section 5 discusses recent reforms in the regulation of distribution utilities in Great Britain following a major review of the existing regulatory arrangements: the “RPI-X@20” review. The new package of regulatory arrangements that were adopted and subsequently revised is called RIIO (Revenue = Incentives + Innovation + Output). I discuss these developments in regulatory practice in Great Britain here since RIIO has influenced the speed and direction of PBR as applied to distribution utilities in the U.S. The changes in both countries reflect similar changes in the responsibilities now given to distribution utilities—especially as they relate to decarbonization of the electricity sector. The final substantive section discusses the contemporary regulatory framework for transmission owners and transmission system operating organizations in the U.S. A brief section of conclusions completes the article.
The primary conclusions are as follows: PBR mechanisms that have many similarities to recent RIIO reforms in Great Britain are expanding—but slowly—in the U.S. However, it is important to view PBR as applied to the distribution of electricity as being composed of a set of “building blocks” that can be combined to create a comprehensive PBR plan. These building blocks are often adopted sequentially as regulators become more comfortable with PBR mechanisms.
The expansion of PBR has been gradual for a number of reasons, including: the limited staff and budgetary resources that are available to state regulators; and misunderstandings by U.S. policymakers as to how the RPI-X mechanism that applied to electricity distribution and transmission—as opposed to application of simple price-cap mechanisms to certain telecom services—evolved over time in Great Britain to be much more than a simple price-cap mechanism.
Finally, largely due to the decentralized and heterogenous structure of the ownership of transmission companies and the reliance on non-profit system operators, there has been little effort to apply PBR mechanisms to the operating costs, investments costs, planning, or other performance criteria for either transmission or system operations in the U.S. This is quite different from the experience in Great Britain, where PBR—including the more recent RIIO framework—has been applied to transmission owners and the system operator for almost 25 years. The Federal Energy Regulatory Commission (FERC) has used a set of targeted incentives to stimulate investment in new transmission facilities, to create separate transmission companies, and to join ISO/RTOs. These initiatives to expand competitive opportunities for the development of new transmission facilities may be a partial substitute for PBR for transmission owners—but progress here has been slow.
2 The U.S. Electric Power Sector in Brief
The U.S. has a diverse electric power sector composed of investor-owned utilities (IOU), municipal and state-owned utilities, cooperative utilities, and federal power generation and marketing agencies.
Historically, circa 1985, IOUs accounted for about 75% of the end-use customers served and a similar fraction of electricity generated. Utilities varied (and continue to vary) widely in size. Almost all IOUs were vertically integrated into generation (G), transmission (T), and distribution (D) (including bundled retail supply of energy); these are the primary structural components of electricity supply (Joskow & Schmalensee, 1983, Chapter 2). Most IOUs operated their own transmission networks as control area operators while others, primarily in the Northeast, joined centrally dispatched power pools like PJM (Mid-Atlantic region) or NEPOOL (New England).
Most municipal and cooperative utilities only distributed electricity; they purchased generation services from proximate IOUs, federal and state power suppliers (e.g., TVA, Bonneville, New York Power Authority), and cooperative G&T organizations. Some large municipal and state-sponsored utilities were and still are vertically integrated (e.g., Los Angeles Department of Water and Power or LADWP); some had generation and transmission but did not and still do not distribute electricity to end-use consumers (e.g., Brazos Coop); and many were and are just distributors.
I will focus on IOUs in this article.
IOUs that distribute electricity to end-use customers were and are regulated primarily by state regulatory commissions. There are 49 state regulatory commissions and a regulatory commission that covers the District of Columbia.Footnote 10 FERC played a much less significant role historically than is the case today: It regulated wholesale power supply agreements between IOUs and between IOUs and other types of utilities, including the terms and conditions of power pooling arrangements such as PJM, NEPOOL, etc., and the terms of any underlying transmission contracts to support these power trading arrangements. As a consequence of vertical integration and the then existing FERC regulations that governed transmission access and pricing, the vast bulk of transmission costs were regulated by state public utility commissions and included in the IOU’s retail cost of service.
There were many complaints about access to transmission services and the terms and conditions of transmission contracts by municipal and cooperative distribution utilities prior to 1996. This was the case since vertically integrated IOUs did not then have obligations to offer transmission service; and when they did, they relied on negotiated contracts rather than posting generally available tariffs that specified the terms and conditions of transmission service. Nor did they have an obligation to expand transmission capacity to accommodate requests for transmission service. Antitrust complaints with regard to transmission access and pricing were frequently used by municipal and cooperative distribution companies to obtain access to IOU transmission networks in order to buy power from other suppliers.
Any net revenues from wholesale sales and purchases of power and of transmission service were credited back against the state-regulated cost of service (Joskow, 2005). State regulatory agencies were also responsible for oversight of system planning for the future. For a detailed discussion of the structure and regulation of the industry circa the early 1980s, see Joskow and Schmalensee (1983).
The structure of the IOU sector and the division of regulatory responsibility between state and federal regulators began to change in the 1980s: slowly at first and then more rapidly. The changes involved support for the development of an independent power generation sector, starting with the Public Utility Policy Act of 1978 (PURPA). PURPA stimulated development of non-utility independent cogeneration and small power projects that satisfied PURPA’s technology and size restrictions during the 1980s. The Energy Policy Act of 1992 created a broader class of independent power producers (Exempt Wholesale Generators—EWG—that are now referred to collectively as Independent Power Producers (IPP)) that are subject to FERC oversight.
FERC in turn promoted competitive wholesale markets where both regulated utility generators and IPPs could trade electricity that they generated to meet demand more efficiently. FERC allowed independent power producers to be exempt from formal rate regulation if they could demonstrate that they did not have market power in the wholesale market. A few states began to require vertically integrated utilities to seek competitive bids for additional power supplies rather than just assuming that they would build their own new power plants. Thus, vertical integration began to unravel slowly as an independent power sector grew. However, transmission access and pricing continued to be a barrier to more rapid expansion of competitive regional wholesale power markets.
In 1996, FERC (2023a) began to require all jurisdictional utilities to file and implement open access non-discriminatory transmission tariffs and related system information so as to make their transmission systems available to all generators, intermediaries, and their wholesale customers at cost-based rates (FERC Orders 888, 889, 890).Footnote 11 Strong encouragement followed for the creation of independent non-profit system operators (ISOs or RTOs) (FERC Order 2000/2000A) and the development of organized wholesale spot markets for energy, ancillary services, and in most cases capacity, managed by the ISO/RTOs.Footnote 12
ISO/RTOs cover regions that represent about 2/3 of U.S. electricity consumers. In these regions they are responsible for: managing organized wholesale markets for energy, capacity, ancillary services, congestion revenue rights, transmission system operations (including congestion management and operating reliability), interconnections for new generators and merchant transmission projects, transmission system planning, and transmission cost allocation; managing the ISO’s open access transmission tariff (OATT); developing the annual transmission revenue requirement for each transmission owner (TO), which is submitted by the transmission owner to FERC to support its transmission service prices; and developing the associated transmission rates for transmission services that are available in the OATT.
ISO/RTOs are independent non-profit organizations with members that represent all components of electricity supply and demand. ISO/RTOs are regulated by FERC.Footnote 13 They do not own any transmission assets aside from the facilities, equipment, and software that are required to perform their system operator functions. Figure 1 provides a map of the U.S. (and Canada)Footnote 14 that shows the regions in which utilities have joined ISO/RTOs and regions where they have not. The map provides the name, location, and acronym for each of the ISO/RTOs in the U.S. I will use the acronyms for the ISO/RTOs when I refer them in the discussion below. The Southeast and the West (aside from California) are the primary areas where utilities have not joined ISOs, though discussions have advanced considerably regarding the creation of a Western RTO.Footnote 15

ISO/RTO regions in U.S. and Canada Source: ISO/RTO Council. http://isortotest.org/wp-content/uploads/2018/05/ISO-RTO-Map-2018.jpg
These federal actions were complements to restructuring initiatives at the state level. Starting with California, a number of states initiated restructuring programs that separated the ownership of generation (potentially competitive) from transmission and distribution (which would continue to be regulated as both legal and natural monopolies).Footnote 16 Most of these states have also implemented retail supply competition and associated unbundling requirements that require the incumbent utilities’ distribution and transmission platforms, under traditional regulatory arrangements, to pass along to retail customers the costs of the service that is supplied on these platforms.
Independent power producers account for almost 45% of the electricity that is generated in the U.S. today, while the traditional (now partially vertically integrated) utilities (IOU, Muni, Coop, Federal) now account for 53% of generation—compared to nearly 100% in 1980—and the rest is customer-based generation. Customer-based generation—primarily rooftop photovoltaic (PV)—has also expanded rapidly in the last ten years. Moreover, for utilities that became members of ISO/RTOs, the regulation of transmission rates was effectively shifted fully from the states to FERC.
Accordingly, the U.S. electric power sector has become even more diverse than it was in 1985. There are about 135 “major” IOUs that distribute electricity in the U.S.Footnote 17; some are fully unbundled from generation and retail supply, and many are partially vertically integrated. Only about 12 states have adopted full unbundling and retail supply competition. IOU distribution utilities covering about 2/3 of U.S. electricity customers are members of independent transmission organizations (ISOs or RTOs). Many of these IOU distribution utilities are under joint ownership by a holding company; this has especially been the case since the repeal of the Public Utility Holding Company Act (PUHCA) in 2005, which ended most of the restrictions on the formation of public utility holding companies and transferred some regulatory authority from the Securities and Exchange Commission to FERC and the U.S. Department of Justice.Footnote 18 A map of the service areas for the members of the Edison Electric Institute (EEI), which is the trade association for IOUs, can be found on EEI’s web site.Footnote 19
About 22 states and the District of Columbia have adopted aggressive decarbonization targets for their electricity sectorsFootnote 20; these targets call for the expansions of investment in wind, solar PV generation, and other carbon-free electricity generation technologies, as well as storage, which has been primarily developed by independent power producers. Recently, there has been a renewed interest in nuclear power (existing and new), and carbon capture and storage technologies.Footnote 21
The general decarbonization “model” that these states are following is to decarbonize their electricity sectors deeply and then to use “clean” electricity to support the electrification of transportation (electric vehicles: EV) and the electrification of space and water heating in buildings, which will thereby displace fossil fuels, and the electrification of some other sectors. In most cases, the distribution utilities are expected to play an intermediary role: They purchase power from independent suppliers so as to meet state-specified renewable portfolio or clean energy standards for the demand that they continue to serve; they implement rates that are designed to promote and integrate (and often subsidize) distributed energy resources (DER) such as rooftop and community solar PV; they facilitate the expansion of EV charging infrastructure; they manage customer energy efficiency and demand response programs; and they expand and modernize their network infrastructure, so as to accommodate what is anticipated to be a large increase in electricity demand that will result from the electrification of major end-use sectors.
3 The Changing Structure and Obligations of Electric Distribution Companies in the U.S.
Why have U.S. regulators become much more interested in PBR mechanisms for electric distribution utilities in the last five-to-ten years? In a nutshell, the role of electric distribution companies has changed considerably in the last two decades—but especially in the last five-to-ten years. The changes have increased the dimensions of the objective function that regulators seek to optimize, and accordingly the regulators have placed additional obligations on regulated distribution utilities—and in the process further complicated the task of regulating them.
There are several drivers of these changes: First, in states that restructured their vertically integrated utilities, electricity distribution became the primary target of state regulatory responsibility.
Second, it took perhaps a decade for state commissions to manage and adapt to the changes that were brought about by restructuring. More than a dozen states adopted retail energy supply competition and/or municipal aggregation options.Footnote 22 The changes required significant attention by state regulators in order to put the supporting institutions in place and to respond to “teething problems” that emerged. State commissions also participated in the transition to ISO/RTOs and competitive wholesale markets in general to play a role in defining and adjusting to FERC’s rules for organized wholesale markets, transmission pricing, transmission investment, and transmission planning.
Third, electricity distribution companies in the U.S. have been given a dramatically expanded set of responsibilities compared to their traditional obligations to deliver commodity electricity to customers economically, safely, and reliably—the traditional focus of COSR and associated service-quality standards. Many of these new commitments reflect the central role that the electricity sector is expected to play in meeting state and federal decarbonization commitments and goals. These include: energy procurement from independent power producers of carbon-free energy (wind and solar); integration of rooftop and community PV and other DER; distribution-level storage; investing in a “smart grid” with enhanced communications, control, and metering capabilities; supporting the development and integration EV charging stations; designing and implementing customer energy efficiency programs; and other obligations that have been motivated by decarbonization policies and the technological changes that are accompanying them.
Importantly from an incentives perspective, many of the costs that are being incurred by distribution utilities to meet both traditional energy delivery responsibilities and these new obligations were traditionally treated as automatic pass-throughs into regulated retail rates with no margin and no profit opportunity for the distribution utility. As these costs are automatic pass-throughs (rather than rate-based capital expenditures upon which the utility can earn a return or subject to the incentive properties of regulatory lag—more on this below) and have become a growing fraction of the regulated distribution charges, the weak incentive properties of COSR—especially the biases toward owning capital facilities rather than buying comparable services from third parties—became more obvious to regulators.
As a result, regulators have become more interested in PBR mechanisms that can provide financial incentives to make pursuing these obligations efficiently “interesting” to distribution utilities from a profit opportunity perspective and not just another regulatory mandate that is difficult for regulators to oversee.
As a consequence of concerns about the biases in resource allocation choices that are associated with COSR regulation, there is also growing interest in requiring distribution utilities to: identify distribution services that were traditionally provided by the distribution utility itself and included in COSR protocols but could in principle be opened to competitive suppliers; implement competitive processes so as to evaluate and procure such services from competitors; and require the distribution company to “host” these services. If distribution utilities provide hosting services, there will be lost profit opportunities and no compensating financial benefit unless a new regulatory mechanism is added to stimulate efficient competitive procurement processes and hosting.
The standard prescription that the primary goal of good regulation of natural monopolies should be to replicate as closely as possible the prices, costs, and service-quality attributes that would be realized in a hypothetical competitive market has therefore become more complicated. This prescription implied cost minimization, efficient (second-best) prices, budget balance, and monopoly rent extraction, and service quality that balanced the cost and benefits of network outages and of improvements in customer service. The objective function for distribution companies and their regulators has become more complex, and regulators are understanding that regulatory reforms are needed to match these new responsibilities with standards and associated incentive arrangements.
Moreover, it would be unlikely that some of the new responsibilities and associated services that have been imposed on distribution utilities would even be provided by firms in a hypothetical competitive market: How many firms would pay consumers not to use their products or subsidize competing suppliers? It is worth noting that several of these new responsibilities appear to be examples of “taxation by regulation” (Posner, 1971)—in the sense that the costs that are associated with meeting these new responsibilities are passed through to electricity customers in non-bypassable and non-transparent distribution delivery charges while they could instead be funded through state and federal taxation.
Finally, regulators and utilities expect that electricity demand—and the associated need for network investments to support it reliably—will begin to increase rapidly as a consequence of the electrification of transportation, buildings, and other sectors. Higher rates of inflation and higher interest rates have in the past and are expected in the future also to drive a growing number of formal rate cases with reliance on COSR. (Variations in the number of rate cases and regulatory lag are discussed further below.)
Absent changes in regulatory procedures, these changes should be expected to drive the need for more annual formal rate cases under traditional COSR so as to adjust rates to reflect a growing rate base from the growth in network investments and to reflect rising operating costs, and to monitor several additional performance metrics. In the absence of some kind of multi-year regulatory pricing mechanisms and compatible performance standards and incentives, this would further increase the administrative burden for state regulators.Footnote 23
Accordingly, state commissions and state legislatures have been more interested in examining and implementing alternative regulatory mechanisms that are better matched to these changes in policy-driven obligations, can rely more on incentives rather than mandates, and operate more “automatically” without creating the poor efficiency incentives that are associated with more frequent reliance on formal COSR review to reset rates, monitor service quality, and oversee utility performance in pursuing state and federal policy goals.
In this regard, contributing to the slow introduction of PBR mechanisms is likely to be the limited human and financial resources that state regulatory agencies have available to regulate electric and gas utilities.Footnote 24 Nor does the typical state regulatory commission have budgetary resources to hire many costly outside consultants. Table 1 displays the latest number of employees for OFGEM, the electricity and gas regulator in Great Britain,Footnote 25 and several U.S. state regulatory commissions that are responsible for electric distribution regulation, as well as for gas distribution regulation, and other state-regulated sectors such as water, transportation, telecom, insurance, and energy-facility siting, depending on the state.
Aside from California and New York, most state commissions that are responsible for regulation of electric distribution companies and that would be responsible for guiding PBR design and implementation, have very modest staff resources. Moreover, they typically have regulatory responsibilities outside of electricity and gas distribution. For example, the California commission (CPUC) has regulatory responsibility for electric distribution and (some) generation, natural gas distribution and intrastate gas pipelines, water, intra-state rail safety, and some aspects of communications. On the other hand, FERC—unlike OFGEM—has no jurisdiction over electric or gas distribution utilities, or the non-energy sectors that fall under many state regulatory agency responsibilities.Footnote 26
4 Building Blocks of PBR Mechanisms for Electricity Distribution Companies in the U.S.
4.1 PBR and COSR in Practice
In the academic literature, there has been a tendency to characterize the introduction of PBR mechanisms as an either/or decision and to view the alternative as textbook COSR regulation. This view is at best naïve and at worst uninformed. If we apply the statements that are attributed to Kahn and to Laffont and Tirole in the heading of this article, all utilities in the U.S. are subject to some kind of incentive regulation. Indeed, a recent filing (which relied on testimony from the Edison Electric Institute) before the Maryland Public Utilities Commission argues that 39 states are subject to some form [emphasis added] of PBR regulation.Footnote 27 Yet, I have been able to identify only about a dozen states that operate under or are planning to implement comprehensive (as defined below) PBR plans that reflect similar mechanisms to those that have been adopted by RIIO for distribution in Great Britain.
The resistance to PBR plans among U.S. regulators also in part reflects a misunderstanding of what PBR implies in general and what “RPI-X” as applied in practice to electricity distribution and transmission utilities in Great Britain at the beginning of the twenty-first century actually means. The use of the phrase “RPI-X” has been interpreted incorrectly as referring to the simple price cap mechanisms that have largely replaced COSR regulation in the telecommunications sector in the U.S., Great Britain, and many other countries since the mid-1980s.
As I have discussed previously (Joskow, 2014), RPI-X regulation of distribution and transmission in Great Britain is a short-hand phrase for what ultimately became a much more complex set of incentive mechanisms than was often portrayed by U.S. regulators who were already familiar with the use of simple price caps for certain telecommunications services. The regulators viewed the telecommunications and electricity distribution situations as being quite different: Price caps in telecommunications were transitional regulatory mechanisms that would fade away as competition replaced the need for regulation. But the regulators did not believe that the regulation of electricity distribution was going away anytime soon.
The recent changes in the regulatory framework made after the RPI-X@20 review in Great Britain have created even further distance from a simple price-cap mechanism applied to electricity distribution. I will discuss some of these changes that have been unleashed by RIIO in Great Britain in Sect. 5 below.
Furthermore, COSR regulation continues to play an important role in PBR plans that rely, in part, on external price and productivity indices and benchmarks to adjust revenues and prices over time. COSR regulation is used to establish the starting set of prices or revenues at the beginning of the typical term of such a PBR mechanism and then is used again to reset (ratchet) prices when the next term of the PBR begins. In this sense, PBR and COSR are complements—not substitutes—as the quotation from Laffont and Tirole (1993) at the beginning of this article points out.
If we examine the earliest papers of which I am aware that propose the use of a simple RPI-X price cap mechanism (Baumol, 1982; Littlechild, 1983), there is actually no detailed discussion of how either the initial prices are set or how they would be reset after a period of time if regulation continued to be justified to mitigate monopoly power problems. Both papers focus on the application of a simple price-cap mechanism to adjust the incumbents’ prices—AT&T and its local exchange affiliates in the U.S., and British Telecom (BT) in Great Britain)—over time. I think that it would be reasonable to assume that both papers have in mind using the existing pre-price-cap prices as the starting prices and do not need to discuss how those prices were determined. Both papers also recognize that some type of regulatory review and adjustment to the price-cap mechanism would be necessary—though there are no details that are presented as to how the resets would be accomplished.
Baumol (1982, p. 17) recognizes and indeed supports COSR regulatory reviews from time-to-time that could reset prices and the parameters of any subsequent price-cap mechanism. “No commission should or can be expected, after adopting such a rule, to leave the task of rate adjustment entirely to the formula forever thereafter. Rather, an essential part of the program …is a process of monitoring of the performance of the formula by the regulatory agency, which should be expected to subject it to a formal review process from time to time. A general rate case would, for example, constitute an appropriate occasion for such a review.”
Similarly, Littlechild (1983, p. 35) suggests that an automatic referral to the Monopolies and Mergers Commission (MMC) after, say, five years (from the initial introduction of the price-cap mechanism) would be appropriate. “By that time, the extent and strength of competition should become more apparent, and it may be appropriate to extend or restrict the scope of the [regulated] ‘monopoly basket’; to change the value of X or to rebase the calculation; to abolish the tariff reduction scheme altogether or to impose additional constraints.”
Littlechild (1983) also recognizes that a simple price-cap mechanism could create incentives to reduce service quality but argues that identifying all of the relevant quality attributes would be too difficult. He suggests instead that a general clause that commits BT to maintain quality be added to its license. As we shall see service quality and other performance mechanisms, as well as license conditions, are now important components of PBR in the U.S. and in Great Britain.
It is interesting that two scholars came up with essentially the same adjustment mechanism for the same industry at almost the same time but for different reasons. Both the context and emphasis on continuing regulation are quite different in the two papers: Baumol’s proposal is motivated by the effects of more rapid inflation combined with regulatory lag on the earnings of the regulated telecommunications companies as well as the administrative burden of more frequent rate cases in response to more rapid inflation during the 1970s. The price-cap mechanism is seen as a way to adjust prices automatically between formal rate cases and make it possible to reduce the number of formal rate cases while reducing the earnings erosion that was adversely affecting the regulated firms’ earnings. The word “competition” does not appear in his paper.
Littlechild’s proposal is part of a very thoughtful analysis of alternative regulatory mechanisms that had been proposed at that time as the initial regulatory mechanisms to accompany the privatization of British Telephone (BT). Littlechild’s report places a great deal of emphasis on the potential role of expanding competition for BT’s services over time. If we “read between the lines”, it appears that he anticipated that competition could grow significantly as long as BT could not engage in practices to stamp it out. Over time, competition would make it possible to substantially reduce the scope of regulation to mitigate monopoly power.Footnote 28 He was quite prescient in this regard: Competition did grow in both the U.S. and Great Britain; COSR regulation has faded away over time; and competition now governs most telecommunications services (Sappington & Weisman, 2010).
However, as we noted above, regulation of electricity distribution and transmission companies is not expected to fade away anytime soon. Indeed, as I have discussed, the scope of regulation of electricity distribution has expanded as distribution utilities’ obligations have expanded. For electricity distribution any acceptable dynamic price adjustment mechanism that is based on external indices will have ratchets where prices are reset every three-to-five years (or so) with the use of a very detailed set of fairly standard COSR formulas.
For example, if we examine the 550-page regulatory order that was issued by the Massachusetts Department of Public Utility in 2022 (MDPU, 2022) to revise a comprehensive PBR plan for NSTAR (the electricity distribution and transmission company that serves Boston and surrounding communities), a little over 100 pages focuses on the PBR plan and 450 pages is devoted to the application of traditional COSR regulation principles to establish the starting revenue cap (revenue requirement) in the PBR plan and then the associated rates for each class of customers. The earlier NSTAR order with a PBR plan that was issued in 2017 (MDPU, 2019a) was 786 pages—of which over 600 pages was devoted to applying COSR regulatory principles to set the starting values for revenues and prices. So too in Great Britain under RPI-X (Joskow, 2014) and under RIIO (OFGEM, 2017).
In this regard, let me note that in a world where the regulator is uncertain about the utility’s costs, whether it is a low-cost or high-cost type (adverse selection) and uncertain about managerial effort (moral hazard), and where there is a rent-extraction goal and budget-balance constraint, a simple price cap mechanism is highly unlikely to be optimal—except perhaps in the case where it is merely a transition mechanism on the path to deregulation and competition. Indeed, menus of contracts, profit-sharing or sliding-scale arrangements (Lyon, 1996), and ratchets are likely to provide a better balance between performance incentives and rent extraction goals (e.g., Laffont & Tirole, 1993; Schmalensee, 1989). If simple price caps alone were optimal, Laffont and Tirole would have written a much shorter book.
Finally, Baumol’s proposal was motivated by regulatory lag: a real regulatory phenomenon that has received inadequate attention in my view in the incentive regulation literature’s characterization of COSR. Prior to the introduction of formal incentive regulation plans, which defined how rates would adjust over time between rate cases, there were sometimes long periods of time when the prevailing rates of the regulated firm were not “tested” in a rate case.
Instead, “regulatory lag” has been the norm during many time periods. This means that after prices are set in a rate case, several years may pass until the next regulatory review takes place that resets prices. Kahn (1971, Volume II, p. 48) observes that “The regulatory lag… is it to be regarded not as a deplorable imperfection of regulation but as a positive advantage. Freezing rates for the period of the lag imposes penalties for inefficiency, excessive conservatism, and wrong guesses and offers rewards for the opposites: companies can for a time keep the higher profits they reap from superior performance and suffer the losses from a poor one.”Footnote 29 One can see the seeds of price-cap regulation in these observations—well before Baumol (1982) and Littlechild (1983).
During certain periods of time, COSR regulation for electric utilities has been more regulatory lag than formal application of COSR through annual formal rate cases. In earlier work, I found that about a third of the utilities had zero formal rate reviews between 1958 and 1972, and another third of the companies had one rate review (Joskow, 1974, Table 3). Lowry et al., (2017, their Table 2) report rate-case activity for a longer period of time—1948–1977—with similar patterns of rate-case activity. EIA reports the number of electric utility rate cases for each year from 1980 through 2018 from third party sources (USEIA, 2019),and S&P Global (2023) extends the time series to 2022, though it has been suggested to me that the S&P Global may overstate the number of rate cases in recent years by counting some formula rate adjustments as rate cases.
Overall, the number of annual rate cases varies widely over the 1948–2022 period. During much of this period the probability that a utility was subject to review in a formal rate case was quite low. However, the number of formal rate cases began increasing about 2000, around the time that the restructuring process began—and the number of rate cases continued to increase through 2022. This is consistent with the recent perception by regulators that the administrative burden of formal rate cases has been growing.
Moreover, in most cases, the utility initiated the rate case and not the regulator.Footnote 30 The decision by a utility to trigger a rate case seems to be driven primarily by changes in interest rates, inflation, and the accumulation of capital investments that have not yet been included in the rate base and rates. Restructuring activity, including mergers, may also trigger a formal rate case. Eventually, these factors cause actual earnings to fall to or below what the regulated firm expected that it would receive in a formal rate case (Joskow, 1973); and, as a result, the utility triggers a formal rate case by filing for a general price increase.
Accordingly, during some periods of time utilities can go for many years without filing for new rates and effectively operate with a fixed price capFootnote 31—which can lead to the efficiency benefits that are discussed by Kahn. However, regulatory lag is an “accidental” consequence of COSR in practice that does not generally reflect strategic decisions by regulators to implement a set of PBR mechanisms to provide better incentives.
In my view, since COSR is a complement to PBR rather than a substitute, if one wants to understand the incentive properties of real PBR programs with dynamic price or revenue adjustments that are based on external indices but that turn to COSR regulation to set and reset prices every three-to-five years, then one needs to understand the details of COSR regulation.Footnote 32
4.2 The Building Blocks of PBR of Distribution Utilities in the U.S.
In the U.S. context, the best way to think about what is broadly referred to as PBR regulation is as a set of PBR “building blocks” that can be adopted individually or combined into a more comprehensive package. As a practical matter, the building blocks tend to be adopted sequentially: with many regulators’/utilities’ adopting one component and then proceeding to adopt others over time. So far, only about a dozen state regulators/utilities have adopted or are in the process of adopting comprehensive PBR mechanisms that include all of the building blocks; but many have “stuck their toes in the water” with at least one component from the set of PBR building blocks to which I now turn.
It is now common practice to break PBR regulation of distribution utilities in the U.S. down into four basic components:
-
1.
Performance incentive mechanisms (PIMs) that are targeted at a set of specific performance metrics.
-
2.
Revenue decoupling mechanisms (Decoupling).
-
3.
Multi-year rate plans (MVRPs) where prices or revenues are adjusted according to exogenous indices between general rate cases (like a dynamic price adjustment mechanism with a fixed term, after which prices are reset with the use of COSR)
-
4.
Performance Incentives that accompany New Initiatives and Pilot Programs.
I will discuss each component in turn.
4.2.1 Performance Incentive Mechanisms (PIMs)
The introduction of PIMs by state regulators to provide benchmarks and incentives for various non-price performance indicia can be traced back to the late 1980s, when a few commissions created incentive mechanisms in connection with energy efficiency programs for which electric and gas distribution utilities in some states were given significant responsibilities. Utility expenditures on energy efficiency programs are typically cost-passthroughs that are recovered automatically by formula adjustments between general rate cases.
However, since the goal of these programs is to stimulate customer adoption of energy efficiency recommendations that also lead to a reduction in electricity consumption, the utility would lose net revenues between formal rate cases due to regulatory lag. Thus, energy efficiency programs did not appear to be a particularly interesting business opportunity for utilities, and many utilities were initially either slow to adopt them and/or did not pursue them with great enthusiasm.
In the late 1980s, the late CEO of New England Electric System (subsequently acquired by National Grid), John Rowe, argued to me that “the rat needs to smell the cheese” and proposed that utilities be given incentives (potential rewards and penalties) that would be based on meeting, exceeding, or falling short of energy savings and associated net benefit benchmarks that would (in turn) be based on independent assessments of performance. The idea of building positive financial incentives into the energy efficiency programs caught on.
As of 2017, 25 states had adopted energy efficiency program incentive arrangements (Brattle, 2017, Appendix A-5).
PIMs gradually expanded to focus on one or typically several of the following quality attributes:
-
Customer Service and Billing Performance Measures
-
Customer Satisfaction Metrics (e.g. customer complaints, service response times)
-
Reliability Metrics (e.g., SAIDI, SAIFI, CAIDI, power quality measures)Footnote 33
-
Employee Safety Metrics (e.g., restricted work injury index)
-
Distribution Efficiency Metrics (e.g., line losses)
-
Generator Performance Metrics (for vertically integrated utilities)
-
Load factor and peak load reduction targets.
As of 2017 about 16 states had adopted at least some of these additional PIMs (Brattle, 2017, Appendix A-2).
More recently, even more PIMs are being added in response to the changing regulatory and policy responsibilities. These include:
-
Targets for expanding distributed generation and storage
-
Targets for the expansion of EV storage facilities (utility-owned and third-party)
-
Targets for moving customers to voluntary time-of-use (TOU) and critical peak pricing rates
-
Targets for expanding customer demand response capabilities
-
Environmental metrics (e.g., greenhouse gas (GHG) emissions)
-
Targets for “smart grid” deployment
-
Targets for “beneficial electrification” (e.g., heat pump adoption).
Adoption of the more recent PIMs is becoming more common in states that have adopted aggressive decarbonization and electrification targets. Regulators that have adopted at least one of these types of PIMs include New York, Vermont, Illinois, North Carolina, Washington, Hawaii; and states that are in the process of doing so include Connecticut, Maryland, and Nevada (Rocky Mountain Institute, 2022 and a communication from Mark Lowry with updated information).
One of the challenges in establishing PIMs is determining the appropriate targets or benchmarks for satisfactory performance. This is challenging due to: limited data availability; natural variation from one year to the next; lack of comparability across utilities in different regions of the country; differences between urban areas with significant underground distribution infrastructure and rural areas with primarily above ground infrastructure; and the technical challenges of doing sound benchmarking analyses.
Two approaches are often used: The first is to benchmark the utility against its own historical performance, and challenge the utility to meet or exceed its historical performance. If the utility consistently beats the benchmarks, they can be tightened. The second is to use industry benchmarks: trimming the data to take account of variations in exogenous drivers of performance in an effort to identify comparable utilities.
The final question is the specification of the incentive arrangements: In many states there is no financial incentive; but performance standards can be set by the regulator (similar to license conditions in Great Britain), and the utilities must prepare and make public a “scorecard” with their performance metrics. This is sometimes referred to as creating “reputational incentives.” Presumably, this information can then be used by the regulatory agency and intervenors in its next formal rate case to adjust allowed returns if there is poor performance.
In some states there are financial penalties for falling outside a range of acceptable performance (a “deadband”); and for some PIMs—especially energy efficiency PIMs—there are both financial rewards and penalties. For example, Massachusetts has defined a set of fairly complex formulas for calculating a deadband, penalty ranges, and financial penalties for a set of PIMs with a maximum aggregate penalty of 2.5% of annual T&D revenues (MDPU, 2016). The maximum penalty is not trivial. In a recent case that involved NSTAR’s rates, the maximum penalty would have been more than 10% of its net income (MDPU, 2022).
An example of actual penalty assessments can be found in a 2020 Massachusetts commission evaluation of Massachusetts Electric’s performance against a set of PIMs. It was assessed a penalty of $13,678,603 for missing some performance benchmarks compared to rate case net income of about $80 million or 15% of net income (MDPU, 2019).
4.2.2 Revenue Decoupling
As energy efficiency programs began to spread in the late 1980s and early 1990s, environmental groups became concerned that utilities would not fully embrace energy efficiency programs because the programs reduced the quantity of electricity sold. More recently, groups that represent DER—especially rooftop and community solar PV—and suppliers of non-wires and other competitive solutions to distribution network congestion and quality issues became concerned that their efforts would be resisted because they could reduce utility sales, rate base, and profits. Regulators with similar objectives also were concerned that regulatory lag would undermine incentives to pursue these programs aggressively.
One approach to these concerns was the introduction of the customer energy efficiency PIMs that I have already discussed. Another—sometimes in conjunction with an energy efficiency program PIM—approach was the introduction of automatic lost-revenue adjustment mechanisms (LRAMs) and more recently a general “decoupling” of revenues and sales that adjusted revenues to compensate for lost margins due to the divergence of sales from the values that were assumed in the most recent rate case.
Under an LRAM, the utility’s revenues are automatically adjusted between rate cases in order to compensate it for lost profits (margins) from realizing sales that were lower as a result of the effects of its energy-efficiency programs than had been assumed in the previous rate case. A general revenue decoupling mechanism is broader: It adjusts revenues and profits for all increases or decreases in quantities sold from the test year values that were used in the last rate case. The lost revenues could be from energy efficiency programs, increases or decreases in customers, rooftop solar PV installation, weather events, etc.
Accordingly, during a regulatory lag period, revenues and profits are not affected by variations in quantities. Note that for these adjustments to work as planned, the regulator needs to define the “margin” between prices and short run marginal costs so as to make the adjustments to restore agreed-to revenues profit neutral. This can be a complicated (and potentially controversial) set of calculations.
The California Commission (CPUC) introduced the first revenue-decoupling mechanism in the early 1980s. It is generally referred to as an ERAM (Electric Rate Adjustment Mechanism). It worked automatically to ensure that the affected utilities received exactly their authorized revenue requirement regardless of variations in quantities over time (Mornay and Comnes, 1990; Eto et al. 1994). The ERAM was supported by energy efficiency advocates so as to remove what they viewed as a bias against utility managed customer energy efficiency programs created under COSR. Others argued that the ERAM would mitigate the gaming of quantity forecasts in general rate cases where forecasts of future quantities are used, and would reduce the financial risk that was faced by utilities in association with variations in earnings between rate cases.
The ERAM was controversial, and at one point the staff of the CPUC recommended that it be ended. It operated from 1982 until 1996—when it was suspended as part of California’s anticipated (but short-lived) retail competition program. A revenue-decoupling mechanism was reintroduced in California in 2001 (Lowry et al., 2017, p. 6.8). There are now about 30 states that have adopted LRAMs or revenue decoupling for at least one of the distribution utilities that they regulate.Footnote 34
4.2.3 Multi-Year Rate Plans (MYRPs)
In the U.S., dynamic adjustment mechanisms—such as price-cap mechanisms with external adjustment indices—are called Multi-Year Rate Plans (MYRPs). The good plans are different from traditional regulatory lag in that the regulator sets a fixed time period between rate reviews ex ante—typically three-to-five years—so that neither the regulator not the utility determines when the next formal rate review will occur. They also build in adjustment for input price inflation, productivity benchmarks, service quality, and other considerations.
It is important to distinguish between two polar types of MYRPs: The type that is a natural component of a PBR plan that provides cost-efficiency incentives adjusts prices or revenues based on external indices of input costs, productivity or other factors. It may be accompanied by a profit-sharing or sliding-scale plan as well as include reopeners for various unanticipated or highly uncertain costs.
The other polar type of MYRP is a dynamic “formula rate” plan, where the utility’s rates are adjusted annually (say) based on realizations of the actual costs that the utility incurs: There are automatic true-ups for the actual operating and capital costs that are incurred by the utility in order to maintain the allowed rate of return that was determined in its last rate case. Some formula rates also provide for adjustment in the benchmark allowed rate of return for changes in external interest rate indices: for example, the yield on 30-year Treasuries. This is not a PBR plan. Formula rates are basically automatic pure COSR plans that have extremely poor incentive properties because they are effectively automatic cost-plus mechanisms based on whatever costs the regulated firm incurs—without formal regulatory reviews of costs and other attributes of performance.
California was the first state to rely on MYRPs of the former type beginning in the early 1980s (Lowry et al., 2017, Sect. 6.2).Footnote 35 In California, the MYRPs now apply to all of the IOUs in the state. The MYRPs have evolved considerably over time: They started with terms of two years; then rose to three years and are now four years for the three largest IOUs in the state (communication from Matt Makos).
A major rate-setting hearing—The General Rate Case (GRC)—establishes rates for the future period with the use of standard COSR principles. The established rates are then escalated over the next three years with the use of a set of external price indices that are applied separately to operating costs and capital costs. There are often specific additional items that are included in the utility’s dynamic cost profile based on approved business plans or as passthroughs for costs that meet a set of specific criteria (Synapse Energy Economics, 2019, p. 15). The details have varied significantly over time.
While the CPUC has characterized the MYRP plans as PBR, MYRPs were also introduced as a matter of administrative convenience since the formal base general rate cases are very detailed and administratively burdensome examinations of the companies’ costs and rates. A three-year cycle in particular makes it convenient to space the reviews for one of the major IOUs each year since there are three major IOUs in California, which conserves scarce regulatory staff resources.
As was noted above, the IOUs in California have been subject to revenue decoupling as well, except for a short time period. In addition, there has been an energy efficiency/demand-side management (DSM) PIM since 2007 (Lowry et al., 2017 p. 6.9) which was terminated in 2000 (communication from Matt Makos. While the CPUC monitors service quality metrics, there are no service quality PIMs at the present time, although the CPUC experimented with them in the past (Lowry et al., 2017 p. 6.14; Regulatory Assistance Project, 2021, p. 18). Instead, there are specific service-quality standards without penalties or rewards. The CPUC has also experimented with power plant performance incentives (Regulatory Assistance Project, 2021, pp. 65–66).
The New York Public Service Commission (NYPSC) has used MYRPs to regulate utilities since the early 1990s, though the details have varied from one utility to another. The regulator added a regulatory mechanism in 2016 (the review was initiated in 2014)—Reforming the Energy Vision (REV)—to help support New York’s aggressive decarbonization goals (NYPSC, 2016). I will discuss REV separately below.
The use of MYRPs in New York was partially stimulated by a desire to improve incentives but also to reduce the administrative burden of the increasing frequency of rate cases for six IOU electric distribution utilities along with the NYPSC’s other regulatory responsibilities (gas distribution, water, steam, intra-state telecommunications, and oversight of cable TV). New York had also been using future test years to set rates in general rate cases for many years, so it had considerable forecasting experience.
MYRPs in New York use external inflation indices to adjust the O&M components of prices between rate cases, and have several contingencies that trigger reopeners or pass-throughs for extraordinary costs or costs that are hard to forecast (Synapse Energy Economics, 2019, p. 15). The New York commission has adopted one-way (e.g., excess) earnings or profit-sharing mechanisms (Lowry et al., 2017, p. 6.16). There are service-quality PIMs and energy-efficiency PIMs. NYPSC has adopted revenue decoupling as well.
A plan that was adopted by the Maine Public Utilities Commission (MPUC) to regulate Central Maine Power provides an interesting case in which a state regulatory agency adopted MYRPs, but then concluded that the MYRPs that it was using had not yielded the benefits that had been anticipated (Lowry et al., 2017, Sect. 6.1). The plan was in operation from 1995 until 2013 in three cycles and then abandoned until very recently. The plans used inflation escalators for revenue requirements between rate cases but gave the company unusual rate design and marketing flexibility. They contained productivity offsets (X factors) and also included service-quality PIMs and energy-efficiency PIMs.
The MPUC was not satisfied with Central Maine Power’s performance under the plan, and the company returned to more traditional COSR regulation in 2014. In June 2023 the MPUC approved a new MYRP for Central Maine Power (MPUC, 2023), which was agreed-to through a settlement process (as were the earlier plans). The term is two years, and the annual revenue adjustments are fixed ex ante and are not adjusted with inflation indices. The plan focuses on a variety of service-quality PIMs and continues the existing revenue-decoupling mechanism. It contains an earnings-sharing mechanism as well, which shares earnings deviations from a benchmark level between the utility and its customers.
Massachusetts, Hawaii, Minnesota, Vermont, Rhode Island, and Maryland have adopted MYRPs in the spirit of RPI-X. Other states are considering doing so or are in the process of designing MYRP mechanisms (e.g., North Carolina, Colorado, Connecticut, Nevada, and Arizona). A few other states have considered doing so and decided against MYRPs (e.g., Michigan). Hawaii adopted an MYRP as part of a very comprehensive PBR plan in December 2020. I will outline its components at the end of this section.
I turn finally to formula rate plans: As was discussed above, formula rate plans are MYRPs that allow utilities to adjust their rates between regulatory reviews based on their own actual costs incurred rather than on exogenous input price indices and productivity benchmarks. This allows utilities to maintain their earnings within a rate-of-return-on-equity band that was established in a previous rate case.
Most of the pure formula rate plans have operated in states in the South. For example, Alabama Power has operated with a formula rate plan in the past. Critics have pointed out that under this plan, as of 2013, Alabama Power did not have a formal contested rate hearing in 30 years so that it received virtually automatic recovery of the costs that it occurred without external benchmarks or regulatory lag (Schlissel and Sommer, 2013). Formula rate plans have worse efficiency properties than COSR in practice.
4.2.4 Performance Plans for New Initiatives and Pilot Programs
Some commissions have introduced an ad hoc set of additional performance incentives that have been targeted at specific initiatives so as to give the distribution utilities incentives to experiment with adapting to state climate policies and changes in the structure of the electric power industry.
New York’s Reforming Energy Vision (REV) framework is an example. While I think that there is more hype than substantial regulatory reform in this regulatory framework in practice, it does represent an important view of: the changing business model for distribution utilities in the era of growth of DER; distribution level storage; non-wires options for responding to distribution system reliability and congestion issues; and a growing interest in some states in spurring third-party solutions to grid development needs that are allowed to compete with the incumbent distribution utility’s proposals.
REV seeks to motivate distribution companies to view themselves as a “platform” on which third-party suppliers of various distribution-level services can compete with the distribution company When a third party is selected to provide the services, the distribution company receives a financial incentive to compensate it for an estimate of its lost profits from choosing a third party to meet the need. The NYPSC envisions that the revenues and earnings from these third-party services will grow over time.Footnote 36
The primary example of the application of REV is the pilot Brooklyn-Queens demand management program that was adopted by ConEdison as an alternative to additional investments in its distribution system to remediate forecast reliability issues in this area due to growing electricity demand. Rather than the costs of the demand management program being a direct pass-through into distribution rates, the costs are to be capitalized, rate-based, amortized over 10 years, and eligible for a return on the sum capitalized. In essence, ConEdison can recover and earn a return on these expenditures over a 10-year period.
As was already noted above, many other utilities in the U.S. have similar PIMs for energy-efficiency program expenses (Lowry et al., 2017, Sect. 6.16),Footnote 37 so this is not quite as innovative as the NYPSC seems to think. I suppose that the idea here is to expand this approach to a wider set of potential distribution “platform” projects and additional projects are being reviewed or have now been approved by the NYPSC.Footnote 38
Another example is a similar “Non-Wires Alternative Requirement” pilot program in California. The utility that hosts a project would now be allowed to charge a fee of 4% of the cost of non-wires alternatives that are selected through competitive solicitations (NREL, 2017, p. 63).Footnote 39
A third example is the incentive arrangement that is being provided to the three IOU distribution companies in Massachusetts, so as to encourage them to agree to manage competitive solicitations for long-term renewable energy contracts for hydroelectric energy from Canada, solar, onshore wind, and offshore-wind and to serve as the counterparty buyer under the long-term contracts that are selected through the competitive solicitations for these carbon-free energy supplies.Footnote 40
Ordinarily, purchased power costs would be treated as a cost pass-through that is subject to the standard prudence/reasonableness review contingencies. Commitments to enter into large long-term contracts that involve taking-on a potentially significant contractual liability and creates potential regulatory risks down the road if the contract price turns out to be above the competitive market price. New England has a very competitive wholesale energy market that is managed by ISO-NE, and Massachusetts has retail supply competition and municipal aggregation; the distribution companies have already lost a significant fraction of their retail energy supply customers—providing the latter with regulated distribution delivery services only.
For example, Eversource—the largest distribution company in Massachusetts—supplies only about 20% of the energy that is consumed by its distribution service (delivery) customers. As a result it may not really “need” as much energy to serve customers or to meet its renewable energy obligations as it is contracting for under these 20-year contracts.Footnote 41
Under the MDPU regulations that are associated with these contracts, however, the utilities would receive a fee for taking on these contractual obligations. The fee is 4% of the cost of the energy that is supplied under the contract.Footnote 42 In addition, the distribution utilities can resell the contracted energy in the ISO-New England wholesale markets and recover any losses that reflect the difference between contract prices and wholesale market prices (or credit any gains) as an additional non-bypassable distribution wires charge. (Eversource still supplies all retail customers with distribution services whether they have chosen a competitive energy supplier or not.)
Basically, the state is leaning on the balance sheets of the distribution utilities and on their distribution service customers in order to support the long-term contracts for renewable energy that the state thinks it needs to meet its decarbonization commitments.
A fourth example is the CPUC’s May 2022 approval of special funding for four residential and commercial pilot programs to examine the costs and benefits of using electric vehicle batteries to supply electricity to homes and businesses during blackouts and as suppliers to the grid (bi-directional charging).Footnote 43 Hawaii and Vermont have also undertaken interesting pilots. If the pilot works well, it could become a standard program with an associated PIM.
4.3 Putting the Components Together to Create a Comprehensive PBR Mechanism
A comprehensive PBR mechanism would put all of these components together into a single integrated package. The multi-year PBR plan that was adopted by Hawaii at the end of 2020, effective June 1, 2021, and to be applied to Hawaiian Electric puts all of these building blocks together: Hawaii—along with Massachusetts, New York, and California—has perhaps the most comprehensive PBR plan in the U.S.Footnote 44
The state of Hawaii has a made a commitment for 100% of its electricity to be generated from renewable sources by 2045.Footnote 45 In 2022, 31.8% of Hawaii’s electricity was generated from renewable sources—the largest fraction of which comes from customer-sited solar PV and wind generation. Hawaiian Electric also manages a competitive procurement program for grid-based solar, wind, and other renewable resources (e.g. geothermal) to help to meet the aggressive decarbonization requirements that currently accounts for a little more than half of Hawaii’s renewable generation.Footnote 46
The Hawaii PBR plan (PUCH 2020) has many similarities to plans that have or are in the process of being implemented in Massachusetts, New York, California, and other states. The plan’s main provisions are summarized in Table 2.Footnote 47
The PBR plan has all of the components that were discussed in this section: PIMs; revenue decoupling; a Multi-Year Rate Plan with a term of five years that escalates revenues with the use of an external price index and a predetermined productivity index; and other incentives that are focused on achieving Hawaii’s decarbonization commitments. It also has an earnings-sharing or sliding-scale mechanism that shares profits above and below the authorized rate of return between customers and shareholders, as well as various provisions to deal with large uncertain future cost contingencies.
Note that the Public Utility Commission of Hawaii (PUCH) has a permanent staff of only 68. As a result, the analytical analyses that went into creating this PBR is not nearly as extensive or sophisticated as OFGEM’s analysis in the RPI-x@20 review or the designs of RIIO-1 and RIIO-2 in Great Britain. However, the staff has the experiences of other states to draw upon and advisors from non-profit and other organizations to assist it.
This appears to be a promising plan in principle since it aligns several incentive mechanisms clearly with Hawaii’s objectives for transforming its electricity sector. Since the plan is quite new, we do not yet have any sense for how it will perform in practice. It will be challenging because it has so many moving parts.
5 Influence of “RPI-X” and RIIO in Great Britain on the Evolution of PBR for Electric Distribution Utilities in the U.S.
Many of the advisory and consultant reports that played a role in educating state regulators and legislatures in the U.S. in the last decade about the application of PBR mechanisms to electric distribution companies refer to the most recent regulatory reforms in Great Britain—RIIO—as providing a useful model from which U.S. regulators could learn.
I have already discussed why the previous package of incentive regulation mechanisms—“RPI-X”—was not particularly influential in the U.S. This is unfortunate. While the details of the package of RPI-X mechanisms in Great Britain had evolved over time from a simple price-cap mechanism to a much broader set of incentive mechanisms, their overall performance had been quite good when judged against conventional “competitive market” performance benchmarks: Distribution prices and costs were down; investment was up; quality of service was up; integration of new generating capacity and retirement of old generating capacity was successful; and the cost of capital was down; etc. (Littlechild, 2009; OFGEM, 2008a, 2008b). How much of these performance improvements can be attributed to privatization and the opportunity to squeeze out pre-privatization inefficiencies and how much to attribute to PBR is unknown.
Despite this excellent performance, in 2008 OFGEM launched a detailed two-year review process—RPI-X@20—that covered electric and gas distribution and transmission networks.Footnote 48 In 2010, based on this review, OFGEM (2010a, b) embarked on a process to design a revised regulatory process—RIIO—that built on all of the best components of RPI-X as it evolved over time while expanding the set of incentive metrics and regulatory oversight of performance.
The first RIIO distribution price control—RIIO-ED1—took effect in 2015; and the second—RIIO-ED2—with further reforms took effect in 2023.Footnote 49 I will not discuss here the separate RIIO reforms for transmission owners and the system operator here since they have had no significant influence on U.S. regulatory practice with regard to transmission owners or system operators.
If the RPI-X package of incentive mechanisms applied to electricity distribution as it evolved over time in Great Britain was so successful, why change the regulatory mechanisms after 20 years of evolution and improvement? Certainly, after 20 years it makes good sense for regulators to review and assess the performance of any regulatory processes on which they have relied and to assess whether they are “fit for purpose” in light of: changes in the industry; changes in technology; and changes in public policy that have led to changes in the responsibilities of electricity distribution utilities.
It appears that many of the same drivers of regulatory reform were at work in Great Britain as in the U.S. The expectation for and the responsibilities of distribution companies were changing rapidly and significantly to support Great Britain’s aggressive decarbonization policies, as is the case in the U.S. (OFGEM, 2008a, 2008b).
The RPI-X@20 review assessed whether changes in the regulatory framework were required to regulate electric distribution, transmission, and system operator companies effectively in light of these changes. The result was a significant number of changes in the regulatory framework that moved it even further from reliance on a simple price-cap mechanism.
RIIO-ED1 and ED2 are even more complicatedFootnote 50 than the final iterations of the package of incentives referred to as “RPI-X” prior to 2010 (Joskow, 2014, pp. 310–326). I will identify a few of the major reforms that have been made in RIIO-ED1—some of which have been of particular interest to U.S. regulators—and then identify some relevant changes that were made subsequently in RIIO-ED2Footnote 51:
-
RIIO was characterized by the British government as representing a shift from an ex ante set of incentive mechanisms that focused on “inputs” to an ex ante set of incentive mechanisms that focuses on “outputs.” I don’t think that this characterization of RPI-X is completely accurate, since prices, costs, service quality, and customer satisfaction are “outputs.” Moreover, the package of PBR mechanisms that were characterized as RPI-X included incentive mechanisms for service-quality metrics in addition to the annual price adjustment mechanism using an RPI-X formula for the five years between COSR rate reviews. It also used menu options from which a regulated firm could choose. The COSR rate reviews were themselves quite comprehensive and very similar to those that were used in the U.S. However, RIIO expands the range of outputs that are included in the incentive mechanisms.
-
The expanded set of outputs now include environmental impact and social obligations along with customer satisfaction, safety, reliability, and connection times.
-
RIIO responds to asymmetries between the treatment of OPEX and CAPEX in RPI-X by basing the ex ante incentive mechanism on total expenditure (TOTEX), which draws heavily on business plans that are submitted by the utilities and expands opportunities for stakeholders to engage in the review of the business plans that have been submitted. The TOTEX targets reflect, as well, productivity benchmarking that is based on data for the 14 distribution utilities and what would be called a customer dividend (or “stretch factor”) in the U.S.
-
The RIIO-ED1 price control period was set at eight years, rather than the five years that was previously used in the RPI-X framework. It was extended to eight years to encourage longer term planning and investment and to reduce the asymmetries between OPEX and CAPEX that were perceived to be a problem with the implementation of RPI-X. The extension of the term of the price adjustment formula to eight years was widely applauded at the time. But this also increased uncertainty about forecasts of OPEX and CAPEX—just as many changes were expected in the costs of meeting new distribution company obligations. This increased uncertainty about profits over an eight-year time period, which potentially created more conflicts between rent extraction and budget-balance goals and constraints.
-
The total expense forecasts and associated incentives to increase efficiencies by beating the total expense baseline relied very heavily on forward budget plans that are submitted by the utilities and vetted by OFGEM with input from stakeholders. Accordingly, RIIO has included incentives for the utilities to submit accurate business plans in the form of an Information Quality Incentive (IQI) mechanism.
-
Sharing of returns above and below each distributor’s cost of capital between the utility and customers (a sliding-scale, or profit-sharing provision a la Lyon, 1996), which varies by distribution utility.
-
Uncertainty mechanisms to allow for adjustments in the allowed TOTEX profile over time if unanticipated events and expenditures occur.
-
Availability of small grants from an innovation fund to support approved small-scale projects.
-
Promotion of opportunities for non-wires solutions to resolve distribution constraints and to consider more efficient alternatives that are proposed by competitive suppliers.
-
The process for setting the basic price and revenue parameters with the use of COSR principles (RAV, WAAC, etc.) is continued—except that the depreciation for new investments was extended to 45 years from the prior 20 years. This spreads the impact of the anticipated major need for new investments in distribution over a longer period of time.
-
Passthroughs of certain costs that cannot be controlled by the utility.
-
Mid-course reviews and limited reopeners for unanticipated changes in the TOTEX baseline.
-
Expanded stakeholder engagement in the regulatory process received considerable attention (making it more like the U.S.).
The initial RIIO mechanisms are fairly complicated, but they happen to embody many of the changes in the role of distribution companies in the U.S. that have been embraced—in particular, by states that have adopted aggressive decarbonization policies. However, the RIIO-ED1 mechanisms that applied to distribution companies in Great Britain led to some performance issues. Among other things, almost all of the distribution companies earned returns that were well above the ex ante expected benchmark returns (Jamasb, 2020; OFGEM, 2019a, 2019b). This likely reflected the fact that the eight-year business plans that were adopted in RIIO-ED1 deviated significantly from the capital and operating expenses that were actually incurred by the distribution companies during the first eight-year RIIO period: Actual expenditures were lower than forecast.
It does not appear that the lower TOTEX was due primarily to efficiency gains, but instead were due to uncertainties about progress of various decarbonization initiatives. In my experience, policymakers and regulators often set ambitious goals: for example, for EV penetration, EV charger deployment, DER expansion, and building electrification. The distribution utilities then plan to make expenditures to meet these goals; and when progress toward the goals falls short of the goals, expenditure plans are adjusted and fall below initial business plans that were used to set the baseline prices in the eight-year term of the price control.
As a result of the performance under RIIO-ED1, a number of changes were made in the subsequent price-control period for RIIO-ED2 (2023–2028). There are lessons here for U.S. regulators. The most significant changes in RIIO-ED2 that would be of potential interest to U.S. regulators were (OFGEM, 2022; OXERA, 2022):
-
Reduced the price-control period—from eight years back to five years—based on the conclusion that there was too much uncertainty for a longer price control period. Thus, one of the features that was applauded in RIIO-ED1—the 8-year term—turned out to be too long to deal effectively with uncertainty about TOTEX, inflation, rising interest rates, etc. It led to excessive profits for the distribution utilities and did not achieve an appropriate balance between rent extraction and efficiency incentive goals.
-
Tightened the cost-efficiency improvement challenges, which cut the allowed OPEX further from the business plans that were introduced by the utilities based on benchmarking considerations.
-
Introduced new incentive arrangements for accurate business plans: the core input to the allowed TOTEX profiles. This replaced the earlier Information Quality incentive.
-
Adjusted the incentive mechanisms for various designated outputs: Some outputs were placed in the license conditions for the distribution companies rather than as part of the price control with an incentive mechanism, such as using best data practices, environmental action plans and customer engagement. In other areas—such as grid reliability, cybersecurity, and large project delivery—adjustments were made in the incentive arrangements.
-
Introduced new mechanisms to adjust for load/output variations from those embedded in the OPEX profiles, including two new automatic adjustment mechanisms.
-
Introduced reopeners that were related to decarbonization cost and demand drivers.
-
Made changes in the calculations of the components of the target WACC.
It is clear that the RIIO-ED1 and RIIO-ED2 processes reflected efforts to provide incentives for the distribution utilities to adapt to and support their changing roles—especially with regard to decarbonization policies and the social (income distributional) implications of these policies. It is also quite clear that these changes in the policy environment have increased the challenges of regulating electric distribution utilities in the face of uncertainty and asymmetric information.Footnote 52
OFGEM seems to have responded to these challenges by increasing the amount of information that it collects and by becoming much more involved in detailed distribution utility business decisions with associated incentives to support the decisions that it wants to incentivize. RIIO-ED2 could be interpreted as holding the distributors’ “feet to the fire” more aggressively so as to induce them to follow their expanded portfolio of responsibilities.
It is clear that the RIIO incentive regulation system has moved quite far from the relatively simple price-cap mechanisms that are typically associated with the phrase “RPI-X” as applied to telecommunications services.Footnote 53 It certainly involves considerably more micromanagement by the regulator than has historically typically been associated with PBR plans.
6 Regulatory Framework for Transmission in the U.S.
A more detailed discussion of FERC regulation of transmission can be found in DeLosa et al. (2024).
In a previous article (Joskow, 2005) I discussed the attributes of the regulation of transmission service pricing prior to and during the initial implementation of FERC’s wholesale market, transmission access, and pricing, operation, and investment reforms that were being implemented in the 1996–2004 period.Footnote 55 There were no state or federal PBR mechanisms in place at that time that applied specifically to transmission network prices, operations, maintenance, and investment. I refer interested readers to that article. I will focus here on the current and evolving regulatory arrangements in the U.S.
As a consequence of FERC’s Orders 888, 889, 890, and 2000, and of subsequent orders that refined and expanded these core reform regulations,Footnote 56 the organization and regulation of the transmission segment of the U.S. electric power sector has changed significantly from the pre-restructured period—especially for utilities that have unbundled transmission service and become members of ISO/RTOs.
Although the creation of and membership in ISO/RTOs is voluntary, the majority of IOUs—except for those in the South and the West (aside from the IOUs in California that are members of CAISO)—have joined ISO/RTOs. Members of ISO/RTOs currently account for about 2/3 of the retail customers in the U.S. There are proposals to create an expanded Western RTO, though I expect that this will proceed in stages that will build on the Western Energy MarketFootnote 57 that is operated by the CAISO.Footnote 58 I will focus here on the IOUs that have unbundled transmission service and have become members of an ISO/RTO.Footnote 59
Today, all transmission owners that are subject to FERC jurisdiction—whether transmission service is fully unbundled or not—must file Open Access Transmission Tariffs (OATT) for approval by FERC that define the terms and conditions of access to their transmission networks and the regulated prices for various transmission services that satisfy FERC’s OATT service and pricing provisions.Footnote 60 Utilities that are members of ISO/RTOs rely on the ISO/RTO’s OATT, and the ISO/RTO develops a COSR revenue requirement on behalf of each member transmission owner (TO) for filing with FERC.
Each TO then uses the TO-specific revenue requirement that is calculated by the ISO/RTO to make filings with FERC to support its individual TO transmission revenue requirement for approval. FERC can approve or adjust the requested revenue requirement that supports the specific transmission service prices in the OATT.
Accordingly, FERC is the ultimate regulator of all transmission service revenues and rates, including the cost of capital, depreciation rates, allowable operating costs, and the rate base for members of ISO/RTOs.Footnote 61
FERC uses traditional COSR principles—adjusted for the “incentives” that I will discuss below—to establish revenue requirements for each TO and approves the ISO/RTO cost allocations to set “wholesale” transmission service rates in the ISO/RTO’s OATT.Footnote 62 FERC allows transmission owners to choose to use formula rates to recover their FERC jurisdictional revenue requirements as a substitute for its traditional reliance on formal COSR rate cases.Footnote 63 Not surprisingly, that is how many transmission owners have opted to get their FERC jurisdictional allowed transmission revenues and transmission service rates adjusted over time. Accordingly, joining an ISO/RTO effectively shifts the regulation of transmission rates completely to FERC, which now typically relies on a formula rate mechanism to adjust each TO’s FERC jurisdictional revenues and transmission service prices over time based on the actual costs they incur.
Most TOs are also distribution companies that serve retail consumers. For these transmission-and-distribution (T&D) companies, the FERC-approved transmission revenue requirement ultimately is passed through into the distribution utilities’ retail rates net of any transmission revenues that are earned from transmission service that is provided to third parties. State regulators do have jurisdiction over how the FERC-approved transmission cost is allocated among classes of retail consumers (i.e. residential, commercial, industrial, street lighting, etc.), and this is reflected in the T&D retail delivery charges for customers in each retail rate class.
FERC has not adopted a coherent PBR framework. It has created a set of targeted incentives in the form of ROE adders and attractive “alternative” accounting and financing rules to encourage certain categories of utility behavior. I will discuss those incentives separately below. Since the ISO/RTO is responsible for system planning, FERC’s presumption is that the projects that are selected by the ISO/RTO through its planning and interconnection processes are “reasonable.” However, there may be significant spending on “local” transmission facilities that does not go through the same ISO/RTO managed planning and approval process as do “regional” transmission investments.
For example, in PJM, substantial “local” transmission investments are referred to as “supplemental” and do not come through the PJM regional planning process. PJM states that “supplemental project costs are not PJM approved.”Footnote 64 Stakeholders have complained about this situation, and PJM has made some reforms that require a more transparent process to review supplemental upgrades.Footnote 65 Similarly, FERC does not have a meaningful process to review the reasonableness of the costs of any projects once they are completed nor a meaningful process to require a formal cost/benefit analysis to justify them.
Basically, if the projects are selected through the ISO’s planning and allocation process, that is what FERC relies upon. There is no meaningful analysis of whether the estimated transmission project cost at the time that the projects were selected are consistent with the realized costs or the reasonableness of any cost overruns. Nor is there any assessment of project performance—e.g., availability, unplanned outages—once it is completed.
State regulators or other stakeholders can in principle object to both the reasonableness of the transmission projects that are selected and the reasonableness of their costs and performance. The CPUC has filed at least one complaint with FERC with regard to about 40% of one IOU’s transmission investments that were incurred outside of CAISO’s planning process.Footnote 66 The costs of these investments were being recovered through CAISO’s OATT and were allocated primarily to the distribution utility’s retail customers.
FERC ultimately rejected the complaint: FERC argued that Order 890 applied only to “expansions of the transmission grid” and not to replacement or refurbishment investments, which are apparently the attributes of local transmission investments.Footnote 67 The Office of Ohio’s Consumer Counsel recently filed a similar complaint with regard to PJM’s supplemental (e.g., local) transmission investments.Footnote 68
Accordingly, as things stand now, these “local” transmission investments that are not selected through an ISO/RTOs regional planning process appear to fall into a gap in regulation by either FERC or the relevant state regulatory commission. While state regulators can and do intervene at FERC when transmission rates are proposed to be adjusted, the objections are typically focused on the allowed rate of return, accounting issues (e.g., whether to capitalize or to expense certain costs; depreciation rates), and tax issues.
Thus, the combination of essentially no serious FERC regulation of project selection or of project costs, and FERC’s formula for COSR rates to adjust the transmission revenue requirement, makes the incentive properties of FERC regulation quite poor. This arrangement may also be a source of the incumbent transmission owners’ resistance to competitive procurement (Joskow, 2020, 2021) and merchant transmission projects.
Some states have been quite unhappy with ceding all authority over transmission rates, transmission project selection and transmission planning to FERC. They could use other state-level authorities and powers (e.g., permitting) to review transmission projects and could devote more resources to intervening at FERC when they think that projects, investment costs, or operating costs are unreasonably high. Most state commissions do not have the resources to do so, though the CPUC has created a transmission project review process that will begin to operate in 2024.Footnote 69
FERC has adopted a set of “targeted incentives” that are potentially available to all transmission owners. They are described by FERC as follows:
“The Energy Policy Act of 2005 directed the Commission to develop incentive-based rate treatments for transmission of electric energy in interstate commerce, adding a new Section 219 to the Federal Power Act. The rule implemented this new statutory directive through the following targeted incentive-based rate treatments:
-
Incentive rates of return on equity for new investment by public utilities (both traditional utilities and stand-alone transmission companies, or transcos).
-
Full recovery of prudently incurred construction work in progress.
-
Full recovery of prudently incurred pre-operations costs.
-
Full recovery of prudently incurred costs of abandoned facilities.
-
Use of hypothetical capital structures.
-
Accumulated deferred income taxes for transcos.
-
Adjustments to book value for transco sales/purchases.
-
Accelerated depreciation.
-
Deferred cost recovery for utilities with retail rate freezes.
-
A higher rate of return on equity for utilities that join and/or continue to be members of transmission organizations, such as (but not limited to) regional transmission organizations and independent system operators.
All rates approved under the rule are subject to Federal Power Act rate filing standards. The rule allows utilities on a case-by-case basis to select and justify the package of incentives needed to support new investment. Additionally, the rule provides expedited procedures for the approval of incentives to provide utilities with greater regulatory certainty and facilitate the financing of projects. The rule became effective on September 29, 2006.”Footnote 70
In 2012, FERC issued further policy guidance with regard to the transmission incentives.Footnote 71 “Applicants must provide sufficient support to allow the Commission to evaluate each element of the package and the interrelationship of all elements of the package.”Footnote 72 In April 2023, FERC issued Order 894, which created cybersecurity incentives as well.Footnote 73
The targeted FERC transmission incentives are clearly designed to make transmission investments, forming separate transmission companies, and joining an ISO/RTO financially attractive to TOs. Since FERC does not have the authority to order that transmission lines be built,Footnote 74 cannot force utilities to join ISO/RTOs, and cannot force them to separate their transmission assets into separate companies (a “transco”, including a separate transco under a holding company structure with affiliated distribution and generation operating companies) or even to fully unbundle their transmission system for transmission rate regulation purposes, using incentives to make it financially attractive to do so makes some sense.
But these incentives seem quite crude “either/or” effective reductions in transmission costs or increases in the profitability of transmission investments that are not tested by comprehensive evaluations of project selection, investment costs, operating costs, and facility reliability. Basically, FERC has not made any meaningful progress in implementing PBR mechanisms for transmission owners in the spirit of the incentive regulation literature or mechanisms that have evolved in other countries, especially Great Britain, including RIIO-T1, RIIO-T2, and RIIO-ESO (Joskow, 2014, pp. 326–31; OFGEM, 2018, 2019a, 2023).
There are three FERC initiatives that provide or support competitive market incentives instead of relying on COSR: The first initiative is reflected in a set of FERC rules that allow merchant transmission developers and operators to propose, develop, and operate transmission projects without applying COSR regulation. Such projects are developed outside of the ISO/RTO planning process but instead rely on developers to table projects for consideration for support by market participants with the use of a competitive “open season” and negotiation with “shippers” to secure contracts for the project.Footnote 75 Merchant project developers are at risk for controlling capital and operating costs, reliability, and finding customers to contract and pay for transmission service.Footnote 76 COSR is, as always, a backstop if FERC finds that the solicitation is not adequately competitive. There are not many merchant projects of this type that have been completed yet, but several are in process.
The second initiative is contained in FERC Order 1000: It encourages the ISO/RTOs to use a competitive bidding process to select certain types of transmission projects. However, the implementation of this provision of Order 1000 has been disappointing (Joskow, 2021).
Finally, the development of offshore wind projects—primarily in the Northeast—has also relied on competitive procurement mechanisms to arrange for transmission from the wind generation area to onshore interconnections. These competitive procurement processes have been organized and managed by the states—not by the ISO/RTOs or FERC.Footnote 77 These offshore transmission projects must still engage with the relevant ISO/RTO for interconnection with the onshore network—including the approval by the relevant ISO/RTO of interconnection facilities and of cost allocations approved by FERC.Footnote 78
Overall, FERC’s efforts to introduce competitive mechanisms are in theory very promising but have faced significant regulatory and interest group barriers to moving forward in practice (Joskow, 2020, 2021). This is especially problematic for potential “interregional” transmission projects that cross one or more ISO boundaries. Such projects are necessary to facilitate access to the best locations for developing wind and solar generating facilities (Joskow, 2021).
The ISO/RTOs (as well as IOUs that are not in ISOs but are in another FERC transmission planning region per Order 1000)Footnote 79 are responsible for transmission planning and interconnection of new generators and merchant transmission facilities. The queues for interconnection studies and agreements have grown significantly in the last few years, as wind and solar energy projects have sought to enter the market as a consequence of: falling costs; clean energy obligations that have been placed on utilities; voluntary decarbonization commitments by many organizations (e.g., Apple, Microsoft, Google, Walmart); and tax incentives.Footnote 80
The ISO/RTOs’ transmission planning processes have also been subject to strong criticisms—especially by states with aggressive decarbonization goals. Americans for a Clean Energy Grid has graded the ISO/RTOs and the other transmission planning regions on these and related dimensions.Footnote 81 Several of the ISO/RTOs and non-RTO/ISO transmission planning regions did not receive good grades.
One can argue with the specific grades that have been assigned to each of the ISO/RTOs and other transmission planning regions; but the disaggregated set of performance attributes that were used in the study make good sense to me, and the associated grades suggest that improvements are needed in some areas.Footnote 82 As will be discussed further below, this is the kind of ISO/RTO performance assessment that could be undertaken by an independent panel of experts and used by FERC to provide rewards and penalties to management based on the ISO/RTO’s performance.
FERC has responded to criticisms of ISO/RTO planning with proposed new rules on transmission planning and cost allocation in 2022 (FERC, 2022).Footnote 83 New rules for improving the interconnection and study processes to reduce interconnection delays were implemented in July 2023—including some targeted financial incentives (FERC, 2023a, b).Footnote 84
In May 2024, FERC issued Order 1920 which primarily addressed (again) transmission planning and cost allocation issues. The Order requires FERC transmission regions to adopt long-term planning and enhanced cost allocation protocols. As this is written, the ultimate status of Order 1920 and its implementation are uncertain. FERC is placing considerable reliance on the ISO/RTOs to be de facto regulators of many aspects of transmission operations, reliability and investment. But what are the ISO/RTOs’ performance incentives? They are non-profit organizations with small balance sheets that are financed with short- and medium-term debt instruments and that rely heavily on sometimes non-transparent stakeholder processes to approve policies.Footnote 85 Financial incentives do not influence ISO/RTO decisions since they are non-profits that balance their budgets by passing on their costs to the members of the ISO/RTO each year. They are required to follow FERC rules; but there are frequent disagreements among the stakeholders and between the ISO/RTOs and FERC. FERC can chastise them for not following the rules, but it cannot punish them financially for failing to follow these policies or rewarding them for embracing these policies in creative ways.
Could FERC develop and apply PBR policies to transmission owners rather than relying on a polar-case version of COSR-formula rates? The Energy Policy Act of 2005 added provisions to Section 219 of the Federal Power Act that directs FERC to establish “incentive-based (including performance-based) rate treatments for the transmission of electricity in interstate commerce by public utilities for the purposes of benefitting consumers by ensuring reliability and reducing the delivered cost of power by reducing congestion.” While this section of the Act can be and has been interpreted by FERC as referring only to promoting additional investment in transmission infrastructure, it could be interpreted more broadly to encompass cost efficiency, operating efficiency, and facility operating reliability. (The only specific incentive on FERC’s current list of transmission incentives that is specified in the Act is to provide incentives for joining a “transmission organization.”).
So, in principle, FERC could interpret these requirements more broadly if it wanted to do so. However, implementing a PBR mechanism that is similar to those for the TOs in Great Britain, or that is similar to those being used increasingly by state regulators of distribution utilities would be very challenging for FERC.
The primary administrative challenge is the very large number of transmission owners in the U.S. The U.S. has hundreds of transmission owners, including municipal, state, and federal transmission owners that are not for-profit entities and arguably not subject to FERC rate regulation. PJM alone has almost 50 transmission owners. ISO-NE has about 20 transmission owners. MISO has about 90 transmissions owners. The transmission owners vary widely in size. There are transmission owners in ISO/RTOs and those that are not. Even in California, a large transmission owner (Los Angeles Department of Water and Power –LADWP) is not a member of CAISO and manages its own control area.
Developing and applying PBR mechanisms such as those that are used for distribution by a single regulatory agency to so many transmission owners in the U.S. does not appear to me to be administratively feasible. Great Britain has only three regulated TOs: One is relatively large and serves all of England and Wales; and two serve Scotland. Most countries in the EU have only one TO per country/regulator. I suppose that policies could be considered that required the transmission owners to merge in a way that matches the contours of the ISO/RTOs; but this is not politically feasible. Or FERC policy could distinguish between large and small transmission owners and apply PBR mechanisms to the large transmission owners and continue with current COSR arrangements for the small transmission owners, and depend on stakeholder complaints to trigger a closer look at individual TOs in this latter group FERC could also increase efforts to support entry of new merchant transmission owners and strengthen competitive procurement requirements for ISO/RTOs to rely more on competition and less on regulation.Footnote 86
If there is a will there is a way, but FERC has not had the interest or the will to find the way.Footnote 87
A natural question to ask is whether and how PBR mechanisms could be applied to ISO/RTOs, since they: are non-profits; are quite small from an operating cost and asset level compared to the transmission owners whose assets comprise the physical transmission system; and have small asset bases themselves that are financed with short-term and medium-term debt. For example, in 2023 ISO-NE had an operating budget of about $200 million, a staff of about 650, and assets of about $100 million financed with debt instruments.Footnote 88 The operating expenses of the other ISOs, which are larger, vary from about $207 million to about $425 million with from 600 to 1000 employees.Footnote 89
We can compare these magnitudes to ISO-NE’s latest annual COSR revenue requirement for the transmission owners in ISO-NE (operating costs, depreciation, return on rate base) of about $2.7 billion per year and invested capital (before depreciation) of these transmission owners of about $20 billion.Footnote 90 At a very basic level, who would be the residual claimant on any penalties and rewards that are assessed to ISO/RTOs? The ISO/RTOs would not be able to sustain penalties without just passing along the penalty costs to the transmission owners as they do now for their operating and capital expenses since they have no shareholder equity cushion. The rewards would have to be credited against the ISO/RTO’s cost of service and accrue through COSR to the TOs and ultimately their customers.
Privatizing and recapitalizing these entities with an equity cushion is unlikely to be politically acceptable and would certainly increase their expenses. This would make sense only if the anticipated savings from better performance under a PBR yielded meaningful savings.
NGESO—the system operator in Great Britain—is now a separate for-profit entity, and it will be useful to follow the benefits and costs that are realized as a result of the application to it of the new RIIO PBR package. This information would be useful for determining whether privatizing ISO/RTOs and applying good PBR mechanisms to them would be attractive from a cost/benefit perspective.
Yet, the ISO/RTOs have very important responsibilities over the nation’s transmission networks that support competitive wholesale markets, system reliability, transmission planning, and oversight of hundreds of billions of dollars of transmission investments; and the ISO/RTOs should be playing an important role in advancing state and federal decarbonization agendas. The back-and-forth of stakeholder complaints during rulemakings and regulatory proceedings that follow compliance filings and complaints at FERC is not a very effective mechanism for improving performance quickly. The threat of firing board members or executives when things don’t go right—as occurred in ERCOT (Texas) following the long energy outages in February 2021—seems to me to be a rather blunt instrument that would be an appropriate managerial incentive only in extraordinary circumstances.Footnote 91
Identifying clearly the performance expectations for the ISO/RTOs would be a good idea and, where possible, so would specifying objective quantitative metrics to help to evaluate ISO/RTO performance—even if only administrative remedies are available. There are lessons here from Great Britain’s regulation of the system operator (OFGEM, 2023). I also think that using an independent panel of experts to evaluate an ISO’s performance would be a good idea, properly counterbalancing the current influence of some stakeholder groups and politicians in decision making. (The RIIO package for the for-profit system operator NGESO in Great Britain relies on a panel of experts to evaluate its performance and to determine a reward or penalty; see OFGEM, 2023).
But where would the incentive rewards and penalties land? There are no shareholders in a non-profit organization, so we need to focus on managerial incentives to meet or exceed well-defined performance benchmarks.
A potential approach for non-profits would be to create a performance-based compensation bonus pool and use the evaluation and incentive process to fund it for distribution to senior managers and other designated employees. For example, the 2024 proposed budget for ISO-NE includes roughly $20 million in incentive compensation.Footnote 92 The budget presentation appears to have all of the relevant information to specify performance metrics. Benchmarks and weights would have to be specified. If nothing else, this would make the incentive compensation process more objective and transparent and provide clear performance incentives directly to management decisionmakers.
7 Conclusions
The design and application of PBR to electric distribution companies in the U.S. has been slow to make progress. However, the pace of change has quickened, and PBR mechanisms of one kind or another are being adopted more rapidly by state regulators. We should think about PBR mechanisms as being composed of a set of incentive “building blocks.” These building blocks have not tended to be adopted all at once but instead sequentially. Several states have implemented, or are in the process of implementing, comprehensive PBR mechanisms for their distribution companies that share many elements of RIIO in Great Britain.
U.S. regulators have now learned that the phrase “PBR” does not necessarily imply a simple, forever, dynamic price-cap mechanism. Instead, a dynamic price-cap mechanism should be thought of as one component of a comprehensive PBR mechanism. With uncertainty, asymmetric information, moral hazard, rent-extraction goals, budget-balance constraints, etc., a simple forever price-cap mechanism for electricity distribution and transmission companies is optimal only under a very stringent and implausible set of assumptions.
These considerations naturally lead to ratchets, performance benchmarking, profit-sharing mechanisms, menus of contracts, quality incentives, and targeted incentives that are consistent with the broader set of policy goals beyond prices and costs. That’s what the theoretical literature teaches us. Equating PBR with a simple dynamic price cap was just a mistake from the perspective of selling PBR to U.S. electricity regulators.
The changes in the responsibilities of distribution companies in the last two decades have made PBR mechanisms more important and potentially more attractive—especially since the resources that state commissions have at their disposal to manage frequent formal rate cases are limited. These changes have also made designing and applying good PBR plans more challenging.
Resource limitations have also made it attractive for state regulatory commissions to learn from each other, to learn from other countries, especially Great Britain, and to rely on a variety of advisors and consultants for education and assistance. State regulatory agencies are now becoming more comfortable with PBR because the packages of PBR initiatives that they are now seeing are better aligned with the regulatory challenges that they face.
On the other hand, the willingness of FERC to consider, design, and apply modern PBR mechanisms to regulate the operation of and investment in transmission networks has been disappointing. The current situation is quite unsatisfactory, and more focused consideration of how FERC regulates and how ISO/RTOs are incentivized should be a priority.
There is an academic literature on this subject that has not attracted adequate attention from policymakers: e.g., Leautier (2000), Vogelsang (2001, 2006) and Hesamzadeh et al. (2018). We can and should draw on this extensive literature to create a better regulatory framework for transmission companies and system operators.
Notes
Generally attributed to Alfred Kahn, although I have not been able to find a specific reference to support the attribution of this statement. Peter Bradford has informed me that I could not find a specific reference to the statement attributed to Kahn because Kahn did not actually say it. Peter Bradford said it, though Bradford also agreed that the statement is frequently attributed to Kahn. Email from Peter Bradford to me dated April 2, 2024.
Laffont and Tirole (1993, pp. 18–19).
Quotation from MDPU (2019b, p. 49).
This paper was actually written in 2006 with very limited updates just prior to publication in 2014. The original version can be found on my web site: https://economics.mit.edu/sites/default/files/2022-09/Incentive%20Regulation%20in%20Theory%20and%20Practice%20Electric%20Transmission%20and%20Distribution%20Networks%20%28revised%29.pdf.
A settlement of a rate case refers to the frequent use of negotiations between key stakeholders and the affected utility to resolve issues before the regulatory agency renders its own final decision. When a sufficient number of stakeholders reach an agreement with the utility that is subject to the formal regulatory review or other regulatory action—such as introducing a PBR plan—a settlement that specifies the negotiated terms and conditions that the stakeholders have agreed to is presented to the regulatory commission for its approval. If the settlement agreement is approved by the regulatory commission, the terms and conditions of the settlement are included in the final decision and order that is issued by the regulatory agency. A settlement may resolve only some or all of the issues that are raised in a formal proceeding. If only some issues are resolved by the settlement, any remaining issues are litigated, and a decision is rendered by the regulatory agency.
There are both economic and legal rationales for requiring a regulatory system to give the regulated firm the ability to recover reasonable capital and operating costs, including the firm’s cost of capital, over a period of time that is consistent with the lives of the investments that the firm makes to fulfill its responsibilities. The economic rationales are that private firms will not invest if they do not expect to recover the associated costs, including a return on their investment that is greater than or equal to the “reasonable” expenditures on investment in capital facilities and the costs of operating these facilities. We can think of this as a “participation constraint.” “Reasonable costs,” is of course subject to interpretation, and disputes over what is reasonable and what is excessive are topics in most formal rate reviews. The legal constraint is best articulated in Federal Power Commission v. Hope Natural Gas Co., 320 U.S. 521 (1944), where the U.S. Supreme Court stated that it was the result that mattered—just and reasonable rates—not the specific methods that are used by the regulatory agency in coming to its decision. However, the basic principle that regulatory mechanisms must give utilities the opportunity to recover the reasonable costs that they incur to provide services to the public and that consumers should not be charged significantly more than reasonable costs has been embedded in state laws and decades of state regulatory decision. It is reflected in the incentive regulation literature by the application of balanced budget constraints, the incorporation of rent extraction goals, and a balancing of rent extraction and efficiency goals. Accordingly, as long as a PBR mechanism gives the distribution company a reasonable opportunity to recover its reasonable (read efficient) capital and operating costs, then the PBR mechanism can be a suitable complement to COSR regulation.
RIIO-1 and RIIO-2 cover electricity distribution (ED), electricity transmission (T), the system operation (ESO), gas distribution, and gas transmission. I refer primarily to the electricity distribution portions (RIIO-ED1 and RIIO-ED2) in this paper. As will be discussed further below, RIIO stands for Revenue = Inputs + Innovation + Outputs.
OFGEM RPI@20 review archive of reports and decisions. https://www.ofgem.gov.uk/energy-policy-and-regulation/policy-and-regulatory-programmes/rpi-x20-review?sort=publication_date
An ISO is an Independent System Operator. An RTO is a Regional Transmission Organization. There is little practical difference between ISOs and RTOs—aside from the former covering a single state and the latter multiple states. I will use the terms interchangeably or as “ISO/RTO”.
Nebraska has no IOUs. As far as I can tell, Texas was the last state to adopt state regulation of electric utilities when it created the Public Utility Commission of Texas in 1975. Prior to this date individual municipalities in Texas had regulatory oversight of electric utility rates and service obligations. The New Orleans City Council appears to be the last city that regulates the electric utility supplying electricity in the City.
FERC Order 888 (1996), as amended and expanded), https://www.ferc.gov/industries-data/electric/industry-activities/open-access-transmission-tariff-oatt-reform/history-oatt-reform/order-no-888. FERC Order 889 (1997, as amended and expanded), https://ferc.gov/industries-data/electric/industry-activities/open-access-transmission-tariff-oatt-reform/history-of-oatt-reform/order-no-889-1
FERC Order 2000 (1999), https://www.ferc.gov/sites/default/files/2020-06/RM99-2-000.pdf.
ERCOT—the ISO that covers about 90% of electricity that is supplied in Texas—is an exception: ERCOT is regulated primarily by the Public Utility Commission of Texas with some residual regulation by FERC with regard to reliability.
The U.S. has three synchronized networks: the Eastern Interconnection; the Western Interconnection; and ERCOT. Eastern Canada, except for Quebec, is synchronized with the Eastern Interconnection, and Western Canada is synchronized with the Western Interconnection. Alberta and Ontario have independent system operators, and Manitoba has joined the Midcontinent ISO.
Additional information on the Western RTO proposals. https://blog.ucsusa.org/mark-specht/western-grid-regionalization-is-back-on-the-drawing-board-why-now/, “Backers of Independent Western RTO Seek to Move Quickly,” RTO Insider, September 5, 2023, page 7.
An interesting question is exactly where the natural monopoly attributes lie for distribution and transmission. It has been suggested that at least for transmission, the natural monopoly is associated primarily with the system operating and planning functions rather than the ownership of transmission assets. As I will discuss below, this is consistent with the large number of owners of transmission facilities within each of the ISO/RTO regions, the opportunities for competitive procurement (tenders) of individual transmission facilities, and merchant transmission facilities with FERC-approved market-based rates.
The U.S. Energy Information Administration (EIA) lists 168 IOUs in 2017. However, I believe that this includes IOUs that do not provide distribution service, such as stand-alone transmission companies, and some very small distribution companies. I used Form 1 data for “major” electric utilities and counted 135 that provided distribution service in 2020. The EIA also indicates that there were 812 cooperative utilities (which I suspect includes coop G&T companies that do not serve retail customers) and 1,958 municipal utilities (which I suspect includes some state agencies that are wholesale suppliers of generation services to municipal utilities). https://www.eia.gov/todayinenergy/detail.php?id=40913
The PUHCA was passed in 1935 in response to holding company regulatory and financial abuses and placed severe restrictions on the formation of public utility holding companies. https://www.everycrsreport.com/reports/RL33739.html
Edison Electric Institute member map. https://www.eei.org/-/media/Project/EEI/Documents/About/EEI-Member-Map.pdf
The Clean Energy States Alliance provides state by state information. https://www.cesa.org/projects/100-clean-energy-collaborative/guide/map-and-timelines-of-100-clean-energy-states/
The costs of utility-scale wind and solar generation in some regions have fallen so much that there would be substantial penetration of these generating technologies based on pure economics alone. Tax and other subsidies have made wind and solar attractive as well. For example, in ERCOT (Texas), wind and solar generation’s share is greater than the state’s renewable energy standards.
Retail electricity competition by state. https://www.eia.gov/todayinenergy/detail.php?id=55820
Electricity generation (utility and independent power producers) in the U.S. was essentially flat from 2011 to 2021. https://www.eia.gov/electricity/annual/html/epa_01_03.html However, it is anticipated that the rapid diffusion of EVs, heat pumps, and other devises to electrify key residential, commercial, and some industrial segments—either direct electrification or via the use of hydrogen produced with electricity—will lead to significant increases in the demand for electricity between now and 2050.
There has been little theoretical or empirical literature that examines the extent of and effects of regulatory resource constraints. The little research that has been published focuses on developing countries. Pollitt and Stern (2011) provide evidence that there are significant regulatory resource constraints that limit the scope and effectiveness of regulation in the developing countries that they study. This subject is worthy of additional research.
Information about OFGEM can be found at: https://www.ofgem.gov.uk/
FERC reports (as of 2023) that it has 1566 members on its staff (see Table 1). It is an adjudicatory agency that relies on formal administrative rulemakings to adopt new policies, and on “paper” and live public hearings to resolve disputes. As of 2010, when it had 1457 employees, it had about a dozen administrative law judges and 263 attorneys. It had about 140 civil engineers who are required to support hydro licensing, inspection, and relicensing cases. About 300 members of the staff were energy analysts. https://www.eeoc.gov/federal-sector/federal-energy-regulatory-commission-ferc-0
PEPCO (2020) Outline of proposed Multi-year Rate Plan for the District of Columbia https://www.pepco.com/MyAccount/MyBillUsage/Documents/Pepco%20Multi-Year%20Plan%20FACT%20SHEET%209.24.20.pdf
Littlechild has confirmed to me that this was indeed the case.
See also Joskow (1974).
For vertically integrated utilities with generating facilities, fuel-cost changes were typically automatically recovered in rates with a fuel adjustment clause so that general rate cases were not necessary to recover these costs.
SAIDI stands for System Average Interruption Duration Index; SAIFI stands for System Average Interruption Frequency Index; and CAIDI stands for Customer Average Duration Index. https://www.eia.gov/electricity/annual/html/epa_11_01.html
Spot for Clean Energy, “State Policy Opportunity Tracker,” https://spotforcleanenergy.org/state/wyoming/decoupling-and-dsm-performance-incentives/ accessed September 2, 2023.
Additional information about California Public Utilities Commission (CPUC) General Rate Cases can be found at: https://www.cpuc.ca.gov/industries-and-topics/electrical-energy/electric-rates/general-rate-case
Catherine Mitchell, Blog post on REV, June 13, 2016: http://projects.exeter.ac.uk/igov/us-regulatory-reform-ny-utility-transformation/
New York Public Service Commission approval of Brooklyn Demand Management program, https://breakingenergy.com/2014/12/22/ny-psc-approves-con-edison-bqdm-program/
New York Public Service Commission approvals. https://www3.dps.ny.gov/W/PSCWeb.nsf/All/B2D9D834B0D307C685257F3F006FF1D9
The rulemaking was closed in 2021. https://www.google.com/url?sa=i&rct=j&q=&esrc=s&source=web&cd=&cad=rja&uact=8&ved=0CDgQw7AJahcKEwiQ2Ijih4-BAxUAAAAAHQAAAAAQAg&url=https%3A%2F%2Fdocs.cpuc.ca.gov%2FPublishedDocs%2FPublished%2FG000%2FM397%2FK186%2F397186433.docx&psig=AOvVaw0uhE2jp0_JKAZhImdACpID&ust=1693851627972007&opi=89978449
Massachusetts laws that govern certain long term contracts for renewable energy. https://www.mass.gov/info-details/laws-governing-long-term-contracts-for-renewable-energy
Massachusetts competitive retail electricity supply data. https://www.mass.gov/info-details/electric-gas-customer-choice-data#electric-customer-choice-data
Massachusetts regulations that govern certain long-term contracts for renewable energy at: https://www.mass.gov/regulations/220-CMR-1700-long-term-contracts-for-renewable-energy
The specific pilot programs and the regulatory and legislative history are discussed at: https://docs.cpuc.ca.gov/PublishedDocs/Published/G000/M473/K817/473817565.PDF
I must wonder whether the devastating August 2023 fire on Maui and the subsequent criticisms of Hawaiian Electric will lead this plan to be reviewed. https://www.washingtonpost.com/climate-environment/2023/08/12/maui-fire-electric-utility/. See also “Hawaii Utility Kept Wildfire Plan Quiet, Wall Street Journal, October 7–8, 2023, page A6 (print edition).
U.S. Energy Information (EIA) data on electricity generation sources by state. https://www.eia.gov/state/print.php?sid=HI
Data on clean energy for Hawaii. https://www.hawaiianelectric.com/clean-energy-hawaii/our-clean-energy-portfolio
For a summary of the key provisions of the PBR plan that was approved by the Public Utility Commission of Hawaii, see: https://puc.hawaii.gov/wp-content/uploads/2020/12/PBR-Phase-2-DO-5-Page-Summary.Final_.12-22-2020.pdf
OFGEM RIIO electricity distribution archive. https://www.ofgem.gov.uk/search?keyword=RIIO%20ED
Cave (2024) discusses the increasing complexity of regulation in general under RIIO-1 and RIIO-2 and some of the potential implications for the performance of these more complex incentive regulation mechanisms. These observations apply as well to the evolving PBR mechanisms in some states in the U.S.
OFGEM Handbook for Implementing RIIO Model, October 4, 2010. https://www.ofgem.gov.uk/sites/default/files/docs/2010/10/riio_handbook_0.pdf
Duma et al., (2024) discuss the nature and implications of uncertainties that have been created by the obligations that have been imposed on distribution and transmission networks to support “net zero” goals in the UK. The paper argues that a dynamic adaptive approach to regulation that can respond to these uncertainties as contingencies are realized is important for sustaining good regulatory performance. The uncertainties are even greater in the U.S. as a consequence of the absence of a credible durable set of federal decarbonization policies and the importance of state decarbonization policies that can vary widely from state to state. In addition, many states that have adopted net zero goals have not specified clear pathways to get from here to there. On the other hand, as a consequence of the restructuring of IOUs in the late 1990s and early 2000s, many states have experience in adapting their regulatory frameworks to new economic and policy environments while protecting investors (e.g., the adoption of stranded cost recovery mechanisms).
Cave (2024) makes similar observations.
FERC Orders 888, 889, and 2000(A) as revised over time. https://www.ferc.gov/major-orders-regulations.
Major FERC Orders and Regulations at: https://www.ferc.gov/major-orders-regulations FER.
Western Energy Imbalance Market. https://www.westerneim.com/Pages/About/default.aspx
CAISO manages the Western Energy Imbalance Market. https://www.caiso.com/Documents/western-energy-imbalance-market-fact-sheet.pdf
In Order 1000, FERC created additional transmission planning regions to cover regions where there are not ISO/RTOs. https://www.ferc.gov/media/regions-map-printable-version-order-no-1000
For vertically integrated utilities that have fully unbundled transmission service, revenue requirements and transmission prices are fully subject to FERC regulation. Where utilities have not fully unbundled transmission service, an allocation of costs between transmission for “native load” (captive retail customers) and transmission that is provided to third parties (“wholesale”) must be done. State regulators determine revenue requirements for transmission with the use of COSR for the transmission service that is provided to serve native load, and FERC regulates revenue requirements and transmission prices for the portion of transmission service that is provided to third parties pursuant to the relevant OATT.
The Electric Reliability Council of Texas (ERCOT) is an exception. Transmission is regulated by the Public Utility Commission of Texas (PUCT). ERCOT accounts for about 90% of the electricity that is produced in Texas and the ERCOT grid is not synchronized with the Eastern and Western grids, connected to them only by a small set of DC interconnections with very small transfer capabilities. The history of this arrangement would require a separate paper—probably in a political science journal. https://www.ercot.com/services/rq/tdsp
The operation of the energy markets has some effect on the transmission costs that are ultimately billed to retail customers. This is the case because the wholesale energy markets rely on locational marginal prices, and the difference in prices between two nodes is a measure of the cost of transmission network congestion. The ISO/RTO issues Financial Transmission Rights, which serve as hedges for differences between nodal prices and the revenues from sales of the rights that ultimately are allocated to the transmission owners. These revenues can be credited against the transmission owners’ revenue requirement. However, the revenues seem to be relatively small: For example, in ISO-NE, the annual revenue from the sale of congestion revenue rights is about $100 million while the annual transmission revenue requirement is about $2.5 billion. See ISO New England Annual Market Report 2022, page 144. https://www.iso-ne.com/static-assets/documents/2023/06/2022-annual-markets-report.pdf.
FERC formula rate details are at: https://www.ferc.gov/formula-rates-electric-transmission-proceedings-key-concepts-and-how-participate
FERC treatment of supplemental transmission investments is discussed at: https://www.pjm.com/planning
PJM reforms with regard to supplemental transmission investments are discussed at: https://www.pjm.com/-/media/committees-groups/committees/pc/20191011-special-m3/20191011-item-03a-transmission-owner-lessons-learned-presentation.ashx
Docket No. EL17-45-000, Order Denying Complaint, August 31, 2018. https://elibrary.ferc.gov/eLibrary/filelist?accession_number=20180831-3024&optimized=false
Complain to FERC regarding treatment of local transmission investments. https://www.utilitydive.com/news/ferc-local-transmission-pjm-aep-duke-ohio-occ-consumers-counsel-complaint/695147/
FERC transmission incentives. https://www.ferc.gov/electric-transmission
FERC transmission incentives. https://www.ferc.gov/sites/default/files/2020-04/E-3_23.pdf
FERC transmission incentives. https://www.ferc.gov/incentives/transmission-incentives
FERC transmission cybersecurity incentives https://www.ferc.gov/media/e-1-rm22-19-000-0
FERC does have limited “backstop” siting authority in some situations, but it has never been used successfully. The Infrastructure Investment and Jobs Act (2021) expanded this authority, but it is likely to be several years before this authority is tested. https://www.whitehouse.gov/briefing-room/statements-releases/2021/08/02/updated-fact-sheet-bipartisan-infrastructure-investment-and-jobs-act/
Such projects are apparently also eligible for FERC’s targeted incentives.
Examples are the Champlain-Hudson Power Express project (https://chpexpress.com/), the TransWest Express transmission project (https://www.transwestexpress.net/), and the SOO-Green transmission project (https://soogreen.com/).
Unfortunately, the contracts for several of these projects have been abandoned due to unanticipated increases in costs since the contracts were signed. Dominion Energy’s Offshore wind project is a regulated project whose costs will be included in its rate base and revenue requirement. It has not been cancelled. New York has refused to renegotiate three of its offshore wind contracts. https://www.spglobal.com/marketintelligence/en/news-insights/latest-news-headlines/offshore-wind-contract-disputes-proliferate-as-high-costs-jeopardize-us-buildout-76164337; https://commonwealthmagazine.org/energy/new-york-rejects-bid-to-renegotiate-offshore-wind-contracts/
Massachusetts has relied on this model to select transmission projects for hydro-electric supplies from Quebec.
FERC Transmission Planning Regions. https://www.google.com/url?sa=t&rct=j&q=&esrc=s&source=web&cd=&cad=rja&uact=8&ved=2ahUKEwj36PyWjbCCAxVNElkFHTYQCpgQFnoECBUQAQ&url=https%3A%2F%2Fwww.ferc.gov%2Fsites%2Fdefault%2Ffiles%2Findustries%2Felectric%2Findus-act%2Ftrans-plan%2Ftrans-plan-map.pdf&usg=AOvVaw0TsIRph3S-iKimwLCjSoYR&opi=89978449
Interconnection queue data: https://emp.lbl.gov/sites/default/files/queued_up_2022_04-06-2023.pdf
Regional transmission organization performance grades: https://www.cleanenergygrid.org/portfolio/transmission-planning-development-regional-report-card/. See also the grades for individual metrics on page 7.
We also need to understand that FERC’s expectations for ISO/RTOs planning responsibilities have changed over time and that adjustments to expectations take time: ISO/RTOs were originally conceived of as having a relatively passive short-term planning role, while in recent years FERC’s expectations appear to have given ISO/RTOs a more active long-term planning role.
FERC NOPR on interconnection rules: https://www.ferc.gov/news-events/news/ferc-issues-transmission-nopr-addressing-planning-cost-allocation
FERC proposed rules governing transmission planning: https://www.ferc.gov/media/e-1-order-2023-rm22-14-000
I suppose that one could argue that the stakeholder processes are not too dissimilar from what goes on in the processes that lead to settlements of rate cases at the state level.
In Great Britain, OFGEM has defined a class of “Independent Distribution Network Operators.” These are small local distribution and transmission companies that supply housing and commercial developments. They are subject to a regulatory mechanism of “relative price control”: Under this mechanism their charges are capped at prices that are broadly equivalent to the charges that are permitted by the large primary distribution network operators that are subject to the more complex set of PBR mechanisms. See https://idno.vattenfall.co.uk/about/idno-vs-dno. Dennis Weisman has pointed out to me that many small independent telephone companies remained under COSR while the larger Bell operating companies and GTE became subject primarily to price-cap regulation.
Another complication arises when vertically integrated utilities have not fully unbundled transmission service. In these cases state and federal regulators share responsibility for determining allowable costs, allowed rates or return, and revenue requirements.
ISO New England’s proposed 2024 operating and capital budget: https://www.iso-ne.com/static-assets/documents/2023/08/6_isone_2024_proposed_op_cap_budget.pdf
Ibid., page 198.
ISO New England’s transmission owner revenue requirement and sunk investment: https://www.iso-ne.com/static-assets/documents/2023/02/supplemental_to_2022_ptoac_annual_update_filing_final.zip
ERCOT board and executives resigned after the February 2021 outages. https://www.texastribune.org/2021/02/23/ercot-members-resign-texas/; https://www.texastribune.org/2021/02/23/ercot-members-resign-texas/
ISO New England’s proposed 2024 operating and capital budget. https://www.iso-ne.com/static-assets/documents/2023/08/6_isone_2024_proposed_op_cap_budget.pdf
References
Americans for a clean energy grid (2023). Transmission planning and development regional report card. Report. June. https://www.cleanenergygrid.org/wp-content/uploads/2023/06/ACEG_Transmission_Planning_and_Development_Report_Card.pdf
Armstrong, M., & Sappington, D. (2004). Toward a synthesis of models of regulatory policy design with limited information. Journal Pf Regulatory Economics, 26(1), 5–21. https://doi.org/10.1023/B:REGE.0000028011.71612.70
Armstrong, M., & Sappington, D. (2007). Recent Developments in the Theory of Regulation. In M. Armstrong & R. Porter (Eds.), Handbook of Industrial Organization (Vol. III, pp. 1557–1700). Elsevier Science Publishers.
Baumol, W. J. (1982). Productivity and incentive clauses and rate adjustment for inflation. Public Utilities Fortnightly, 110(2), 12–18.
Brattle (2017). Performance Based Regulation Plans: Goals, Incentives, and Alignment. Report Prepared for DTE Energy by Zarakis, W., Brown, T., Grausz, T. & Trewn, H. December 6.
Cave, M. (2024). Incentive regulation: Expectations, surprises and the road forward. Review of Industrial Organization, this issue.
DeLosa, J. Pfeifenberger, J, and Joskow, P. (2024). Regulation of Access, Pricing, and Planning of High Voltage Transmission in the U.S. National Bureau of Economic Research, Working Paper number 32254. March
Duma, D., Pollitt, M., & Covatariu, A. (2024). Regulatory learning in the face of net zero climate policy: The case of the U.K. Review of Industrial Organization, this issue. https://doi.org/10.17863/CAM.109000
Eto, J., Stoft, S. & Belden, T. (1994). The Theory and Practice of Decoupling. Lawrence Berkeley Laboratory, LBL-34555, January. https://emp.lbl.gov/publications/theory-and-practice-decoupling
Federal Energy Regulatory Commission (FERC). (2022). Building for the Future Through Electric Regional Planning and Cost Allocation and Interconnection RM21-17-000, April. https://www.ferc.gov/media/rm21-17-000
Federal Energy Regulatory Commission (FERC). (2023a). Major Landmark Orders and Regulations, https://www.ferc.gov/major-orders-regulations
Federal Energy Regulatory Commission (FERC). (2023b. Improvements to Generation Interconnections Procedures and Agreements, Order 2023. https://www.ferc.gov/media/e-1-order-2023-rm22-14-000
Hesamzadeh, M. R., Rosellon, J., Gabriel, S. A., & Vogelsang, I. (2018). A simple regulatory incentive mechanism applied to electricity transmission pricing and investment. Energy Economics, 75, 423–439. https://doi.org/10.1016/j.eneco.2018.08.033
Jamasb T. (2020). Incentive Regulation of Electricity and Gas Networks in the UK: From RIIO-1 to RIIO-2. Copenhagen Business School. https://research.cbs.dk/en/publications/incentive-regulation-of-electricity-and-gas-networks-in-the-uk-fr
Joskow, P. L. (1973). Pricing Decisions of Regulated Firms: A Behavioral Approach. Bell Journal of Economics and Management Science, 4, 118–40.
Joskow, P. L. (1974). Inflation and environmental concern: Structural change in the process of public utility regulation. Journal of Law and Economics, 17, 291–327.
Joskow, P. L. (2005). Transmission policy in the United States. Utilities Policy, 13, 95–115. https://doi.org/10.1016/j.jup.2004.12.005
Joskow, P. L. (2014). Incentive Regulation in Theory and Practice: Electric Distribution and Transmission Networks. In N. Rose (Ed.), Economic Regulation and Its Reform, chapter 5 (pp. 291–343). University of Chicago Press.
Joskow, P. L. (2020). Competition for Electric Transmission Projects in the USA: FERC Order 1000. In M. R. Hesamzadeh, J. Rosellon, & I. Vogelsang (Eds.), Transmission Network Investment in Liberalized Markets (pp. 275–322). Springer Nature Switzerland AG.
Joskow, P. L. (2021). Facilitating Transmission Expansion to Support Efficient Decarbonization of the Electricity Sector. Economics of Energy and Environmental Policy, 10(2), 57–91. https://doi.org/10.5547/2160-5890.10.2.pjos
Joskow, P. L., & Schmalensee, R. (1983). Markets for power: An analysis of electric utility deregulation. MIT Press.
Joskow, P. L., & Schmalensee, R. (1986). Incentive regulation for electric utilities. Yale Journal on Regulation, 4, 1–49.
Kahn, A. E. (1971). The economics of regulation: Principles and institutions (Vol. II). Wiley.
Laffont, J. J., & Tirole, J. (1993). A theory of incentives in regulation and procurement. MIT Press.
Leautier, T.-O. (2000). Regulation of an electric power transmission company. The Energy Journal, 21(4), 61–92. https://doi.org/10.5547/ISSN0195-6574-EJ-Vol21-No4-3
Littlechild, S. (1983). Regulation of British Telecommunications’ Profitably. Report to the Secretary of State, Department of Industry, London.
Littlechild, S. (2009). RPI-X Regulation: OFGEM’s RPI-X@20 Review and the Scope of More Customer Involvement. Network, 34, 1–8. https://www.accc.gov.au/about-us/publications/serial-publications/network/network-issue-34
Lowry, M.N., Makos, M., Deason, J., & Schwartz, L. (2017). Performance-Based Regulation Using Multiyear Rate Plans for U.S. Electric Utilities. Grid Modernization Consortium, U.S. Department of Energy. July
Lowry, M. N., & Kaufmann, L. (2002). Performance-based regulation of utilities. Energy Law Journal, 23, 399–457.
Lyon, T. (1996). A model of sliding scale regulation. Journal of Regulatory Economics, 9(3), 227–247. https://doi.org/10.1007/BF00133475
Maine Public Utilities Commission (MPUC). (2023). RE Central Maine Power Company, Order and Stipulation. https://s24.q4cdn.com/489945429/files/doc_downloads/avangrid2019/final_decision/2023/cmp-rate-case-final-decision.pdf
Marnay, C. & Colmnes, G.A. (1990). Ratemaking for Conservation: The California ERAM Experience. Prepared for the U.S. Department of Energy (LBL-28019), March
Massachusetts Department of Public Utilities (MDPU). (2019a). Re NSTAR Electric Company, D.P.U. # 17-05
Massachusetts Department of Public Utilities (MDPU). (2019b). Decision and Order RE: Petition of Massachusetts Electric Company and Nantucket Electric Company d/b/a National Grid. Docket 18–150, September 30, 2019. https://fileservice.eea.comacloud.net/FileService.Api/file/FileRoom/11262053
Massachusetts Department of Public Utilities (MDPU). (2016). Re: D.P.U. 16–08, Massachusetts Electric Company and Nantucket Electric Company d/b/a National Grid Service Quality Compliance Plan. https://fileservice.eea.comacloud.net/FileService.Api/file/FileRoom/9209700 .
Massachusetts Department of Public Utilities (MDPU). (2022). Docket #22–22, Petition of NSTAR Electric Company, doing business as Eversource Energy, pursuant to G.L. c. 164, § 94 and 220 CMR 5.00, for Approval of a General Increase in Base Distribution Rates for Electric Service and a Performance Based Ratemaking Plan. November 30. https://fileservice.eea.comacloud.net/FileService.Api/file/FileRoom/15824195
National Renewable Energy Laboratory (NREL). (2017). “Next Generation Performance-based Regulation,” NREL/TP-6850-68512, September.
New York Public Service Commission (NYPSC). (2016). Case 14-M-0101, Order Adopting A Ratemaking and Utility Revenue Model Policy Framework, May 19. https://documents.dps.ny.gov/public/Common/ViewDoc.aspx?DocRefId={D6EC8F0B-6141-4A82-A857-B79CF0A71BF0}
OFGEM. (2008a). “Is RPI-X Still Fit For Purpose After 20 Years?” Beesely Lecture by Alistair Buchanan, October 2. https://www.ofgem.gov.uk/publications/rpi-x-still-fit-purpose-after-20-years-speech-alistair-buchanan-beesley-lecture-london-2-october-2008
OFGEM. (2008b). “OFGEM’s ‘RPI at 20’ Project,” Speech by Alistair Buchanan. SBGI, March 15. https://www.ofgem.gov.uk/sites/default/files/docs/2008/03/ab-march-08.pdf
OFGEM. (2010a). RPI-X@20 Review Archive, https://www.ofgem.gov.uk/energy-policy-and-regulation/policy-and-regulatory-programmes/rpi-x20-review
OFGEM. (2010b). “Handbook for Implementing the RIIO Model,” October 4. https://www.ofgem.gov.uk/sites/default/files/docs/2010/10/riio_handbook_0.pdf
OFGEM. (2017). “Guide to RIIO-ED1 Electricity Distribution Price Control,” January 18, 2017. https://www.ofgem.gov.uk/sites/default/files/docs/2017/01/guide_to_riioed1.pdf
OFGEM. (2018). Archive of documents related to RIIO-T1. https://www.ofgem.gov.uk/energy-policy-and-regulation/policy-and-regulatory-programmes/network-price-controls-2013-2023-riio-1/transmission-price-control-2013-2021-riio-t1?sort=publication_date&page=4
OFGEM. (2019a). Archive of documents related to RIIO-T2. https://www.ofgem.gov.uk/energy-policy-and-regulation/policy-and-regulatory-programmes/network-price-controls-2013-2023-riio-1/transmission-price-control-2013-2021-riio-t1?sort=publication_date&page=3
OFGEM. (2019b) “RIIO-2 Sector Specific Methodology-Core Document,” May 24. https://www.ofgem.gov.uk/sites/default/files/docs/2019/05/riio-2_sector_specific_methodology_decision_-_core_30.5.19.pdf
OFGEM. (2022). “RIIO-ED2 Final Determinations, November 30. https://www.ofgem.gov.uk/publications/riio-ed2-final-determinations
OFGEM. (2023). Electric System Operator (ESO) Regulation, Document Archive. https://www.ofgem.gov.uk/energy-policy-and-regulation/policy-and-regulatory-programmes/electricity-system-operator-eso-regulation
OXERA. (2022). RIIO-ED2 Draft Determinations. July. https://www.oxera.com/insights/agenda/articles/riio-ed2-draft-determinations/
PEPCO (2020). PEPCO’s Multi-year Rate Plan. https://www.pepco.com/SiteCollectionDocuments/MyAccount/MyBillUsage/Pepco_MYP_FactSheet.pdf
Pollitt, M., & Stern, J. (2011). Human resource constraints for electricity regulation in developing countries: Developments since 2001. Utilities Policy, 19, 53–60. https://doi.org/10.1016/j.jup.2010.05.001
Posner, R. A. (1971). Taxation by regulation. Bell Journal of Economics and Management Science, 2(1), 20–50.
Public Utilities Commission of the State of Hawaii (PUCH). (2020), “Instituting a Proceeding to Investigate Performance Based Regulation,” Docket No: 2018–0088, Decision and Order No. 37507. December 23. https://puc.hawaii.gov/wp-content/uploads/2020/12/2018-0088.PBR_.Phase-2-DO.Final_.mk_.12-22-2020.E-FILED.pdf
Regulatory Assistance Project. (2011). Electricity Regulation in the U.S.: A Guide. March. Vermont.
Regulatory Assistance Project. (2021). Performance-Based Regulation: An Overview. Presentation by Kadoch, C., Prause, E. & Weston, R. 15 November.
Regulatory Assistance Project. (2018). Next Generation Performance Based Regulation. Volume 2 of 3 Volumes. https://rmi.org/states-move-swiftly-on-performance-based-regulation-to-achieve-policy-priorities/
Rocky Mountain Institute. (2022). States Move Quickly to Performance Based Regulation to Achieve Policy Priorities. Report prepared by Wilson, G., Felder, C, & Gold, R. March 31. https://rmi.org/states-move-swiftly-on-performance-based-regulation-to-achieve-policy-priorities/
Sappington, D. (2005). Regulating service quality: A survey. Journal of Regulatory Economics, 27, 123–154. https://doi.org/10.1007/s11149-004-5341-9
Sappington, D., Pfeifenberger, H., Hanser, P., & Basheda, G. N. (2001). The state of performance based regulation in the electric utility industry. The Electricity Journal, 14(8), 71–79. https://doi.org/10.1016/S1040-6190(01)00240-8
Sappington, D., & Weisman, D. L. (2010). Price cap regulation: What have we learned from twenty-five years of experience in the telecommunications industry? Journal of Regulatory Economics, 38, 227–257. https://doi.org/10.1007/s11149-010-9133-
Schmalensee, R. (1989). Good regulatory regimes. Rand Journal of Economics, 20(3), 427–436. https://doi.org/10.2307/2555580
Schlissel, D. & Summer, A. (2013). Public Utility Regulation Without the Public: The Alabama Public Service Commission and Alabama Power. Report Prepared for Arise Citizens’ Policy Project, March 1.
S&P Global Market Intelligence (2023). Rate Requests by Energy Utilities Hits Another High in 2022. February 16. https://www.spglobal.com/marketintelligence/en/news-insights/research/rate-requests-by-energy-utilities-hit-another-all-time-record-in-2022
Synapse Energy Economics (2019). Multiyear Rate Plans: Core Elements and Case Studies. Report prepared by M. Whited and C. Roberto, September 30.
U.S. Energy Information Administration (2019). U.S. Electric Rate Cases Filed with Regulators 1980–2018. https://www.eia.gov/todayinenergy/detail.php?id=40133.
Vogelsang, I. (2018). Can simple regulatory mechanisms realistically be used for electricity transmission investment. Economics of Energy and Environmental Policy, 7(1), 63–88. https://doi.org/10.5547/2160-5890.7.1.ivog
Vogelsang, I. (2001). Price regulation of independent transmission companies. Journal of Regulatory Economics, 20, 141–165. https://doi.org/10.1023/A:1011103328722
Vogelsang, I. (2006). Electricity transmission pricing and performance based regulation. The Energy Journal, 27(4), 97–126. https://doi.org/10.5547/ISSN0195-6574-EJ-Vol27-No4-5
Acknowledgements
I am grateful to David Sappington, Dennis Weisman, Mark Lowry, and Matt Makos for extensive comments on an earlier draft of this paper. Dick Schmalensee provided helpful comments on the penultimate draft. Michael Pollitt provided very useful information to me about the regulatory reforms in Great Britain –“RIIO”-- and directed me to OFGEM’s voluminous archive of information about the RPI-X@20 review, RIIO-1, and RIIO-2. Stephen Littlechild also provided useful comments, and discussions with Hannes Pfeifenberger and Joe DeLosa clarified a number of issues that are related to FERC regulation of transmission revenue requirements. I am also grateful for support from the MIT Energy Initiative and the Economics of Energy Fund in the MIT Department of Economics.
Funding
'Open Access funding provided by the MIT Libraries'.
Author information
Authors and Affiliations
Contributions
I am the sole author of this paper. I have credited people who provided comments to me in footnote #1.
Corresponding author
Ethics declarations
Competing interest
The authors declare no competing interests.
Rights and permissions
Open Access This article is licensed under a Creative Commons Attribution 4.0 International License, which permits use, sharing, adaptation, distribution and reproduction in any medium or format, as long as you give appropriate credit to the original author(s) and the source, provide a link to the Creative Commons licence, and indicate if changes were made. The images or other third party material in this article are included in the article's Creative Commons licence, unless indicated otherwise in a credit line to the material. If material is not included in the article's Creative Commons licence and your intended use is not permitted by statutory regulation or exceeds the permitted use, you will need to obtain permission directly from the copyright holder. To view a copy of this licence, visit http://creativecommons.org/licenses/by/4.0/.
About this article

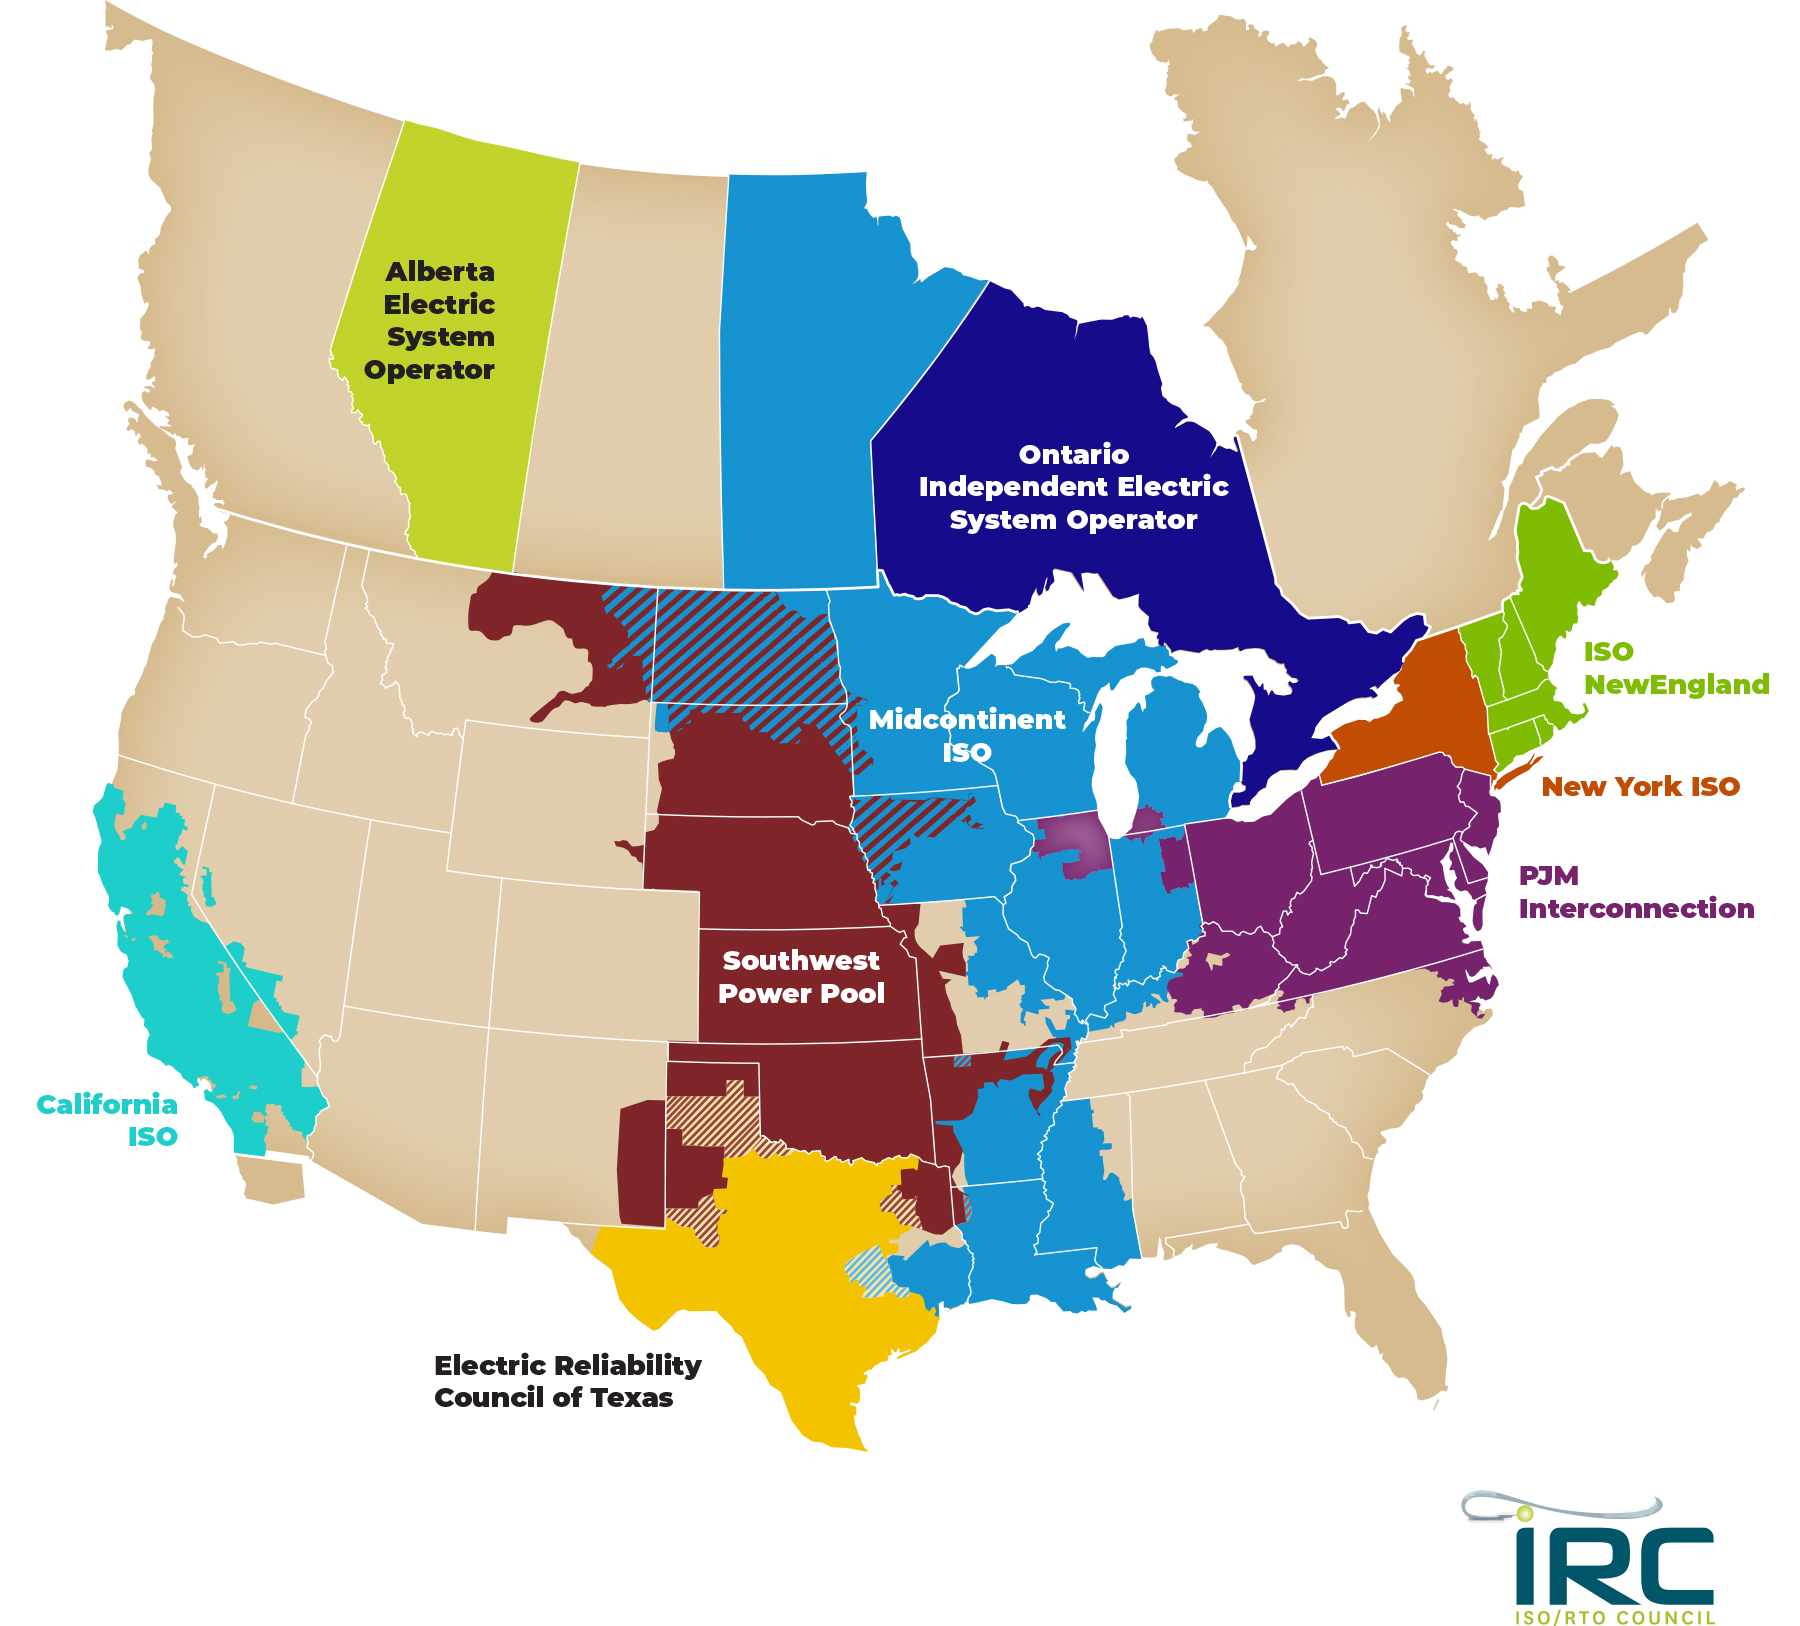
Cite this article
Joskow, P.L. The Expansion of Incentive (Performance-Based) Regulation of Electricity Distribution and Transmission in the United States. Rev Ind Organ (2024). https://doi.org/10.1007/s11151-024-09973-x
Accepted:
Published:
DOI: https://doi.org/10.1007/s11151-024-09973-x